 🏗️ New Construction
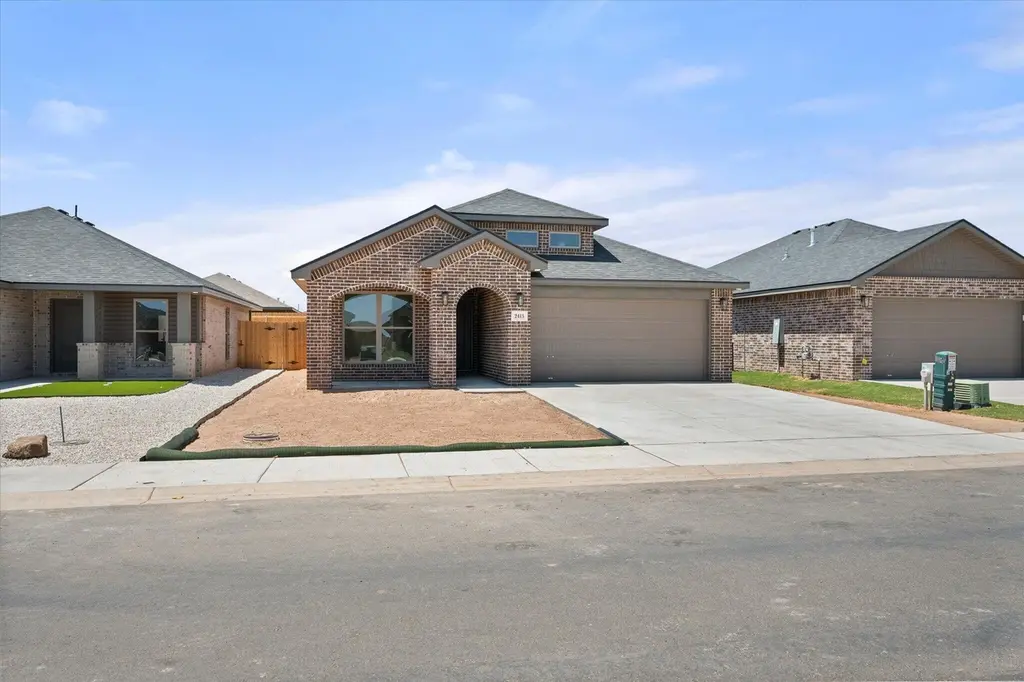
2413 Bryan Ave · Wolfforth, TX
Flood risk No data
- FEMA flood zone
- —
- Chance of flooding over 30 yrs
- —
- Est. flood insurance / yr
- —
Fire risk No data
- Est. fire insurance / yr
- —
Heat risk No data
- Hot days now (above threshold)
- —
- Hot days in 30 yrs
- —
Wind risk No data
- Chance of severe wind over 30 yrs
- —
Air-quality risk No data
- Unhealthy air days now
- —
- Unhealthy air days in 30 yrs
- —
Risk factors via First Street. Map © Google.
Why this score? — see what drove the D grade
The composite is a weighted blend of 9 inputs, each scored 0–100. Each bar is that input's sub-score; the figure is the points it added to the 100-point composite (weight × sub-score).
- Appreciation +10.0/10.0
- ARV discount +7.5/15.0
- Cash flow +7.1/30.0
- Schools +4.4/10.0
- Livability +4.0/5.0
- Rent growth +2.5/5.0
- Condition / age +2.5/5.0
- 1% rule +1.9/10.0
- DSCR +1.3/10.0
$256,000
🖨 Deal sheet (PDF) 📄 Offer letter ✓ Due diligence
Listing remarks
Buy NOW and get up to $8,000 Use-It-Your-Way Cash! The 1,600 sq. ft. Lily floor plan offers the space you need with a layout designed for easy, everyday living. Enjoy an open-concept kitchen, living, and dining area with a large island, granite or quartz countertops, and stainless steel appliances. Luxury vinyl plank flooring runs through the main areas, while the private primary suite features a walk-in closet and double vanity. A brick exterior, enclosed pantry, and covered front and back patios complete this well-rounded home.
Key facts
- Open-concept kitchen
- Large island
- 5,175 sq ft lot
Tags
Property features AI
Exterior
- Parking: Attached garage; 2 garage spaces; Driveway
- Utilities: Public water; Public sewer; Electricity available; Natural gas available; Cable available; Phone available
- Home design: Single family residence; New construction; Single-story; Slab foundation
- Construction: Brick construction; Composition roof; Built as new construction
- Exterior features: Private yard; Front porch; Rear porch; Fenced backyard (wood)
Interior
- Kitchen: Range; Free‑standing range; Dishwasher; Disposal; Microwave
- Bedrooms: 6 total rooms (includes bedrooms and living spaces)
- Flooring: Carpet; Vinyl
- Bathrooms: 2 full bathrooms
- Heating & cooling: Central heating (natural gas); Central air; Electric cooling; Ceiling fans
- Interior features: Ceiling fans; Open floor plan; Pantry
- Laundry & utility: Dedicated laundry room
Neighborhood map
What this means for you Summary
Snapshot
- This is a 4-bed/2.0-bath single-family listed at $256k.
Deal economics
- At list price, monthly cash flow is $-368 ($-4k/yr) — negative.
- To cash-flow at today's rent, offer at most $203k (20.8% below list).
- To meet the 1% rule (rent ≥ 1% of price), the offer needs to be $177k (30.7% below list).
- Recommended offer: $177k (30.7% below list) — sets the bar for 1% rule.
Location & tenants
- Location reads 80/100 on livability (#43 in TX, #1,872 nationally) — a professional / high-income tenant draw. Strengths: cost of living A+, housing A+, health & safety A+; Watch: amenities F, commute F.
- Frenship ISD (urban): math 47% / reading 54% proficiency, ranked #162 of 826 in TX (top 20%) — acceptable for families but not a draw, mixed tenant base, ~2y average lease.
- Zoned schools: Upland Heights El (math 49% / reading 55%, grade C-, #742 of 4,322 statewide, top 19%, 840 students, 46% FRL); Frenship Middle (math 46% / reading 50%, grade C-, #400 of 1,662 statewide, top 24%, 833 students, 47% FRL); Frenship H S (math 44% / reading 65%, grade C-, #379 of 1,632 statewide, top 26%, 3,247 students, 46% FRL).
- Market conditions: 474 active listings in the ZIP; 22 comparable units currently listed for rent nearby; rentals lingering (median 46d on market — plan ~5-8 weeks vacancy on turnover, expect pricing pressure); 50% of comp listings sitting > 30 days — soft ceiling on asking rent; solid renter incomes; 2,219 units permitted in Lubbock County in 2024 (252 in 5+ unit buildings).
Forward outlook
- In year one you build about $27k of equity ($2k loan paydown + $26k appreciation (10.0% local appreciation)).
- Lubbock County population projected at +39% by 2050 — long-run rental-demand tailwind backs the buy-and-hold thesis.
- By year 2, paydown + projected appreciation supports a ~$44k cash-out refi (75% LTV) — recoverable capital for the next deal without selling this one.
Negotiation context
- It's been on market 33 days — a 3% lower offer ($248k) is reasonable based on typical stale-listing flexibility.
- 3 sale attempts with the ask held roughly flat each time — persistent listings suggest the price (not the market) is what's stuck; bring a comps-based counter.
Questions for the listing agent
- What do current leases actually rent for vs. the listed asking? Can we see a recent rent roll and the last 12 months of T-12 income?
- It's been on market 33 days. Have you received any prior offers? Is the seller open to a 31% concession, seller financing, or rate buy-down credit?
- Is there a deadline driving the sale (1031 exchange, divorce, estate, relocation)? That informs how much negotiation room exists.
- Schools are B-rated — typically a magnet for longer-tenancy family renters. What's the average tenant stay here, and is there a school-zone premium baked into asking?
- The area grade is low — what's the realistic commute time and amenity access for the typical tenant pool here? Any planned neighborhood developments (good or bad) we should know about?
- What's the average days-on-market for RENTAL listings here right now (not sales)? A rising rental-DOM trend means longer vacancies and softer asking-rent achievability than the comps imply.
- What's the recent tenant-quality profile in this submarket — average credit score on applications, eviction rate, late-payment / NSF rate, and stable-employment percentage? A property-management company in the area should have these aggregated.
- How much new for-sale + rental construction is in the pipeline within 1–3 miles? Heavy new supply typically softens prices + rents 12–24 months out; constrained supply supports both.
Investment metrics
- 1% rule
- 0.69% ✗
- Cap rate
- 4.57%
- Cash-on-cash
- -6.15%
- DSCR
- 0.73
- GRM
- 12.0
CMA / ARV
No comps found within radius.
Projected returns pro-forma
10.0% appreciation · 3.0% rent growth · sell at horizon
- IRR
- 19.9%
- Equity multiple
- 2.62×
- Total profit
- $116,040
- Equity at exit
- $230,625
- IRR
- 18.2%
- Equity multiple
- 6.02×
- Total profit
- $360,183
- Equity at exit
- $497,352
Cash invested: $71,680 (down + closing). Projections, not guarantees.
Landlord ↔ Tenant lean methodology
- Overall (STATE)
- 87 Strongly Landlord-Friendly
- State Texas
- 87 Strongly Landlord-Friendly · R+5
- County
- — inherits STATE
- City
- — inherits STATE
ZIP-level market 79382
- Active inventory
- 474
- Price-to-rent
- 12.0×
Monthly cashflow live
- Estimated rent
- $1,774 high interval (Pro) →
- Mortgage (P&I)
- −$1,342
- Tax est. 1.5%
- −$320 /mo · $3,840/yr
- Insurance
- −$107
- HOA
- −$0
- Vacancy / Maint / Mgmt
- −$373
- Net cashflow
- $-368
Break-even live
Sensitivity live
| Price | -10% $-191 | -5% $-279 | +0% $-368 | +5% $-456 | +10% $-544 |
|---|---|---|---|---|---|
| Rent | -10% $-508 | -5% $-438 | +0% $-368 | +5% $-297 | +10% $-227 |
| Rate | -1.0pp $-239 | -0.5pp $-302 | base $-368 | +0.5pp $-434 | +1.0pp $-501 |
UW: 25.0% down · 7.5% · 30yr · 1.5% tax · 5.0% vac · 8.0% maint · 8.0% mgmt
Financing live
Cash to close
- Down payment
- $64,000
- Closing costs
- $7,680
- Reserves months
- —
- Total cash needed
- —
Loan-product check · same deal, 3 products live
Conventional
25% down · 7.5% · 30yr
- Down + closing
- —
- Monthly P&I
- —
- Monthly cashflow
- —
- DSCR
- —
- Eligible?
- —
Personal DTI + credit; lowest rate.
DSCR
20% down · 8.5% · 30yr
- Down + closing
- —
- Monthly P&I
- —
- Monthly cashflow
- —
- DSCR
- —
- Eligible?
- —
No personal income docs; deal must DSCR.
Hard money
10% down · 12.0% · 12mo
- Down + closing
- —
- Monthly P&I
- —
- Monthly cashflow
- —
- DSCR
- —
- Eligible?
- —
Short-term bridge; refi at stabilization.
Rent comps 22 comps
| Address | Beds | Baths | Sqft | Rent | $/sqft | DOM | Units | Dist |
|---|---|---|---|---|---|---|---|---|
| 407 E 21st St Wolfforth, TX | 3.0 | 2.0 | 1360 | $1,399 | $1.03 | 23d | 1 | 0.23mi |
| 2011 Bryan Ave Wolfforth, TX | 3.0 | 2.0 | 1350 | $1,450 | $1.07 | 45d | 1 | 0.25mi |
| 2418 Aberdeen Ave Wolfforth, TX | 3.0 | 2.0 | 1450 | $1,799 | $1.24 | 45d | 1 | 0.25mi |
| 2408 Aberdeen Ave Wolfforth, TX | 4.0 | 2.0 | 1703 | $2,100 | $1.23 | 23d | 1 | 0.25mi |
| 2008 Bryan Ave Unit Harvest-2008 A Bryan Wolfforth, TX | 3.0 | 2.0 | 1223 | $1,400 | $1.14 | 45d | 1 | 0.27mi |
| 2006 Corpus Ave Unit A Wolfforth, TX | 3.0 | 2.0 | 1223 | $1,425 | $1.17 | 15d | 1 | 0.29mi |
| 2916 Corpus Ave Wolfforth, TX | 3.0 | 2.0 | 1657 | $1,800 | $1.09 | 45d | 1 | 0.30mi |
| 2001 Bryan Ave Unit B Wolfforth, TX | 3.0 | 2.0 | 1360 | $1,400 | $1.03 | 45d | 1 | 0.31mi |
| 2001 Corpus Ave Unit 2001 B Corpus Wolfforth, TX | 3.0 | 2.0 | 1350 | $1,500 | $1.11 | 23d | 1 | 0.31mi |
| 2001 Corpus Ave Unit B Wolfforth, TX | 3.0 | 2.0 | 1316 | $1,500 | $1.14 | 15d | 1 | 0.31mi |
| 1817 Corpus Ave Wolfforth, TX | 3.0 | 2.0 | 1405 | $1,600 | $1.14 | 15d | 1 | 0.35mi |
| 2304 Corpus Ave Wolfforth, TX | 3.0 | 2.0 | 1316 | $1,425 | $1.08 | 45d | 1 | 0.35mi |
| 2008 Cottonwood Ave Wolfforth, TX | 3.0 | 2.0 | 1450 | $1,810 | $1.25 | 45d | 1 | 0.37mi |
| 304 E 19th St Wolfforth, TX | 3.0 | 2.0 | 1114 | $1,150 | $1.03 | 15d | 1 | 0.42mi |
| 723 E 17th St Wolfforth, TX | 3.0 | 2.0 | 1670 | $1,800 | $1.08 | 45d | 1 | 0.54mi |
| 1503 Good Prairie Ave Wolfforth, TX | 4.0 | 2.5 | 2173 | $2,450 | $1.13 | 23d | 1 | 0.70mi |
| 1313 Corpus Ave Unit B Wolfforth, TX | 3.0 | 2.0 | 1550 | $1,850 | $1.19 | 15d | 1 | 0.70mi |
| 215 14th St Wolfforth, TX | 4.0 | 3.0 | 1850 | $2,200 | $1.19 | 15d | 1 | 0.72mi |
| 611 E 14th St Wolfforth, TX | 3.0 | 2.0 | 1299 | $1,725 | $1.33 | 45d | 1 | 0.85mi |
| 811 11th St Wolfforth, TX | 3.0 | 2.0 | 1523 | $1,595 | $1.05 | 45d | 1 | 1.13mi |
| 906 11th St Wolfforth, TX | 3.0 | 2.0 | 1731 | $2,000 | $1.16 | 45d | 1 | 1.22mi |
| 127 Brooke Blvd Wolfforth, TX | 3.0 | 2.5 | 1714 | $1,757 | $1.03 | 15d | 2 | 1.41mi |
Listing history 27 events
-
2026-06-09status $256,000 Pending 33 DOM
-
2026-06-08days on market $256,000 Active 33 DOM
-
2026-06-07days on market $256,000 Active 32 DOM
-
2026-06-05days on market $256,000 Active 29 DOM
-
2026-06-03days on market $256,000 Active 28 DOM
-
2026-06-02days on market $256,000 Active 27 DOM
-
2026-06-01days on market $256,000 Active 26 DOM
-
2026-05-31days on market $256,000 Active 25 DOM
-
2026-05-30days on market $256,000 Active 24 DOM
-
2026-05-14status Active 412-char remark
-
2026-05-14status Active 535-char remark
-
2026-05-14historical 412-char remark
-
2026-05-13status Pending 535-char remark
-
2026-05-06status Active 535-char remark
-
2026-05-06status Active 412-char remark
-
2026-05-02status Pending 535-char remark
-
2026-05-01$256,000 Active 535-char remark
-
2026-04-29historical 412-char remark
-
2026-04-28price $256,000 412-char remark
-
2026-04-16status Active 412-char remark
-
2026-04-16historical 412-char remark
-
2026-04-13price $265,980 412-char remark
-
2026-04-11price $260,980 412-char remark
-
2026-03-06price $255,980 412-char remark
-
2026-02-12price $255,580 412-char remark
-
2026-02-03price $249,580 412-char remark
-
2025-12-08$249,520 Active 412-char remark
ⓘ Source: listings_history table (triggers on properties + properties_extension) + one-shot
backfill from property_details.listing_events for pre-trigger history.
Nearby sold comps map
Loading sold comps map…
Walkable amenities ~0.75 mi
Loading nearby amenities…
Taxation est. · year 1
- Rental income
- $21,290
- − Mortgage interest
- −$14,340
- − Property taxes
- −$3,840
- − Insurance
- −$1,280
- − Repairs & maintenance
- −$1,703
- − Management
- −$1,703
- − Depreciation
- −$7,447
- Taxable loss
- −$9,024
- Est. tax savings @ 24.0%
- +$2,166
- After-tax cash flow
- $-2,245/yr
For passive investors: Depreciation is non-cash, so a rental often shows a tax loss while cash-flowing — sheltering income. Rental losses are passive: they offset passive income freely, and up to $25,000/yr can offset ordinary (W-2) income if you actively participate and your MAGI is under $100k (phasing out to $0 by $150k); unused losses carry forward. On sale, claimed depreciation is recaptured at up to 25%, and gains may owe capital-gains tax (a 1031 exchange can defer both). Figures are a year-1 estimate at your 24.0% rate — not tax advice; consult a CPA.
Schools (NCES district)
- District
- Frenship ISD
- NCES district ID
- 4819830
- Math proficiency
- 47% ▼ -8.00%
- Reading proficiency
- 54% ▬ 0.00%
- Median HH income
- $54,376
- Composite
- 43.59/100
- National rank
- #2976
- State rank
- #162 of 826 in TX
Livability — Wolfforth
- Score
- 80/100
- State rank
- #43
- US rank
- #1872
Category grades
Schools grade is shown separately in the Schools card above.
Census & demographics
- Census place
- Wolfforth, TX
- County
- Lubbock County · 293,542 people
- City population
- 10,512
- Metro
- Lubbock, TX
- Population (ZIP)
- 10,512
- Household income
- $84,457
- Rent vs Own
- Severe rent burden
- 135.0
Population outlook (Lubbock County) Hauer SSP2
- Today (2025)
- 345,960 people
- By 2030
- 371,449 · +7.4%
- By 2040
- 424,539 · +22.7%
- By 2050
- 481,150 · +39.1%
- By 2075
- 633,467 · +83.1%
- By 2100
- 746,853 · +115.9%
Race, ethnicity, and origin ACS 2023
- Neighborhood character
- Majority White (64%)
- Race & ethnicity
- White 64% Hispanic / Latino 31% Two or more races 18% Black 1%
- Hispanic origin (detail)
- Mexican 28%
- Common ancestry
- Italian 4% Slovak 2% Lithuanian 2%
- Foreign-born
- 4% · Canada
- Languages at home
- 85% English-only · Spanish 14%
Political lean MEDSL · Lubbock
- 2024 margin
- Solid R (+39.5) · D 29.7% · R 69.2% · Other 1.0%
- 2008→2024 swing
- -2.8pp toward R · 2008: -36.7pp · 2024: -39.5pp
- All cycles
- 2024: R+39.5 2020: R+32.2 2016: R+38.4 2012: R+40.9 2008: R+36.7
Not yet ingested
- Civics
- —
Market trends
- HPI YoY
- ▲ 166.08%
- Current HPI
- 561.4491
- Rent YoY
- —
- Metro
- Lubbock, TX
- State GDP YoY
- ▲ 3.95%
- F500 in state
- 110
Industry mix (Fortune 500 HQ in TX)
| Industry | F500 HQs | Revenue |
|---|---|---|
| Energy | 16 | $1,198B |
|
||
| Technology | 5 | $198B |
|
||
| Engineering / Construction | 4 | $72B |
|
||
| Energy Services | 3 | $60B |
|
||
| Utilities | 3 | $41B |
|
||
| Healthcare | 2 | $330B |
|
||
Price history
6 events — show timeline
- 2026-06-08 Pending — LARMLS
- 2026-05-14 Relisted — LARMLS
- 2026-05-13 Pending — LARMLS
- 2026-05-06 Relisted — LARMLS
- 2026-05-02 Pending — LARMLS
- 2026-05-01 Listed $256,000 LARMLS
Cash-flow waterfall
monthlySold comps — $/sqft
last 12 mo · ≤1 miLoading sold comps…