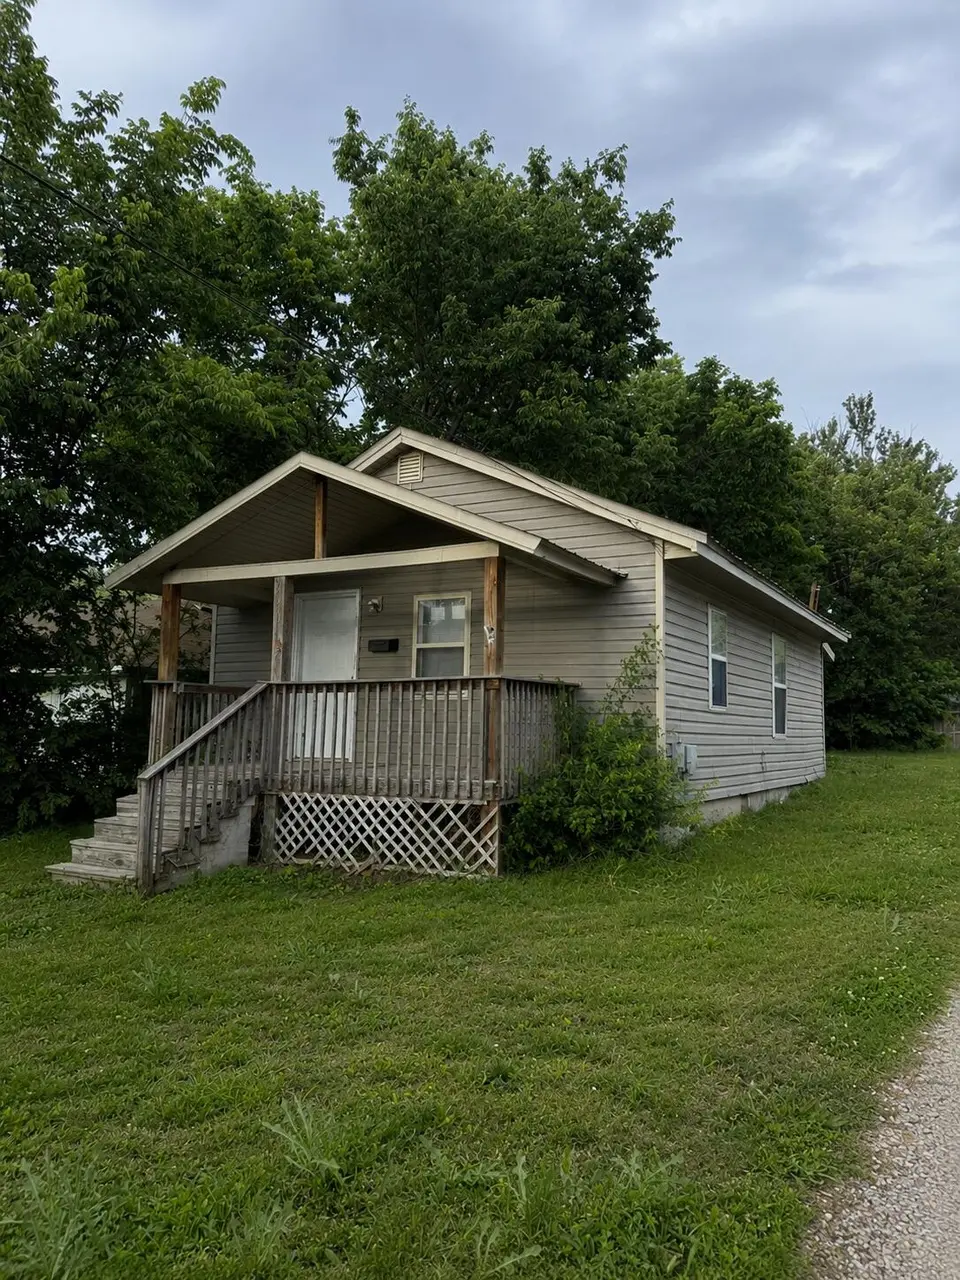
2314 N Missouri Ave · Springfield, MO
Flood risk 1/10 · Minimal
- FEMA flood zone
- X (unshaded)
- Chance of flooding over 30 yrs
- 0.0%
- Est. flood insurance / yr
- $507 – $1,088
Fire risk 2/10 · Minimal
- Est. fire insurance / yr
- $1,054 – $1,958
Heat risk 5/10 · Moderate
- Hot days now (above 105°F)
- 7 days/yr
- Hot days in 30 yrs
- 19 days/yr
Wind risk 2/10 · Minimal
- Chance of severe wind over 30 yrs
- —
Air-quality risk 2/10 · Minimal
- Unhealthy air days now
- 1 days/yr
- Unhealthy air days in 30 yrs
- 2 days/yr
Risk factors via First Street. Map © Google.
Why this score? — see what drove the D+ grade
The composite is a weighted blend of 9 inputs, each scored 0–100. Each bar is that input's sub-score; the figure is the points it added to the 100-point composite (weight × sub-score).
- Cash flow +15.9/30.0
- ARV discount +12.8/15.0
- DSCR +4.9/10.0
- Livability +3.8/5.0
- Rent growth +3.6/5.0
- 1% rule +3.2/10.0
- Schools +3.2/10.0
- Condition / age +2.5/5.0
- Appreciation +0.0/10.0
$105,000
🖨 Deal sheet 📄 Offer letter ✓ Due diligence
Listing remarks
Charming home in featuring a welcoming front porch and plenty of character. Conveniently located with quick access to downtown, local colleges, shopping, and restaurants. Great opportunity for an investor or future owner-occupant. Property is being sold as-is.
Key facts
- Local colleges
- Front porch
- Shopping
Tags
Property features AI
Finance
- Other: Lot about 0.11 acre
Exterior
- Utilities: Public water; Public sewer
- Home design: Single-family residence; One story
- Construction: Vinyl siding; Metal roof; Built as a residence
- Exterior features: Front porch
Interior
- Kitchen: Electric cooktop; Microwave
- Flooring: Laminate flooring; Linoleum flooring
- Bathrooms: 1 full bathroom
- Heating & cooling: Electric baseboard heating
- Interior features: Electric cooktop; Microwave
- Laundry & utility: Main-level laundry
Neighborhood map
What this means for you Summary
Snapshot
- This is a 1-bed/1.0-bath single-family listed at $105k.
Deal economics
- At list price, monthly cash flow is $49 ($592/yr) — positive.
- The deal already cash-flows at list — no discount required.
- To meet the 1% rule (rent ≥ 1% of price), the offer needs to be $86k (17.7% below list).
- Recommended offer: $86k (17.7% below list) — sets the bar for 1% rule.
- Cap rate 6.9% vs local median 4.6% in Springfield — top-decile yield for the area; either an underpriced asset or a hidden risk that comps aren't pricing in. Stress-test before assuming the spread holds.
Location & tenants
- Location reads 75/100 on livability (#57 in MO, #4,121 nationally) — a middle-class / working-renter tenant base. Strengths: commute A+, cost of living A+, housing A+; Watch: crime F, employment F.
- Springfield R-XII (urban): math 32% / reading 46% proficiency, ranked #174 of 324 in MO (top 54%) — families likely to look elsewhere, expect single-tenant / working-renter base with shorter leases.
- Zoned schools: Bowerman Elem. (math 17% / reading 27%, grade F, #910 of 1,115 statewide, top 83%, 243 students, 90% FRL); Hillcrest High (math 9% / reading 35%, grade F, #462 of 521 statewide, top 90%, 1,017 students, 64% FRL) — zoned schools average 77% FRL vs 46% district-wide (30 pts higher); higher-poverty schools than district average — tighter screening recommended.
- Zoned-school proficiency averages 22% at this address vs 39% district-wide (-17 pts) — the specific schools serving this property underperform the Springfield R-XII average; the district grade overstates school quality for this exact location.
- Market conditions: Rents rising fast (+4.2%/yr); 394 active listings in the ZIP; 7 comparable units currently listed for rent nearby; rentals lingering (median 44d on market — plan ~5-8 weeks vacancy on turnover, expect pricing pressure); 71% of comp listings sitting > 30 days — soft ceiling on asking rent; 1,302 units permitted in Greene County in 2024 (250 in 5+ unit buildings).
Forward outlook
- Local home prices are declining (-3.0%/yr); year-one equity from $726 of loan paydown is wiped out by about $3k of value loss. Plan a longer hold.
- Greene County population projected at +25% by 2050 — long-run rental-demand tailwind backs the buy-and-hold thesis.
Negotiation context
- It's been on market 35 days — a 3% lower offer ($102k) is reasonable based on typical stale-listing flexibility.
- 4 sale attempts since 9y ago with the ask held roughly flat each time — persistent listings suggest the price (not the market) is what's stuck; bring a comps-based counter.
Risks & watch-outs
- Watch-outs: built in 1918 — expect roof / HVAC / electrical / plumbing capex.
- Climate carrying-cost: extreme-heat days projected 7→19/yr by 2055 (HVAC capex compounding) — expect insurance premiums to compound above CPI over the hold.
Questions for the listing agent
- It's been on market 35 days. Have you received any prior offers? Is the seller open to a 18% concession, seller financing, or rate buy-down credit?
- Built in 1918 — when were the roof, HVAC, electrical panel, plumbing, and water heater last replaced?
- Is there a deadline driving the sale (1031 exchange, divorce, estate, relocation)? That informs how much negotiation room exists.
- Crime grade is F in this area — have there been break-ins, vandalism, or insurance claims at this property in the last 3 years? What carrier currently insures it and at what premium?
- The area grade is low — what's the realistic commute time and amenity access for the typical tenant pool here? Any planned neighborhood developments (good or bad) we should know about?
- What's the average days-on-market for RENTAL listings here right now (not sales)? A rising rental-DOM trend means longer vacancies and softer asking-rent achievability than the comps imply.
- What's the recent tenant-quality profile in this submarket — average credit score on applications, eviction rate, late-payment / NSF rate, and stable-employment percentage? A property-management company in the area should have these aggregated.
- How much new for-sale + rental construction is in the pipeline within 1–3 miles? Heavy new supply typically softens prices + rents 12–24 months out; constrained supply supports both.
Investment metrics
- 1% rule
- 0.82% ✗
- Cap rate
- 6.86%
- Cash-on-cash
- 2.01%
- DSCR
- 1.09
- GRM
- 10.1
CMA / ARV
- ARV (median comp)
- $118,964
- List price
- $105,000
- Delta
- -11.74%
- Verdict
- UNDERPRICED
- Comps
- 20 within 1.0 mi
Show comp detail 12 sales within ~0.75 mi
| Address | Dist | Beds/Ba | Sqft | Sold | Price | $/sf | Match |
|---|---|---|---|---|---|---|---|
| 930 W Chicago St | 0.08mi | 2/1.0 (+1) | 672 (-9%) | 5mo | $112,900 | $168 | 73 |
| 800 W Della St | 0.15mi | 2/1.0 (+1) | 808 (+10%) | 2mo | $114,900 | $142 | 70 |
| 920 W Talmage St | 0.33mi | 2/1.0 (+1) | 784 (+6%) | 2mo | $135,000 | $172 | 67 |
| 2101 N Main Ave | 0.35mi | 2/1.0 (+1) | 780 (+6%) | 10mo | $135,000 | $173 | 60 |
| 2543 N Campbell Ave | 0.49mi | 1/1.0 | 680 (-8%) | 8mo | $50,000 | $74 | 58 |
| 2550 N Broadway Ave | 0.32mi | 1/1.0 | 648 (-12%) | 11mo | $80,000 | $123 | 56 |
| 916 W Woodlawn St | 0.27mi | 2/1.0 (+1) | 656 (-11%) | 12mo | $69,900 | $107 | 55 |
| 1862 N Missouri Ave | 0.56mi | 2/1.0 (+1) | 780 (+6%) | 6mo | $144,500 | $185 | 54 |
| 2333 N Farmer Ave | 0.67mi | 2/1.0 (+1) | 768 (+4%) | 8mo | $69,900 | $91 | 50 |
| 1322 W Atlantic St | 0.59mi | 2/1.0 (+1) | 784 (+6%) | 10mo | $110,500 | $141 | 48 |
| 2219 N Nettleton Ave | 0.56mi | 2/1.0 (+1) | 816 (+11%) | 8mo | $110,000 | $135 | 45 |
| 1121 W Florida St | 0.60mi | 2/2.0 (+1) | 844 (+15%) | 1mo | $57,000 | $68 | 38 |
Match score weights: distance 35% · size 25% · config 20% · recency 20%. Top-matched comps best support the ARV.
Projected returns pro-forma
-3.0% appreciation · 4.24% rent growth · sell at horizon
- IRR
- -11.9%
- Equity multiple
- 0.56×
- Total profit
- $-12,826
- Equity at exit
- $15,656
- IRR
- -1.3%
- Equity multiple
- 0.91×
- Total profit
- $-2,706
- Equity at exit
- $9,078
Cash invested: $29,400 (down + closing). Projections, not guarantees.
Landlord ↔ Tenant lean methodology
- Overall (STATE)
- 81 Strongly Landlord-Friendly
- State Missouri
- 81 Strongly Landlord-Friendly · R+10
- County
- — inherits STATE
- City
- — inherits STATE
ZIP-level market 65803
- Home prices YoY
- -29.8%
- Rents YoY
- 4.2%
- Active inventory
- 394
- Price-to-rent
- 10.1×
Monthly cashflow live
- Estimated rent
- $865 high interval (Pro) →
- Mortgage (P&I)
- −$551
- Tax from tax record
- −$39 /mo · $472/yr
- Insurance
- −$44
- HOA
- −$0
- Vacancy / Maint / Mgmt
- −$182
- Net cashflow
- $49
Break-even live
UW: 25.0% down · 7.5% · 30yr · 1.5% tax · 5.0% vac · 8.0% maint · 8.0% mgmt
Financing live
Cash to close
- Down payment
- $26,250
- Closing costs
- $3,150
- Reserves months
- —
- Total cash needed
- —
Loan-product check · same deal, 3 products live
Conventional
25% down · 7.5% · 30yr
- Down + closing
- —
- Monthly P&I
- —
- Monthly cashflow
- —
- DSCR
- —
- Eligible?
- —
Personal DTI + credit; lowest rate.
DSCR
20% down · 8.5% · 30yr
- Down + closing
- —
- Monthly P&I
- —
- Monthly cashflow
- —
- DSCR
- —
- Eligible?
- —
No personal income docs; deal must DSCR.
Hard money
10% down · 12.0% · 12mo
- Down + closing
- —
- Monthly P&I
- —
- Monthly cashflow
- —
- DSCR
- —
- Eligible?
- —
Short-term bridge; refi at stabilization.
Rent comps 7 comps
| Address | Beds | Baths | Sqft | Rent | $/sqft | DOM | Units | Dist |
|---|---|---|---|---|---|---|---|---|
| 407 E Dale St Apt B Springfield, MO | 2.0 | 1.0 | 720 | $795 | $1.10 | 13d | 1 | 0.68mi |
| 302 W Commercial St Unit 206F Springfield, MO | — | 1.0 | 615 | $850 | $1.38 | 44d | 1 | 0.77mi |
| 2850 N Campbell Ave Apt S Springfield, MO | 1.0 | 1.0 | 727 | $750 | $1.03 | 44d | 1 | 0.83mi |
| 1623 N Jefferson Ave Unit B Springfield, MO | 1.0 | 1.0 | 750 | $950 | $1.27 | 44d | 1 | 0.95mi |
| 2346 N Kellett Ave Apt B Springfield, MO | 1.0 | 1.0 | 550 | $825 | $1.50 | 44d | 1 | 1.07mi |
| 1126 W Hamilton St Springfield, MO | 2.0 | 1.0 | 648 | $895 | $1.38 | 23d | 1 | 1.16mi |
| 2115 N Grace Ave Springfield, MO | 2.0 | 1.0 | 650 | $850 | $1.31 | 44d | 1 | 1.30mi |
Listing history 22 events
-
2026-06-18days on market $105,000 Active 35 DOM
-
2026-06-17days on market $105,000 Active 34 DOM
-
2026-06-16days on market $105,000 Active 33 DOM
-
2026-06-15days on market $105,000 Active 32 DOM
-
2026-06-14days on market $105,000 Active 30 DOM
-
2026-06-10days on market $105,000 Active 27 DOM
-
2026-06-09days on market $105,000 Active 26 DOM
-
2026-06-08days on market $105,000 Active 25 DOM
-
2026-06-07days on market $105,000 Active 24 DOM
-
2026-06-03days on market $105,000 Active 20 DOM
-
2026-06-02days on market $105,000 Active 19 DOM
-
2026-06-01days on market $105,000 Active 18 DOM
-
2026-05-31days on market $105,000 Active 17 DOM
-
2026-05-30days on market $105,000 Active 16 DOM
-
2026-05-14$105,000 Active 260-char remark
-
2024-11-08historical $800
-
2024-09-07$800
-
2024-08-21historical $800
-
2024-08-03$800
-
2018-02-16soldstatus
-
2017-04-11$42,900
-
2013-09-06soldstatus
ⓘ Source: listings_history table (triggers on properties + properties_extension) + one-shot
backfill from property_details.listing_events for pre-trigger history.
Tax reassessment forecast MO · Resets to sale price
- Current annual tax
- $472 · $39/mo
- Projected year-2 tax
- $1,018 · $85/mo
- Expected delta
- +$546/yr (+$46/mo · 115.7%)
ⓘ Screening estimate from a state-policy table — verify with the county assessor before closing.
Climate risk First Street
- Flood 1/10 Low FEMA zone X (unshaded) · 0% chance over 30 yrs
- Wildfire 2/10 Low
- Heat 5/10 Major 7 d/yr ≥105°F today · 19 d/yr by 30 yrs out
- Wind 2/10 Low
- Air quality 2/10 Low 1 unhealthy d/yr today · 2 by 30 yrs out
Nearby sold comps map
Loading sold comps map…
Walkable amenities ~0.75 mi
Loading nearby amenities…
Taxation est. · year 1
- Rental income
- $10,375
- − Mortgage interest
- −$5,882
- − Property taxes
- −$472
- − Insurance
- −$525
- − Repairs & maintenance
- −$830
- − Management
- −$830
- − Depreciation
- −$3,055
- Taxable loss
- −$1,218
- Est. tax savings @ 24.0%
- +$292
- After-tax cash flow
- $884/yr
For passive investors: Depreciation is non-cash, so a rental often shows a tax loss while cash-flowing — sheltering income. Rental losses are passive: they offset passive income freely, and up to $25,000/yr can offset ordinary (W-2) income if you actively participate and your MAGI is under $100k (phasing out to $0 by $150k); unused losses carry forward. On sale, claimed depreciation is recaptured at up to 25%, and gains may owe capital-gains tax (a 1031 exchange can defer both). Figures are a year-1 estimate at your 24.0% rate — not tax advice; consult a CPA.
Schools (NCES district)
- District
- Springfield R-XII
- NCES district ID
- 2928860
- Math proficiency
- 32% ▼ -2.00%
- Reading proficiency
- 46% ▼ -3.00%
- Median HH income
- $37,886
- Composite
- 32.45/100
- National rank
- #5717
- State rank
- #174 of 324 in MO
Livability — Springfield
- Score
- 75/100
- State rank
- #57
- US rank
- #4121
Category grades
Schools grade is shown separately in the Schools card above.
Census & demographics
- Census place
- Springfield, MO
- County
- Greene County · 244,327 people
- City population
- 223,044
- Metro
- Springfield, MO
- Population (ZIP)
- 42,882
- Household income
- $50,572
- Rent vs Own
- Severe rent burden
- 1305.0
Population outlook (Greene County) Hauer SSP2
- Today (2025)
- 319,054 people
- By 2030
- 335,135 · +5.0%
- By 2040
- 366,186 · +14.8%
- By 2050
- 397,431 · +24.6%
- By 2075
- 477,035 · +49.5%
- By 2100
- 520,828 · +63.2%
Race, ethnicity, and origin ACS 2023
- Neighborhood character
- Predominantly White (82%)
- Race & ethnicity
- White 82% Two or more races 9% Hispanic / Latino 6% Black 4%
- Hispanic origin (detail)
- Mexican 2% Puerto Rican 2%
- Common ancestry
- Lithuanian 2% Italian 2% Iranian 2%
- Foreign-born
- 3% · Canada
- Languages at home
- 95% English-only · Spanish 3%
Political lean MEDSL · Greene
- 2024 margin
- Strong R (+20.8) · D 38.9% · R 59.7% · Other 1.4%
- 2008→2024 swing
- -5.0pp toward R · 2008: -15.8pp · 2024: -20.8pp
- All cycles
- 2024: R+20.8 2020: R+20.1 2016: R+27.4 2012: R+24.4 2008: R+15.8
Not yet ingested
- Civics
- —
Market trends
- HPI YoY
- ▼ -87.08%
- Current HPI
- 205.0439
- Rent YoY
- ▲ 4.24%
- Metro
- Springfield, MO
- State GDP YoY
- ▲ 1.84%
- F500 in state
- 20
Industry mix (Fortune 500 HQ in MO)
| Industry | F500 HQs | Revenue |
|---|---|---|
| Healthcare | 1 | $163B |
|
||
| Insurance | 1 | $21B |
|
||
| Industrial Technology | 1 | $17B |
|
||
| Retail | 1 | $16B |
|
||
| Industrial Distribution | 1 | $10B |
|
||
| Utilities | 1 | $9B |
|
||
Price history
+144.8% since first listed8 events — show timeline
- 2026-05-14 Listed $105,000 SOMO
- 2024-11-08 Rental Removed $800 APPFOLIO
- 2024-09-07 Listed for Rent $800 APPFOLIO
- 2024-08-21 Rental Removed $800 APPFOLIO
- 2024-08-03 Listed for Rent $800 APPFOLIO
- 2018-02-16 Sold (Public Records) — Public Records
- 2017-04-11 Listed $42,900 SOMO
- 2013-09-06 Sold (Public Records) — Public Records
Property tax history
+5.5%/yrLatest (2025): $472 · +65.2% YoY. Source: county tax records.
Cash-flow waterfall
monthlySold comps — $/sqft
last 12 mo · ≤1 miLoading sold comps…