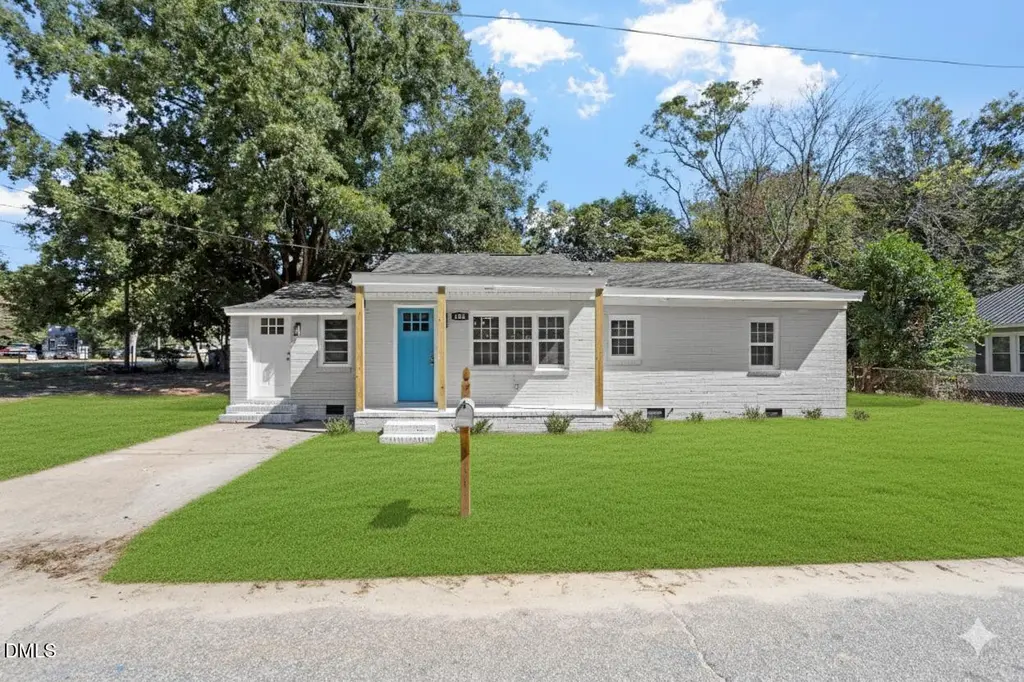
604 E Townsend St · Dunn, NC
Flood risk 1/10 · Minimal
- FEMA flood zone
- X (unshaded)
- Chance of flooding over 30 yrs
- 0.0%
- Est. flood insurance / yr
- $507 – $1,088
Fire risk 1/10 · Minimal
- Est. fire insurance / yr
- $906 – $1,684
Heat risk 7/10 · Major
- Hot days now (above 106°F)
- 7 days/yr
- Hot days in 30 yrs
- 17 days/yr
Wind risk 8/10 · Major
- Chance of severe wind over 30 yrs
- 80.0%
Air-quality risk 2/10 · Minimal
- Unhealthy air days now
- 1 days/yr
- Unhealthy air days in 30 yrs
- 1 days/yr
Risk factors via First Street. Map © Google.
Why this score? — see what drove the D+ grade
The composite is a weighted blend of 9 inputs, each scored 0–100. Each bar is that input's sub-score; the figure is the points it added to the 100-point composite (weight × sub-score).
- Cash flow +15.1/30.0
- ARV discount +15.0/15.0
- DSCR +4.6/10.0
- Livability +3.2/5.0
- 1% rule +3.1/10.0
- Schools +3.0/10.0
- Rent growth +2.5/5.0
- Condition / age +2.5/5.0
- Appreciation +0.0/10.0
$189,900
🖨 Deal sheet 📄 Offer letter ✓ Due diligence
Listing remarks
This beautifully updated brick ranch home offers stylish upgrades throughout. The main living areas feature new engineered wood floors, while the bedroom includes plush new carpet for comfort. The kitchen has been refreshed with new cabinets, quartz countertops, a tile backsplash, and stainless steel appliances. The bathroom completes the updates with new tile floors and a custom quartz vanity, making this home move-in ready with timeless appeal.
Key facts
- Quartz countertops
- Plush new carpet
- New cabinets
Tags
Property features AI
Finance
- Other: Lot size approximately 0.14 acre
- HOA & community: No homeowners association
Exterior
- Parking: Driveway
- Utilities: Public water; Public sewer
- Home design: Single-story house
- Construction: Brick construction
- Exterior features: Shingle roof; Updated/remodeled condition
Interior
- Kitchen: Dishwasher; Electric range
- Bedrooms: 3 bedrooms (all on the main level)
- Flooring: Luxury vinyl
- Bathrooms: 1 full bathroom
- Heating & cooling: Central heating (forced air); Central air conditioning
- Interior features: Primary bedroom on the main level; Bathtub/shower combination; Quartz countertops; Smooth ceilings
- Laundry & utility: Washer hookup; Electric dryer hookup
Neighborhood map
What this means for you Summary
Snapshot
- This is a 3-bed/1.0-bath single-family listed at $190k.
Deal economics
- At list price, monthly cash flow is $64 ($767/yr) — positive.
- The deal already cash-flows at list — no discount required.
- To meet the 1% rule (rent ≥ 1% of price), the offer needs to be $153k (19.3% below list).
- Recommended offer: $153k (19.3% below list) — sets the bar for 1% rule.
- Cap rate 6.7% vs local median 4.1% in Dunn — top-decile yield for the area; either an underpriced asset or a hidden risk that comps aren't pricing in. Stress-test before assuming the spread holds.
Location & tenants
- Location reads 63/100 on livability (#390 in NC) — a middle-class / working-renter tenant base. Strengths: cost of living A+, health & safety A+, housing A; Watch: crime F, commute F, employment F.
- Harnett County Schools (rural): math 31% / reading 39% proficiency, ranked #130 of 178 in NC (top 73%) — families likely to look elsewhere, expect single-tenant / working-renter base with shorter leases.
- Zoned schools: Triton High (math 41% / reading 49%, grade D-, #350 of 535 statewide, top 66%, 1,287 students, 63% FRL).
- Market conditions: 339 active listings in the ZIP; 3 comparable units currently listed for rent nearby; rentals at typical pace (median 14d on market — plan ~3-4 weeks tenant-placement turnaround); 2,080 units permitted in Harnett County in 2024 (12 in 5+ unit buildings).
- This rent runs 35% of the median local income ($53k/yr) — at the standard rent-burdened threshold; future hikes will face affordability resistance.
Forward outlook
- Local home prices are declining (-3.0%/yr); year-one equity from $1k of loan paydown is wiped out by about $6k of value loss. Plan a longer hold.
- Harnett County population projected at +42% by 2050 — long-run rental-demand tailwind backs the buy-and-hold thesis.
Negotiation context
- It's been on market 41 days — a 3% lower offer ($184k) is reasonable based on typical stale-listing flexibility.
- 7 sale attempts since 23y ago with the ask held roughly flat each time — persistent listings suggest the price (not the market) is what's stuck; bring a comps-based counter.
- Current owner paid $68k; list at $190k implies a 181% gain — meaningful room to come down on a strong offer.
Risks & watch-outs
- Watch-outs: built in 1950 — expect roof / HVAC / electrical / plumbing capex.
- Climate carrying-cost: severe wind risk, 80% chance of damaging wind over 30y; extreme-heat days projected 7→17/yr by 2055 (HVAC capex compounding) — expect insurance premiums to compound above CPI over the hold.
Questions for the listing agent
- It's been on market 41 days. Have you received any prior offers? Is the seller open to a 19% concession, seller financing, or rate buy-down credit?
- Built in 1950 — when were the roof, HVAC, electrical panel, plumbing, and water heater last replaced?
- Is there a deadline driving the sale (1031 exchange, divorce, estate, relocation)? That informs how much negotiation room exists.
- Schools are D-rated, which usually means shorter tenancies and higher turnover. Who's the typical renter profile here, and what's been the actual vacancy rate?
- Crime grade is F in this area — have there been break-ins, vandalism, or insurance claims at this property in the last 3 years? What carrier currently insures it and at what premium?
- The area grade is low — what's the realistic commute time and amenity access for the typical tenant pool here? Any planned neighborhood developments (good or bad) we should know about?
- What's the average days-on-market for RENTAL listings here right now (not sales)? A rising rental-DOM trend means longer vacancies and softer asking-rent achievability than the comps imply.
- What's the recent tenant-quality profile in this submarket — average credit score on applications, eviction rate, late-payment / NSF rate, and stable-employment percentage? A property-management company in the area should have these aggregated.
- How much new for-sale + rental construction is in the pipeline within 1–3 miles? Heavy new supply typically softens prices + rents 12–24 months out; constrained supply supports both.
Investment metrics
- 1% rule
- 0.81% ✗
- Cap rate
- 6.70%
- Cash-on-cash
- 1.44%
- DSCR
- 1.06
- GRM
- 10.3
CMA / ARV
- ARV (on-the-fly)
- $249,282
- Comps found
- 12
Show comp detail 12 sales within ~0.75 mi
| Address | Dist | Beds/Ba | Sqft | Sold | Price | $/sf | Match |
|---|---|---|---|---|---|---|---|
| 707 N Wilson Ave | 0.24mi | 3/2.0 | 1,120 (-11%) | 7mo | $234,000 | $209 | 60 |
| 501 E Granville St | 0.20mi | 3/2.0 | 1,107 (-12%) | 11mo | $235,000 | $212 | 57 |
| 117 Mars Dr | 0.70mi | 3/1.5 | 1,223 (-3%) | 6mo | $205,000 | $168 | 56 |
| 606 E Pearsall St | 0.64mi | 3/2.0 | 1,300 (+3%) | 12mo | $225,000 | $173 | 51 |
| 311 N Layton Ave | 0.57mi | 3/2.0 | 1,350 (+7%) | 9mo | $202,500 | $150 | 50 |
| 604 E Pope St | 0.72mi | 3/2.0 | 1,215 (-4%) | 13mo | $240,500 | $198 | 46 |
| 904 E Pope St | 0.75mi | 3/2.0 | 1,162 (-8%) | 3mo | $86,000 | $74 | 46 |
| 221 Moon Cir | 0.72mi | 3/2.0 | 1,187 (-6%) | 11mo | $265,000 | $223 | 44 |
| 406 W Granville St | 0.59mi | 3/2.0 | 1,077 (-14%) | 1mo | $223,000 | $207 | 43 |
| 1021 E Edgerton St | 0.59mi | 3/2.0 | 1,124 (-11%) | 9mo | $234,000 | $208 | 43 |
| 727 Queens Ave | 0.74mi | 3/1.5 | 1,161 (-8%) | 12mo | $217,000 | $187 | 40 |
| 111 Spring Branch Rd | 0.74mi | 3/2.0 | 1,403 (+11%) | 11mo | $199,879 | $142 | 33 |
Match score weights: distance 35% · size 25% · config 20% · recency 20%. Top-matched comps best support the ARV.
Projected returns pro-forma
-3.0% appreciation · 3.0% rent growth · sell at horizon
- IRR
- -14.1%
- Equity multiple
- 0.50×
- Total profit
- $-26,780
- Equity at exit
- $28,315
- IRR
- -5.3%
- Equity multiple
- 0.65×
- Total profit
- $-18,396
- Equity at exit
- $16,419
Cash invested: $53,172 (down + closing). Projections, not guarantees.
Landlord ↔ Tenant lean methodology
- Overall (STATE)
- 85 Strongly Landlord-Friendly
- State North Carolina
- 85 Strongly Landlord-Friendly · R+3
- County
- — inherits STATE
- City
- — inherits STATE
ZIP-level market 28334
- Home prices YoY
- -13.2%
- Active inventory
- 339
- Price-to-rent
- 10.3×
Monthly cashflow live
- Estimated rent
- $1,533 medium interval (Pro) →
- Mortgage (P&I)
- −$996
- Tax from tax record
- −$72 /mo · $867/yr
- Insurance
- −$79
- HOA
- −$0
- Vacancy / Maint / Mgmt
- −$322
- Net cashflow
- $64
Break-even live
UW: 25.0% down · 7.5% · 30yr · 1.5% tax · 5.0% vac · 8.0% maint · 8.0% mgmt
Financing live
Cash to close
- Down payment
- $47,475
- Closing costs
- $5,697
- Reserves months
- —
- Total cash needed
- —
Loan-product check · same deal, 3 products live
Conventional
25% down · 7.5% · 30yr
- Down + closing
- —
- Monthly P&I
- —
- Monthly cashflow
- —
- DSCR
- —
- Eligible?
- —
Personal DTI + credit; lowest rate.
DSCR
20% down · 8.5% · 30yr
- Down + closing
- —
- Monthly P&I
- —
- Monthly cashflow
- —
- DSCR
- —
- Eligible?
- —
No personal income docs; deal must DSCR.
Hard money
10% down · 12.0% · 12mo
- Down + closing
- —
- Monthly P&I
- —
- Monthly cashflow
- —
- DSCR
- —
- Eligible?
- —
Short-term bridge; refi at stabilization.
Rent comps 3 comps
| Address | Beds | Baths | Sqft | Rent | $/sqft | DOM | Units | Dist |
|---|---|---|---|---|---|---|---|---|
| 202 S Sampson Ave Dunn, NC | 3.0 | 1.0 | 1418 | $1,600 | $1.13 | 14d | 1 | 0.64mi |
| 807 N Ellis Ave Dunn, NC | 2.0 | 1.0 | 1100 | $1,400 | $1.27 | 14d | 1 | 0.66mi |
| 1001 Webster Dr Dunn, NC | 1.0–3.0 | 1.0–1.5 | 900 | $1,300 | $1.44 | 12d | 1 | 1.13mi |
Listing history 40 events
-
2026-06-18days on market $189,900 Active 41 DOM
-
2026-06-17days on market $189,900 Active 40 DOM
-
2026-06-16days on market $189,900 Active 39 DOM
-
2026-06-15days on market $189,900 Active 38 DOM
-
2026-06-14pricedays on market $189,900 Active 36 DOM
-
2026-06-10days on market $193,800 Active 33 DOM
-
2026-06-09days on market $193,800 Active 32 DOM
-
2026-06-08days on market $193,800 Active 31 DOM
-
2026-06-07pricedays on market $193,800 Active 30 DOM
-
2026-06-05days on market $193,900 Active 27 DOM
-
2026-06-03days on market $193,900 Active 26 DOM
-
2026-06-02days on market $193,900 Active 25 DOM
-
2026-06-01days on market $193,900 Active 24 DOM
-
2026-05-31days on market $193,900 Active 23 DOM
-
2026-05-30pricedays on market $193,900 Active 22 DOM
-
2026-05-08$194,900 Active
-
2026-05-07historical
-
2026-05-02price $198,600
-
2026-04-19price $198,700
-
2026-04-11price $199,700
-
2026-04-03price $199,800
-
2026-03-27$199,900 Active
-
2026-03-26historical
-
2026-03-06price $203,900
-
2026-01-16$204,900 Active
-
2026-01-15historical
-
2025-12-20price $208,900
-
2025-12-11$209,900 Active
-
2025-12-10historical
-
2025-12-06price $213,700
-
2025-11-21price $213,800
-
2025-11-17price $214,800
-
2025-11-15price $214,900
-
2025-10-30price $219,800
-
2025-10-04$219,900 Active
-
2025-03-07soldstatus $67,500
-
2003-05-13soldstatus $25,000
-
2003-05-13soldstatus $25,000
-
2003-01-02$28,500
-
2003-01-02$28,500
ⓘ Source: listings_history table (triggers on properties + properties_extension) + one-shot
backfill from property_details.listing_events for pre-trigger history.
Tax reassessment forecast NC · Resets to sale price
- Current annual tax
- $867 · $72/mo
- Projected year-2 tax
- $1,557 · $130/mo
- Expected delta
- +$690/yr (+$58/mo · 79.6%)
ⓘ Screening estimate from a state-policy table — verify with the county assessor before closing.
Climate risk First Street
- Flood 1/10 Low FEMA zone X (unshaded) · 0% chance over 30 yrs
- Wildfire 1/10 Low
- Heat 7/10 Severe 7 d/yr ≥106°F today · 17 d/yr by 30 yrs out
- Wind 8/10 Severe 80% chance of damaging wind over 30 yrs
- Air quality 2/10 Low 1 unhealthy d/yr today · 1 by 30 yrs out
Nearby sold comps map
Loading sold comps map…
Walkable amenities ~0.75 mi
Loading nearby amenities…
Taxation est. · year 1
- Rental income
- $18,397
- − Mortgage interest
- −$10,637
- − Property taxes
- −$867
- − Insurance
- −$950
- − Repairs & maintenance
- −$1,472
- − Management
- −$1,472
- − Depreciation
- −$5,524
- Taxable loss
- −$2,525
- Est. tax savings @ 24.0%
- +$606
- After-tax cash flow
- $1,373/yr
For passive investors: Depreciation is non-cash, so a rental often shows a tax loss while cash-flowing — sheltering income. Rental losses are passive: they offset passive income freely, and up to $25,000/yr can offset ordinary (W-2) income if you actively participate and your MAGI is under $100k (phasing out to $0 by $150k); unused losses carry forward. On sale, claimed depreciation is recaptured at up to 25%, and gains may owe capital-gains tax (a 1031 exchange can defer both). Figures are a year-1 estimate at your 24.0% rate — not tax advice; consult a CPA.
Schools (NCES district)
- District
- Harnett County Schools
- NCES district ID
- 3702010
- Math proficiency
- 31% ▼ -2.00%
- Reading proficiency
- 39% ▼ -1.00%
- Median HH income
- $45,400
- Composite
- 29.88/100
- National rank
- #6397
- State rank
- #130 of 178 in NC
Livability — Dunn
- Score
- 63/100
- State rank
- #390
- US rank
- #15160
Category grades
Schools grade is shown separately in the Schools card above.
Census & demographics
- Census place
- Dunn, NC
- County
- Harnett County · 125,715 people
- City population
- 22,873
- Metro
- Fayetteville, NC
- Population (ZIP)
- 22,873
- Household income
- $53,036
- Rent vs Own
- Severe rent burden
- 382.0
Population outlook (Harnett County) Hauer SSP2
- Today (2025)
- 153,758 people
- By 2030
- 166,581 · +8.3%
- By 2040
- 192,741 · +25.4%
- By 2050
- 218,332 · +42.0%
- By 2075
- 275,422 · +79.1%
- By 2100
- 313,511 · +103.9%
Race, ethnicity, and origin ACS 2023
- Neighborhood character
- Majority White (64%)
- Race & ethnicity
- White 64% Black 20% Hispanic / Latino 13% Two or more races 4%
- Hispanic origin (detail)
- Mexican 9% Puerto Rican 2%
- Common ancestry
- Serbian 3% Slovak 1% Romanian 1%
- Foreign-born
- 5% · Canada, Guatemala
- Languages at home
- 88% English-only · Spanish 11%
Political lean MEDSL · Harnett
- 2024 margin
- Strong R (+25.1) · D 36.9% · R 62.0% · Other 1.1%
- 2008→2024 swing
- -8.4pp toward R · 2008: -16.7pp · 2024: -25.1pp
- All cycles
- 2024: R+25.1 2020: R+22.4 2016: R+24.1 2012: R+19.4 2008: R+16.7
Not yet ingested
- Civics
- —
Market trends
- HPI YoY
- ▼ -41.76%
- Current HPI
- 275.5055
- Rent YoY
- —
- Metro
- Fayetteville, NC
- State GDP YoY
- ▲ 3.28%
- F500 in state
- 26
Industry mix (Fortune 500 HQ in NC)
| Industry | F500 HQs | Revenue |
|---|---|---|
| Financial Services | 2 | $213B |
|
||
| Retail | 2 | $95B |
|
||
| Industrial Conglomerate | 1 | $38B |
|
||
| Metals / Steel | 1 | $35B |
|
||
| Utilities | 1 | $30B |
|
||
| Industrial Machinery | 1 | $19B |
|
||
Price history
+583.9% since first listed25 events — show timeline
- 2026-05-08 Listed $194,900 TMLS
- 2026-05-07 Listing Removed — TMLS
- 2026-05-02 Price Changed $198,600 TMLS
- 2026-04-19 Price Changed $198,700 TMLS
- 2026-04-11 Price Changed $199,700 TMLS
- 2026-04-03 Price Changed $199,800 TMLS
- 2026-03-27 Listed $199,900 TMLS
- 2026-03-26 Listing Removed — TMLS
- 2026-03-06 Price Changed $203,900 TMLS
- 2026-01-16 Listed $204,900 TMLS
- 2026-01-15 Listing Removed — TMLS
- 2025-12-20 Price Changed $208,900 TMLS
- 2025-12-11 Listed $209,900 TMLS
- 2025-12-10 Listing Removed — TMLS
- 2025-12-06 Price Changed $213,700 TMLS
- 2025-11-21 Price Changed $213,800 TMLS
- 2025-11-17 Price Changed $214,800 TMLS
- 2025-11-15 Price Changed $214,900 TMLS
- 2025-10-30 Price Changed $219,800 TMLS
- 2025-10-04 Listed $219,900 TMLS
- 2025-03-07 Sold (Public Records) $67,500 Public Records
- 2003-05-13 Sold (MLS) $25,000 AMLSNC
- 2003-05-13 Sold (MLS) $25,000 TMLS
- 2003-01-02 Listed $28,500 AMLSNC
- 2003-01-02 Listed $28,500 TMLS
Property tax history
+1.1%/yrLatest (2025): $867 · +3.5% YoY. Source: county tax records.
Cash-flow waterfall
monthlySold comps — $/sqft
last 12 mo · ≤1 miLoading sold comps…