1056 Coastaway Dr · Virginia Beach, VA
Flood risk 1/10 · Minimal
- FEMA flood zone
- X (unshaded)
- Chance of flooding over 30 yrs
- 0.0%
- Est. flood insurance / yr
- $507 – $1,088
Fire risk 4/10 · Minor
- Est. fire insurance / yr
- $666 – $1,236
Heat risk 9/10 · Severe
- Hot days now (above 102°F)
- 7 days/yr
- Hot days in 30 yrs
- 16 days/yr
Wind risk 8/10 · Major
- Chance of severe wind over 30 yrs
- 99.0%
Air-quality risk 2/10 · Minimal
- Unhealthy air days now
- 1 days/yr
- Unhealthy air days in 30 yrs
- 2 days/yr
Risk factors via First Street. Map © Google.
Why this score? — see what drove the D grade
The composite is a weighted blend of 9 inputs, each scored 0–100. Each bar is that input's sub-score; the figure is the points it added to the 100-point composite (weight × sub-score).
- Cash flow +10.6/30.0
- ARV discount +9.7/15.0
- Schools +6.4/10.0
- Livability +4.2/5.0
- Rent growth +3.9/5.0
- DSCR +3.1/10.0
- Condition / age +2.5/5.0
- 1% rule +2.4/10.0
- Appreciation +0.0/10.0
$299,999
🖨 Deal sheet (PDF) 📄 Offer letter ✓ Due diligence
Listing remarks
Move-in-ready 3-bedroom, 1.5-bath townhome in sought-after Seabridge Square, minutes from the Virginia Beach oceanfront. This 1985 two-story home lives bright and clean after a full round of 2025-2026 updates: freshly painted neutral interior with redone doors and stairs, upgraded and rewired ceiling fans, all-new lighting, and a completely redone backyard with new plantings, lighting, a shed and a workshop. Curb appeal is dialed in too, with power-washed siding, a freshly painted front door, and new shrubs and plants out front. Inside you will find engineered hardwood and laminate flooring throughout, a covered patio, central air, and a functional layout. Public water and sewer, four parki
Key facts
- New lighting
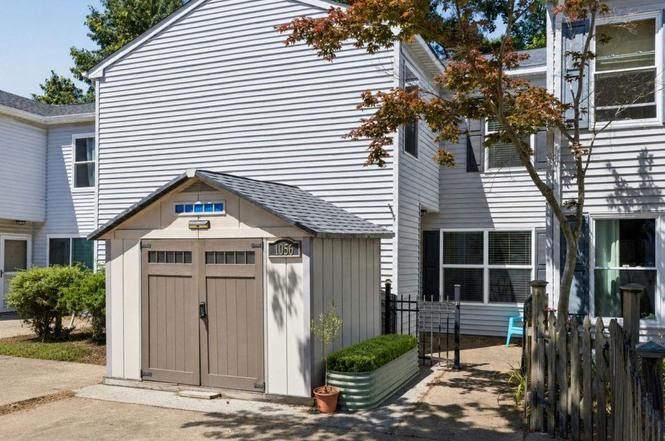
- Shed
- Move-in-ready
Tags
Property features AI
Finance
- HOA & community: No HOA fees
Exterior
- Parking: Off-street parking; Driveway spaces; 4 total parking spaces
- Utilities: City/County water; City/County sewer; Electric water heater; Electric power
- Home design: Attached townhouse; 2 stories; Simple ownership
- Construction: Vinyl siding; Asphalt shingle roof; Slab foundation; Built with additional workshop and storage shed
- Exterior features: Patio; Back privacy wood fence; Detached workshop; Storage shed
Interior
- Kitchen: Dishwasher; Microwave; Electric range; Refrigerator
- Bedrooms: No bedroom with a full bathroom on the first floor
- Flooring: Laminate; Wood
- Bathrooms: 1 full bath; 1 half bath
- Heating & cooling: Central air; Electric heating; Forced hot air
- Interior features: Ceiling fan; Pull-down attic stairs; Window treatments
- Laundry & utility: Washer; Dryer
Neighborhood map
What this means for you Summary
Snapshot
- This is a 3-bed/1.5-bath townhouse listed at $300k.
Deal economics
- At list price, monthly cash flow is $-147 ($-2k/yr) — negative.
- To cash-flow at today's rent, offer at most $274k (8.7% below list).
- To meet the 1% rule (rent ≥ 1% of price), the offer needs to be $223k (25.5% below list).
- Recommended offer: $223k (25.5% below list) — sets the bar for 1% rule.
- Cap rate 5.7% vs local median 3.5% in Virginia Beach — top-decile yield for the area; either an underpriced asset or a hidden risk that comps aren't pricing in. Stress-test before assuming the spread holds.
Location & tenants
- Location reads 83/100 on livability (#38 in VA, #880 nationally) — a professional / high-income tenant draw. Strengths: amenities A+, employment A+, housing A+; Watch: cost of living C-, commute F.
- Va Beach City Public School District (urban): math 69% / reading 78% proficiency, ranked #10 of 131 in VA (top 8%) — strong family-tenant draw, lease renewals of 3-5y typical.
- Zoned schools: Seatack Elementary An Achievable Dream Academy (math 47% / reading 57%, grade C-, #696 of 1,108 statewide, top 66%, 379 students, 93% FRL); Virginia Beach Middle (math 71% / reading 84%, grade A+, #36 of 342 statewide, top 11%, 589 students, 51% FRL); First Colonial High (math 76% / reading 81%, grade A-, #75 of 319 statewide, top 25%, 1,797 students, 34% FRL) — zoned schools average 59% FRL vs 28% district-wide (31 pts higher); higher-poverty schools than district average — tighter screening recommended.
- Market conditions: Rents rising fast (+5.4%/yr); 398 active listings in the ZIP; 40 comparable units currently listed for rent nearby; rentals at typical pace (median 18d on market — plan ~3-4 weeks tenant-placement turnaround); solid renter incomes; 666 units permitted in Virginia Beach city in 2024 (347 in 5+ unit buildings).
Forward outlook
- Local home prices are declining (-3.0%/yr); year-one equity from $2k of loan paydown is wiped out by about $9k of value loss. Plan a longer hold.
- Virginia Beach County population projected at +6% by 2050 — modest demand growth; plan on rents tracking national, not racing it.
Negotiation context
- Only 7 days on market — expect competitive offers; lowballing is unlikely to land.
- 2 sale attempts since 2y ago with the ask held roughly flat each time — persistent listings suggest the price (not the market) is what's stuck; bring a comps-based counter.
Risks & watch-outs
- Climate carrying-cost: severe wind risk, 99% chance of damaging wind over 30y; extreme-heat days projected 7→16/yr by 2055 (HVAC capex compounding) — expect insurance premiums to compound above CPI over the hold.
Questions for the listing agent
- What do current leases actually rent for vs. the listed asking? Can we see a recent rent roll and the last 12 months of T-12 income?
- Is there a deadline driving the sale (1031 exchange, divorce, estate, relocation)? That informs how much negotiation room exists.
- Schools are A-rated — typically a magnet for longer-tenancy family renters. What's the average tenant stay here, and is there a school-zone premium baked into asking?
- The area grade is low — what's the realistic commute time and amenity access for the typical tenant pool here? Any planned neighborhood developments (good or bad) we should know about?
- What's the average days-on-market for RENTAL listings here right now (not sales)? A rising rental-DOM trend means longer vacancies and softer asking-rent achievability than the comps imply.
- What's the recent tenant-quality profile in this submarket — average credit score on applications, eviction rate, late-payment / NSF rate, and stable-employment percentage? A property-management company in the area should have these aggregated.
- How much new for-sale + rental construction is in the pipeline within 1–3 miles? Heavy new supply typically softens prices + rents 12–24 months out; constrained supply supports both.
Investment metrics
- 1% rule
- 0.74% ✗
- Cap rate
- 5.70%
- Cash-on-cash
- -2.11%
- DSCR
- 0.91
- GRM
- 11.2
CMA / ARV
- ARV (on-the-fly)
- $315,180
- Comps found
- 12
Show comp detail 12 sales within ~0.75 mi
| Address | Dist | Beds/Ba | Sqft | Sold | Price | $/sf | Match |
|---|---|---|---|---|---|---|---|
| 841 12th St | 0.41mi | 2/2.5 (-1) | 1,061 (+3%) | 1mo | $403,000 | $380 | 66 |
| 1066 Ocean Pebbles Way | 0.25mi | 2/2.0 (-1) | 948 (-8%) | 4mo | $265,000 | $280 | 65 |
| 1173 Black Duck Ct | 0.31mi | 2/2.0 (-1) | 948 (-8%) | 2mo | $299,900 | $316 | 64 |
| 450 Marsh Duck Way | 0.33mi | 2/2.0 (-1) | 948 (-8%) | 2mo | $280,000 | $295 | 62 |
| 1129 Black Duck Ct | 0.36mi | 2/2.0 (-1) | 948 (-8%) | 2mo | $300,000 | $316 | 62 |
| 926 Rudee Ct | 0.54mi | 2/2.0 (-1) | 1,000 (-3%) | 3mo | $265,000 | $265 | 60 |
| 412 Marsh Duck Way | 0.39mi | 2/2.0 (-1) | 948 (-8%) | 2mo | $290,000 | $306 | 60 |
| 1106 Parks Ave | 0.49mi | 2/1.5 (-1) | 1,108 (+8%) | 1mo | $365,000 | $329 | 59 |
| 1010 Angler Ln | 0.47mi | 2/2.0 (-1) | 948 (-8%) | 2mo | $289,900 | $306 | 56 |
| 1120 Ocean Trace Ln #204 | 0.61mi | 2/2.0 (-1) | 945 (-8%) | 2mo | $249,000 | $263 | 50 |
| 1157 Old Virginia Beach Rd Unit I | 0.55mi | 2/2.5 (-1) | 1,148 (+12%) | 1mo | $296,000 | $258 | 46 |
| 2403 Marsh Creek Ct | 0.70mi | 2/2.5 (-1) | 1,152 (+12%) | 4mo | $285,000 | $247 | 35 |
Match score weights: distance 35% · size 25% · config 20% · recency 20%. Top-matched comps best support the ARV.
Projected returns pro-forma
-3.0% appreciation · 5.42% rent growth · sell at horizon
- IRR
- -17.4%
- Equity multiple
- 0.38×
- Total profit
- $-52,492
- Equity at exit
- $44,731
- IRR
- -5.7%
- Equity multiple
- 0.59×
- Total profit
- $-34,028
- Equity at exit
- $25,938
Cash invested: $84,000 (down + closing). Projections, not guarantees.
Landlord ↔ Tenant lean methodology
- Overall (STATE)
- 55 Moderately Landlord-Leaning
- State Virginia
- 55 Moderately Landlord-Leaning · D+2
- County
- — inherits STATE
- City
- — inherits STATE
ZIP-level market 23451
- Rents YoY
- 5.4%
- Active inventory
- 398
- Price-to-rent
- 11.2×
Monthly cashflow live
- Estimated rent
- $2,235 high interval (Pro) →
- Mortgage (P&I)
- −$1,573
- Tax from tax record
- −$215 /mo · $2,575/yr
- Insurance
- −$125
- HOA
- −$0
- Vacancy / Maint / Mgmt
- −$469
- Net cashflow
- $-147
Break-even live
Sensitivity live
| Price | -10% $22 | -5% $-62 | +0% $-147 | +5% $-232 | +10% $-317 |
|---|---|---|---|---|---|
| Rent | -10% $-324 | -5% $-236 | +0% $-147 | +5% $-59 | +10% $29 |
| Rate | -1.0pp $4 | -0.5pp $-71 | base $-147 | +0.5pp $-225 | +1.0pp $-304 |
UW: 25.0% down · 7.5% · 30yr · 1.5% tax · 5.0% vac · 8.0% maint · 8.0% mgmt
Financing live
Cash to close
- Down payment
- $75,000
- Closing costs
- $9,000
- Reserves months
- —
- Total cash needed
- —
Loan-product check · same deal, 3 products live
Conventional
25% down · 7.5% · 30yr
- Down + closing
- —
- Monthly P&I
- —
- Monthly cashflow
- —
- DSCR
- —
- Eligible?
- —
Personal DTI + credit; lowest rate.
DSCR
20% down · 8.5% · 30yr
- Down + closing
- —
- Monthly P&I
- —
- Monthly cashflow
- —
- DSCR
- —
- Eligible?
- —
No personal income docs; deal must DSCR.
Hard money
10% down · 12.0% · 12mo
- Down + closing
- —
- Monthly P&I
- —
- Monthly cashflow
- —
- DSCR
- —
- Eligible?
- —
Short-term bridge; refi at stabilization.
Rent comps 40 comps
| Address | Beds | Baths | Sqft | Rent | $/sqft | DOM | Units | Dist |
|---|---|---|---|---|---|---|---|---|
| 1005 Barnacle Ct Virginia Beach, VA | 2.0 | 1.0 | 930 | $1,850 | $1.99 | 6d | 1 | 0.06mi |
| 226 Birch Lake Rd Virginia Beach, VA | 1.0–3.0 | 1.0–2.0 | 947 | $1,961 | $2.07 | 3d | 11 | 0.11mi |
| 333 N Birdneck Rd Virginia Beach, VA | 2.0 | 1.0 | 1036 | $2,850 | $2.75 | 25d | 1 | 0.29mi |
| 400 Eden Roc Cir Virginia Beach, VA | 1.0–3.0 | 1.0–2.0 | 1114 | $3,192 | $2.87 | 3d | 18 | 0.34mi |
| 1038 Lands End Way Virginia Beach, VA | 2.0 | 2.0 | 948 | $1,799 | $1.90 | 16d | 1 | 0.40mi |
| 945 Indian Cir Virginia Beach, VA | 3.0 | 2.5 | 1400 | $2,300 | $1.64 | 25d | 1 | 0.46mi |
| 722 16th St Virginia Beach, VA | 3.0 | 1.5 | 1260 | $2,500 | $1.98 | 23d | 1 | 0.46mi |
| 904 Rudee Ave Virginia Beach, VA | 3.0 | 2.5 | 1250 | $2,800 | $2.24 | 6d | 1 | 0.50mi |
| 940 Old Virginia Beach Rd Virginia Beach, VA | 3.0 | 2.5 | 1400 | $2,500 | $1.79 | 25d | 1 | 0.51mi |
| 400 Coastal Walk Pl Virginia Beach, VA | 3.0 | 2.0 | 1422 | $2,600 | $1.83 | 25d | 1 | 0.52mi |
| 400 Coastal Walk Pl #105 Virginia Beach, VA | 3.0 | 2.0 | 1422 | $2,500 | $1.76 | 19d | 1 | 0.52mi |
| 901 Old Virginia Beach Rd Virginia Beach, VA | 2.0 | 1.5 | 1048 | $1,750 | $1.67 | 25d | 1 | 0.54mi |
| 408 Coastal Walk Pl #103 Virginia Beach, VA | 2.0 | 2.5 | 1409 | $2,200 | $1.56 | 14d | 1 | 0.54mi |
| 1300 Cypress Ave Virginia Beach, VA | 2.0 | 1.0 | 1137 | $2,000 | $1.76 | 18d | 1 | 0.54mi |
| 1509 Cypress Ave Virginia Beach, VA | 2.0 | 2.5 | 1200 | $2,750 | $2.29 | 6d | 1 | 0.55mi |
| 615 15th St #2 Virginia Beach, VA | 2.0 | 1.0 | 1000 | $2,400 | $2.40 | 16d | 1 | 0.56mi |
| 952 Maximus Sq Virginia Beach, VA | 2.0 | 1.0 | 1025 | $1,295 | $1.26 | 25d | 1 | 0.59mi |
| 501 Ocean Trace Arch #104 Virginia Beach, VA | 2.0 | 2.0 | 945 | $1,650 | $1.75 | 25d | 1 | 0.61mi |
| 620 Shoreham Ct #204 Virginia Beach, VA | 2.0 | 2.0 | 903 | $1,795 | $1.99 | 9d | 1 | 0.63mi |
| 604 Shoreham Ct #204 Virginia Beach, VA | 2.0 | 2.0 | 903 | $1,795 | $1.99 | 25d | 1 | 0.64mi |
| 1509 Colonnade Dr Virginia Beach, VA | 2.0 | 2.0 | 1074 | $2,190 | $2.04 | 12d | 1 | 0.67mi |
| 912 C Ave Virginia Beach, VA | 3.0 | 2.5 | 1367 | $2,500 | $1.83 | 12d | 1 | 0.68mi |
| 912 C Ave Unit C Virginia Beach, VA | 3.0 | 2.5 | 1367 | $3,500 | $2.56 | 16d | 1 | 0.68mi |
| 1225 Old Virginia Beach Rd Virginia Beach, VA | 2.0 | 2.0 | 1000 | $1,775 | $1.77 | 25d | 1 | 0.68mi |
| 1720 Baltic Ave Virginia Beach, VA | 2.0 | 2.5 | 1205 | $2,350 | $1.95 | 25d | 1 | 0.74mi |
| 517 21st St #102 Virginia Beach, VA | 2.0 | 1.0 | 750 | $1,500 | $2.00 | 25d | 1 | 0.78mi |
| 905 Leisure Sq #100 Virginia Beach, VA | 2.0 | 1.0 | 700 | $1,750 | $2.50 | 25d | 1 | 0.82mi |
| 909 Baltic Ave Virginia Beach, VA | 2.0 | 2.5 | 1054 | $2,600 | $2.47 | 3d | 1 | 0.86mi |
| 909 Baltic Ave Unit 1 Virginia Beach, VA | 2.0 | 2.5 | 907 | $2,695 | $2.97 | 25d | 1 | 0.87mi |
| 464 Lisa Sq Virginia Beach, VA | 3.0 | 1.0 | 885 | $1,510 | $1.71 | 25d | 1 | 0.89mi |
| 328 20th St Virginia Beach, VA | 2.0 | 1.0–2.0 | 784 | $2,935 | $3.74 | 3d | 122 | 0.94mi |
| 531 Terrace Ave Virginia Beach, VA | 3.0 | 1.0 | 1026 | $2,500 | $2.44 | 25d | 1 | 0.96mi |
| 405 Erle Cres Unit 105 Virginia Beach, VA | 2.0 | 1.0 | 750 | $1,800 | $2.40 | 3d | 1 | 0.96mi |
| 2222 Arctic Ave #3 Virginia Beach, VA | 2.0 | 2.0 | 868 | $2,395 | $2.76 | 18d | 1 | 0.96mi |
| 233 Sykes Ave Unit A Virginia Beach, VA | 3.0 | 2.5 | 1484 | $2,450 | $1.65 | 13d | 1 | 0.98mi |
| 2734 Manoomin Pl Virginia Beach, VA | 2.0 | 2.0 | 1428 | $1,995 | $1.40 | 13d | 1 | 0.99mi |
| 757 Saltmeadow Bay Dr Virginia Beach, VA | 1.0–3.0 | 1.0–2.5 | 1199 | $3,178 | $2.65 | 3d | 18 | 1.03mi |
| 399 Terrace Ave #101 Virginia Beach, VA | 2.0 | 1.0 | 800 | $1,600 | $2.00 | 25d | 1 | 1.08mi |
| 395 Terrace Ave #103 Virginia Beach, VA | 2.0 | 1.0 | 800 | $1,600 | $2.00 | 25d | 1 | 1.08mi |
| 1321 Linkhorn Cir Virginia Beach, VA | 2.0 | 1.0 | 850 | $1,265 | $1.49 | 9d | 4 | 1.10mi |
Listing history 5 events
-
2026-06-21statusdays on market $299,999 Active 7 DOM
-
2026-06-16statusdays on market $299,999 Under Contract 5 DOM
-
2026-06-15days on market $299,999 Active 4 DOM
-
2026-06-13remarks 699-char remark
-
2026-06-13$299,999 Active 2 DOM
ⓘ Source: listings_history table (triggers on properties + properties_extension) + one-shot
backfill from property_details.listing_events for pre-trigger history.
Tax reassessment forecast VA · Resets to sale price
- Current annual tax
- $2,575 · $215/mo
- Projected year-2 tax
- $2,575 · $215/mo
- Expected delta
- $0/yr ($0/mo · 0.0%)
ⓘ Screening estimate from a state-policy table — verify with the county assessor before closing.
Climate risk First Street
- Flood 1/10 Low FEMA zone X (unshaded) · 0% chance over 30 yrs
- Wildfire 4/10 Moderate
- Heat 9/10 Extreme 7 d/yr ≥102°F today · 16 d/yr by 30 yrs out
- Wind 8/10 Severe 99% chance of damaging wind over 30 yrs
- Air quality 2/10 Low 1 unhealthy d/yr today · 2 by 30 yrs out
Nearby sold comps map
Loading sold comps map…
Walkable amenities ~0.75 mi
Loading nearby amenities…
Taxation est. · year 1
- Rental income
- $26,817
- − Mortgage interest
- −$16,805
- − Property taxes
- −$2,575
- − Insurance
- −$1,500
- − Repairs & maintenance
- −$2,145
- − Management
- −$2,145
- − Depreciation
- −$8,727
- Taxable loss
- −$7,081
- Est. tax savings @ 24.0%
- +$1,699
- After-tax cash flow
- $-69/yr
For passive investors: Depreciation is non-cash, so a rental often shows a tax loss while cash-flowing — sheltering income. Rental losses are passive: they offset passive income freely, and up to $25,000/yr can offset ordinary (W-2) income if you actively participate and your MAGI is under $100k (phasing out to $0 by $150k); unused losses carry forward. On sale, claimed depreciation is recaptured at up to 25%, and gains may owe capital-gains tax (a 1031 exchange can defer both). Figures are a year-1 estimate at your 24.0% rate — not tax advice; consult a CPA.
Schools (NCES district)
- District
- Va Beach City Public School District
- NCES district ID
- 5103840
- Math proficiency
- 69% ▼ -19.00%
- Reading proficiency
- 78% ▼ -7.00%
- Median HH income
- $66,452
- Composite
- 63.81/100
- National rank
- #594
- State rank
- #10 of 131 in VA
Livability — Virginia Beach
- Score
- 83/100
- State rank
- #38
- US rank
- #880
Category grades
Schools grade is shown separately in the Schools card above.
Census & demographics
- Census place
- Virginia Beach, VA
- County
- Virginia Beach City · 448,227 people
- City population
- 448,227
- Metro
- Virginia Beach-Norfolk-Newport News, VA-NC
- Population (ZIP)
- 44,012
- Household income
- $100,697
- Rent vs Own
- Severe rent burden
- 2588.0
Population outlook (Virginia Beach County) Hauer SSP2
- Today (2025)
- 480,401 people
- By 2030
- 491,221 · +2.3%
- By 2040
- 504,882 · +5.1%
- By 2050
- 508,847 · +5.9%
- By 2075
- 504,831 · +5.1%
- By 2100
- 465,867 · -3.0%
Race, ethnicity, and origin ACS 2023
- Neighborhood character
- Predominantly White (78%)
- Race & ethnicity
- White 78% Black 7% Hispanic / Latino 7% Two or more races 7% Asian 3%
- Hispanic origin (detail)
- Mexican 3% Puerto Rican 1%
- Common ancestry
- Slovak 3% Romanian 3% Lithuanian 3%
- Foreign-born
- 6% · Canada, Vietnam
- Languages at home
- 92% English-only · Spanish 3% Other Indo-European 2% Russian/Polish/Slavic 1%
Political lean MEDSL · Virginia Beach
- 2024 margin
- Toss-up / Even · D 50.7% · R 48.0% · Other 1.3%
- 2008→2024 swing
- +3.4pp toward D · 2008: -0.7pp · 2024: 2.6pp
- All cycles
- 2024: D+2.6 2020: D+5.4 2016: R+4.5 2012: R+2.5 2008: R+0.7
Not yet ingested
- Civics
- —
Market trends
- HPI YoY
- ▼ -530.26%
- Current HPI
- 315.521
- Rent YoY
- ▲ 5.42%
- Metro
- Virginia Beach-Norfolk-Newport News, VA-NC
- State GDP YoY
- ▲ 2.40%
- F500 in state
- 50
Industry mix (Fortune 500 HQ in VA)
| Industry | F500 HQs | Revenue |
|---|---|---|
| Aerospace / Defense | 4 | $236B |
|
||
| Technology / Defense | 3 | $32B |
|
||
| Financial Services | 2 | $176B |
|
||
| Utilities | 2 | $27B |
|
||
| Insurance | 2 | $25B |
|
||
| Technology | 2 | $15B |
|
||
Price history
+494.1% since first listed6 events — show timeline
- 2026-06-11 Listed $299,999 REINMLS
- 2024-07-01 Sold (Public Records) $274,900 Public Records
- 2024-05-21 Pending — REINMLS
- 2024-05-17 Price Changed $273,000 REINMLS
- 2024-05-10 Listed $274,900 REINMLS
- 1986-01-22 Sold (Public Records) $50,500 Public Records
Property tax history
+6.2%/yrLatest (2025): $2,575 · +20.2% YoY. Source: county tax records.
Cash-flow waterfall
monthlySold comps — $/sqft
last 12 mo · ≤1 miLoading sold comps…