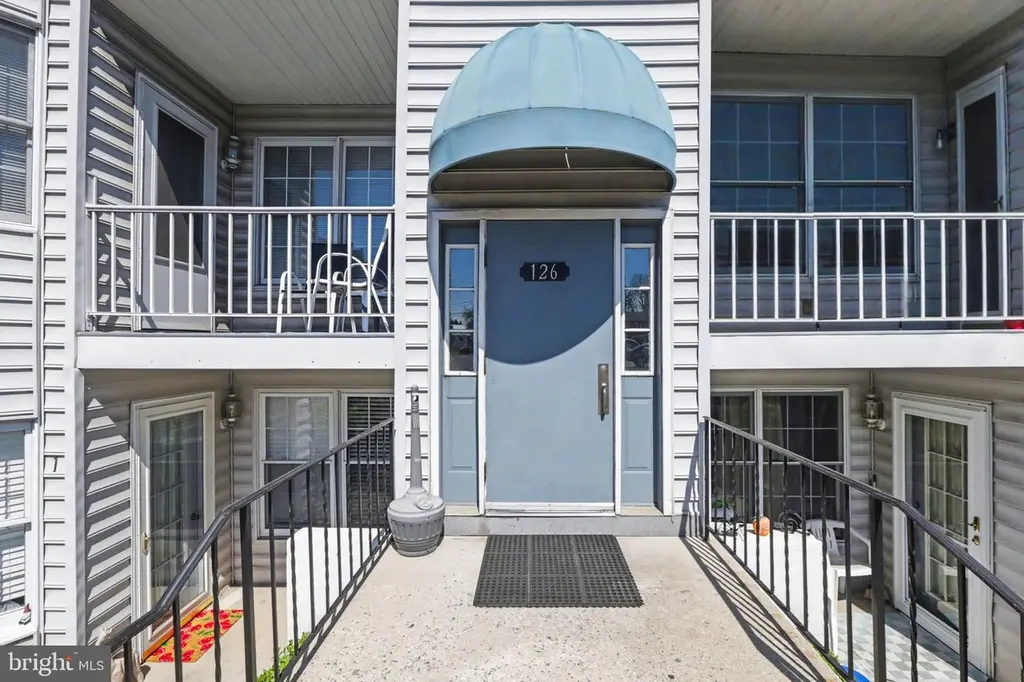
126 W Portland St · Mechanicsburg, PA
Flood risk No data
- FEMA flood zone
- —
- Chance of flooding over 30 yrs
- —
- Est. flood insurance / yr
- —
Fire risk No data
- Est. fire insurance / yr
- —
Heat risk No data
- Hot days now (above threshold)
- —
- Hot days in 30 yrs
- —
Wind risk No data
- Chance of severe wind over 30 yrs
- —
Air-quality risk No data
- Unhealthy air days now
- —
- Unhealthy air days in 30 yrs
- —
Risk factors via First Street. Map © Google.
Why this score? — see what drove the D grade
The composite is a weighted blend of 9 inputs, each scored 0–100. Each bar is that input's sub-score; the figure is the points it added to the 100-point composite (weight × sub-score).
- Cash flow +11.5/30.0
- ARV discount +7.5/15.0
- 1% rule +4.5/10.0
- Schools +4.3/10.0
- Livability +3.9/5.0
- DSCR +3.4/10.0
- Rent growth +3.0/5.0
- Condition / age +2.5/5.0
- Appreciation +0.0/10.0
$154,900
🖨 Deal sheet 📄 Offer letter ✓ Due diligence
Listing remarks
OPEN HOUSE: SUNDAY 4/19, 1P TO 3P. Come check it out! Looking for a place to call home that won't cost an arm, leg, and a kidney? Here you go! Enjoy simple living that is perfectly located for shopping, restaurants, commuting, and enjoying historic Mechanicsburg. Lounge in your cozy living room or hang out on the balcony to keep an eye on the comings and goings, all while enjoying what so many other listings don't have - low taxes and easy maintenance. Once a year, have a blast at the Jubilee Fair, the longest and largest one-day street fair on the East Coast. Check out the Boro's website for all that M'burg has to offer, but keep your eyes on this condo or it will disappear!
Key facts
- $160 HOA
- Built 1989
- Listed 13 days
Neighborhood map
What this means for you Summary
Snapshot
- This is a 2-bed/1.0-bath condo listed at $155k.
Deal economics
- At list price, monthly cash flow is $-50 ($-605/yr) — negative.
- To cash-flow at today's rent, offer at most $146k (5.7% below list).
- To meet the 1% rule (rent ≥ 1% of price), the offer needs to be $147k (5.3% below list).
- Recommended offer: $146k (5.7% below list) — sets the bar for cash-flow.
- Cap rate 5.9% vs local median 2.7% in Mechanicsburg — top-decile yield for the area; either an underpriced asset or a hidden risk that comps aren't pricing in. Stress-test before assuming the spread holds.
Location & tenants
- Location reads 77/100 on livability (#372 in PA, #3,259 nationally) — a middle-class / working-renter tenant base. Strengths: crime A+, cost of living A+, housing A+; Watch: amenities F, commute F.
- Mechanicsburg Area SD (suburban): math 38% / reading 60% proficiency, ranked #175 of 539 in PA (top 32%) — families likely to look elsewhere, expect single-tenant / working-renter base with shorter leases.
- Zoned schools: Mechanicsburg Area Shs (math 72% / reading 24%, grade D, #153 of 437 statewide, top 37%, 1,377 students, 33% FRL).
- Market conditions: Rents rising (+1.9%/yr); 287 active listings in the ZIP; 14 comparable units currently listed for rent nearby; rentals leasing fast (median 14d on market — plan ~1-2 weeks tenant-placement turnaround); solid renter incomes; 1,052 units permitted in Cumberland County in 2024 (310 in 5+ unit buildings).
- This rent is only 18% of the median local income ($99k/yr) — well below the 30% rent-burden line; pricing power to push rent on renewal without tenant pushback.
Forward outlook
- Local home prices are declining (-3.0%/yr); year-one equity from $1k of loan paydown is wiped out by about $5k of value loss. Plan a longer hold.
- Cumberland County population projected at +17% by 2050 — long-run rental-demand tailwind backs the buy-and-hold thesis.
Negotiation context
- Only 13 days on market — expect competitive offers; lowballing is unlikely to land.
- Current owner paid $60k; list at $155k implies a 159% gain — meaningful room to come down on a strong offer.
Questions for the listing agent
- What do current leases actually rent for vs. the listed asking? Can we see a recent rent roll and the last 12 months of T-12 income?
- What does the HOA fee cover, when was the last increase, and are there any pending special assessments or reserve-fund shortfalls?
- Any open or pending special assessments — roof, HVAC, plumbing, elevator, façade? What's the per-unit balance and payoff schedule, and is the seller paying it off at close or rolling it to the buyer?
- Is there a deadline driving the sale (1031 exchange, divorce, estate, relocation)? That informs how much negotiation room exists.
- Schools are A-rated — typically a magnet for longer-tenancy family renters. What's the average tenant stay here, and is there a school-zone premium baked into asking?
- The area grade is low — what's the realistic commute time and amenity access for the typical tenant pool here? Any planned neighborhood developments (good or bad) we should know about?
- What's the average days-on-market for RENTAL listings here right now (not sales)? A rising rental-DOM trend means longer vacancies and softer asking-rent achievability than the comps imply.
- What's the recent tenant-quality profile in this submarket — average credit score on applications, eviction rate, late-payment / NSF rate, and stable-employment percentage? A property-management company in the area should have these aggregated.
- How much new apartment / multifamily construction is in the pipeline within 1–3 miles? Heavy new supply (>2% of stock underway) typically softens rents 12–24 months out; light construction supports rent growth.
Investment metrics
- 1% rule
- 0.95% ✗
- Cap rate
- 5.90%
- Cash-on-cash
- -1.39%
- DSCR
- 0.94
- GRM
- 8.8
CMA / ARV
No comps found within radius.
Projected returns pro-forma
-3.0% appreciation · 1.89% rent growth · sell at horizon
- IRR
- -19.9%
- Equity multiple
- 0.31×
- Total profit
- $-29,824
- Equity at exit
- $23,096
- IRR
- -15.6%
- Equity multiple
- 0.17×
- Total profit
- $-36,168
- Equity at exit
- $13,393
Cash invested: $43,372 (down + closing). Projections, not guarantees.
Landlord ↔ Tenant lean methodology
- Overall (STATE)
- 62 Landlord-Friendly
- State Pennsylvania
- 62 Landlord-Friendly · EVEN
- County
- — inherits STATE
- City
- — inherits STATE
ZIP-level market 17055
- Rents YoY
- 1.9%
- Active inventory
- 287
- Price-to-rent
- 8.8×
Monthly cashflow live
- Estimated rent
- $1,466 high interval (Pro) →
- Mortgage (P&I)
- −$812
- Tax from tax record
- −$172 /mo · $2,062/yr
- Insurance
- −$65
- HOA
- −$160
- Vacancy / Maint / Mgmt
- −$308
- Net cashflow
- $-50
Break-even live
UW: 25.0% down · 7.5% · 30yr · 1.5% tax · 5.0% vac · 8.0% maint · 8.0% mgmt
Financing live
Cash to close
- Down payment
- $38,725
- Closing costs
- $4,647
- Reserves months
- —
- Total cash needed
- —
Loan-product check · same deal, 3 products live
Conventional
25% down · 7.5% · 30yr
- Down + closing
- —
- Monthly P&I
- —
- Monthly cashflow
- —
- DSCR
- —
- Eligible?
- —
Personal DTI + credit; lowest rate.
DSCR
20% down · 8.5% · 30yr
- Down + closing
- —
- Monthly P&I
- —
- Monthly cashflow
- —
- DSCR
- —
- Eligible?
- —
No personal income docs; deal must DSCR.
Hard money
10% down · 12.0% · 12mo
- Down + closing
- —
- Monthly P&I
- —
- Monthly cashflow
- —
- DSCR
- —
- Eligible?
- —
Short-term bridge; refi at stabilization.
Rent comps 14 comps
| Address | Beds | Baths | Sqft | Rent | $/sqft | DOM | Units | Dist |
|---|---|---|---|---|---|---|---|---|
| 44 W Green St Mechanicsburg, PA | 2.0 | 1.5 | 950 | $1,650 | $1.74 | 13d | 1 | 0.17mi |
| 6 W Green St Mechanicsburg, PA | 2.0 | 1.0 | 800 | $1,450 | $1.81 | 13d | 1 | 0.21mi |
| 121 E Portland St Mechanicsburg, PA | 2.0 | 1.0 | 986 | $950 | $0.96 | 13d | 1 | 0.33mi |
| 69 W Main St Unit 4 Mechanicsburg, PA | 1.0 | 1.0 | 780 | $1,045 | $1.34 | 23d | 1 | 0.35mi |
| 19 W Main St Unit 6 Mechanicsburg, PA | 2.0 | 1.0 | 900 | $1,500 | $1.67 | 43d | 1 | 0.36mi |
| 34 W Locust St Unit 1 Mechanicsburg, PA | 2.0 | 1.0 | 1000 | $1,200 | $1.20 | 43d | 1 | 0.40mi |
| 225 W Locust St Mechanicsburg, PA | 3.0 | 1.5 | 1300 | $1,800 | $1.38 | 43d | 1 | 0.41mi |
| 506 W Main St Apt 2 Mechanicsburg, PA | 1.0 | 1.0 | 800 | $1,495 | $1.87 | 13d | 1 | 0.52mi |
| 309 E Main St Unit 2ND/3RD FLOOR Mechanicsburg, PA | 2.0 | 1.0 | 950 | $995 | $1.05 | 13d | 1 | 0.58mi |
| 319 E Main St Unit 1ST FLOOR Mechanicsburg, PA | 3.0 | 1.5 | 1500 | $1,795 | $1.20 | 13d | 1 | 0.60mi |
| 411 S High St Unit 5 Mechanicsburg, PA | 1.0 | 1.0 | 900 | $1,000 | $1.11 | 13d | 1 | 0.63mi |
| 1200 W Church Rd Mechanicsburg, PA | 1.0 | 1.0 | 900 | $895 | $0.99 | 43d | 1 | 0.97mi |
| 128 Easterly Dr Mechanicsburg, PA | 2.0 | 1.5 | 1040 | $1,750 | $1.68 | 13d | 1 | 1.22mi |
| 1041 S Market St Mechanicsburg, PA | 2.0 | 2.0 | 1125 | $1,745 | $1.55 | 13d | 11 | 1.33mi |
HOA detail condo
- Monthly dues
- $160 · $1,920/yr
- Assessments
- None detected in remarks — confirm with the listing agent.
Listing history 5 events
-
2026-04-21status Pending
-
2026-04-16price $154,900
-
2026-04-09$155,000 Active
-
2026-04-06historical $155,000
-
1989-06-08soldstatus $59,900
ⓘ Source: listings_history table (triggers on properties + properties_extension) + one-shot
backfill from property_details.listing_events for pre-trigger history.
Tax reassessment forecast PA · Partial reset (capped growth)
- Current annual tax
- $2,062 · $172/mo
- Projected year-2 tax
- $2,254 · $188/mo
- Expected delta
- +$193/yr (+$16/mo · 9.4%)
ⓘ Screening estimate from a state-policy table — verify with the county assessor before closing.
Nearby sold comps map
Loading sold comps map…
Walkable amenities ~0.75 mi
Loading nearby amenities…
Taxation est. · year 1
- Rental income
- $17,594
- − Mortgage interest
- −$8,677
- − Property taxes
- −$2,062
- − Insurance
- −$774
- − Repairs & maintenance
- −$1,407
- − Management
- −$1,407
- − HOA
- −$1,920
- − Depreciation
- −$4,506
- Taxable loss
- −$3,160
- Est. tax savings @ 24.0%
- +$759
- After-tax cash flow
- $154/yr
For passive investors: Depreciation is non-cash, so a rental often shows a tax loss while cash-flowing — sheltering income. Rental losses are passive: they offset passive income freely, and up to $25,000/yr can offset ordinary (W-2) income if you actively participate and your MAGI is under $100k (phasing out to $0 by $150k); unused losses carry forward. On sale, claimed depreciation is recaptured at up to 25%, and gains may owe capital-gains tax (a 1031 exchange can defer both). Figures are a year-1 estimate at your 24.0% rate — not tax advice; consult a CPA.
Schools (NCES district)
- District
- Mechanicsburg Area SD
- NCES district ID
- 4215030
- Math proficiency
- 38% ▼ -16.00%
- Reading proficiency
- 60% ▼ -12.00%
- Median HH income
- $60,986
- Composite
- 42.92/100
- National rank
- #3118
- State rank
- #175 of 539 in PA
Livability — Mechanicsburg
- Score
- 77/100
- State rank
- #372
- US rank
- #3259
Category grades
Schools grade is shown separately in the Schools card above.
Census & demographics
- Census place
- Mechanicsburg, PA
- County
- Cumberland County · 257,673 people
- City population
- 85,577
- Metro
- Harrisburg-Carlisle, PA
- Population (ZIP)
- 42,006
- Household income
- $99,077
- Rent vs Own
- Severe rent burden
- 888.0
Population outlook (Cumberland County) Hauer SSP2
- Today (2025)
- 267,950 people
- By 2030
- 278,105 · +3.8%
- By 2040
- 296,552 · +10.7%
- By 2050
- 312,937 · +16.8%
- By 2075
- 349,233 · +30.3%
- By 2100
- 361,875 · +35.1%
Race, ethnicity, and origin ACS 2023
- Neighborhood character
- Predominantly White (85%)
- Race & ethnicity
- White 85% Two or more races 6% Hispanic / Latino 4% Black 3% Asian 3%
- Common ancestry
- Romanian 4% Slovak 3% Lithuanian 2%
- Foreign-born
- 5% · Canada, China
- Languages at home
- 94% English-only · Other Indo-European 2% Spanish 1%
Political lean MEDSL · Cumberland
- 2024 margin
- Lean R (+9.4) · D 44.6% · R 54.1% · Other 1.3%
- 2008→2024 swing
- +4.2pp toward D · 2008: -13.6pp · 2024: -9.4pp
- All cycles
- 2024: R+9.4 2020: R+10.6 2016: R+18.6 2012: R+18.5 2008: R+13.6
Not yet ingested
- Civics
- —
Market trends
- HPI YoY
- ▼ -202.92%
- Current HPI
- 254.7596
- Rent YoY
- ▲ 1.89%
- Metro
- Harrisburg-Carlisle, PA
- State GDP YoY
- ▲ 1.68%
- F500 in state
- 34
Industry mix (Fortune 500 HQ in PA)
| Industry | F500 HQs | Revenue |
|---|---|---|
| Healthcare | 2 | $309B |
|
||
| Insurance | 2 | $27B |
|
||
| Telecommunications / Media | 1 | $124B |
|
||
| Industrial Distribution | 1 | $22B |
|
||
| Financial Services | 1 | $20B |
|
||
| Chemicals / Materials | 1 | $18B |
|
||
Price history
+158.6% since first listed5 events — show timeline
- 2026-04-21 Pending — BRIGHT MLS
- 2026-04-16 Price Changed $154,900 BRIGHT MLS
- 2026-04-09 Listed $155,000 BRIGHT MLS
- 2026-04-06 Coming Soon $155,000 BRIGHT MLS
- 1989-06-08 Sold (Public Records) $59,900 Public Records
Property tax history
+2.6%/yrLatest (2026): $2,062 · +3.1% YoY. Source: county tax records.
Cash-flow waterfall
monthlySold comps — $/sqft
last 12 mo · ≤1 miLoading sold comps…