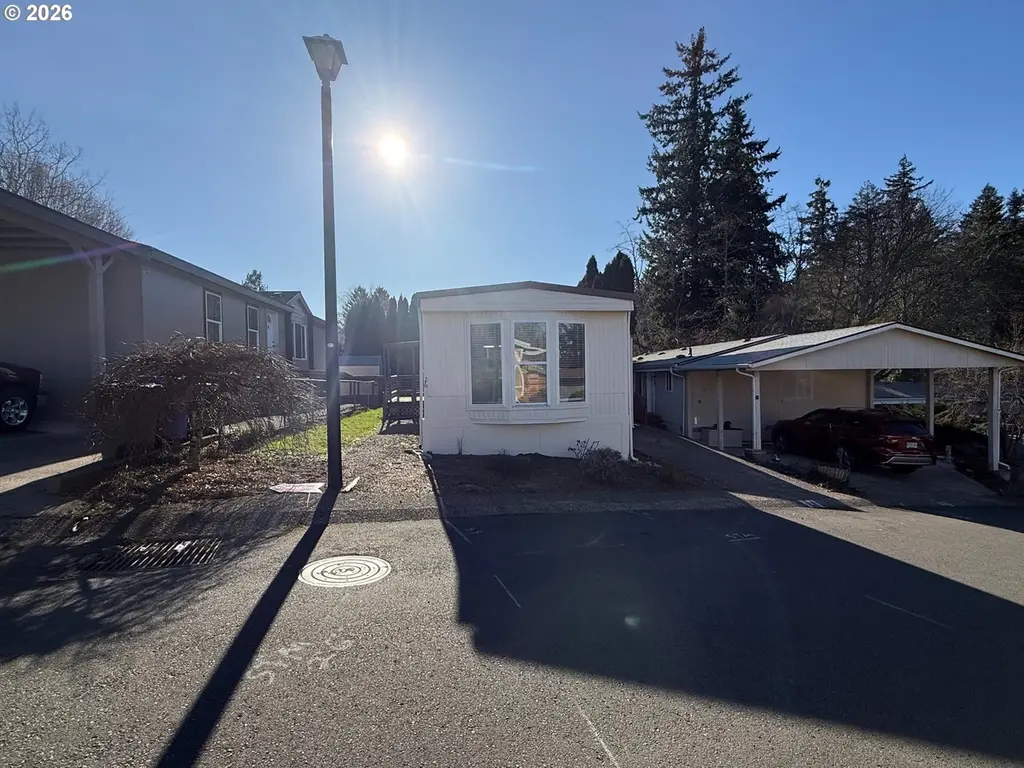
37600 Sunset St #26 · Sandy, OR
Flood risk 1/10 · Minimal
- FEMA flood zone
- X (unshaded)
- Chance of flooding over 30 yrs
- 0.0%
- Est. flood insurance / yr
- $507 – $1,088
Fire risk 4/10 · Minor
- Est. fire insurance / yr
- $498 – $926
Heat risk 2/10 · Minimal
- Hot days now (above 89°F)
- 7 days/yr
- Hot days in 30 yrs
- 15 days/yr
Wind risk 1/10 · Minimal
- Chance of severe wind over 30 yrs
- —
Air-quality risk 9/10 · Severe
- Unhealthy air days now
- 11 days/yr
- Unhealthy air days in 30 yrs
- 12 days/yr
Risk factors via First Street. Map © Google.
Why this score? — see what drove the B+ grade
The composite is a weighted blend of 9 inputs, each scored 0–100. Each bar is that input's sub-score; the figure is the points it added to the 100-point composite (weight × sub-score).
- Cash flow +30.0/30.0
- ARV discount +15.0/15.0
- 1% rule +10.0/10.0
- DSCR +10.0/10.0
- Schools +5.0/10.0
- Livability +4.2/5.0
- Rent growth +2.5/5.0
- Condition / age +2.5/5.0
- Appreciation +0.0/10.0
$79,000
🖨 Deal sheet 📄 Offer letter ✓ Due diligence
Listing remarks MLS
This home is a must see and bigger than it looks. This 2-bed, 2-bath home has a roomy kitchen, a cozy dining area, and a comfortable living room that's perfect for relaxing or entertaining. Enjoy the private yard, a great back deck for BBQs or morning coffee, and a handy tool shed for extra storage Washer, dryer, and refrigerator are all included-move-in ready and waiting for you!
Key facts
- Handy tool shed
- Private yard
- Back deck
Tags
Neighborhood map
What this means for you Summary
Snapshot
- This is a 2-bed/2.0-bath other listed at $79k.
Deal economics
- At list price, monthly cash flow is $414 ($5k/yr) — positive.
- The deal already cash-flows at list — no discount required.
- Meets the 1% rule at list price ($2k rent vs $79k).
- Recommended offer: $70k (12.0% below list) — sets the bar for market timing.
- Cap rate 12.6% vs local median 2.7% in Sandy — top-decile yield for the area; either an underpriced asset or a hidden risk that comps aren't pricing in. Stress-test before assuming the spread holds.
Location & tenants
- Location reads 84/100 on livability (#30 in OR, #755 nationally) — a professional / high-income tenant draw. Strengths: crime A+, employment A+, housing A+; Watch: cost of living D.
- Oregon Trail SD 46 (town): math 47% / reading 64% proficiency, ranked #12 of 183 in OR (top 7%) — acceptable for families but not a draw, mixed tenant base, ~2y average lease.
- Market conditions: 167 active listings in the ZIP; 12 comparable units currently listed for rent nearby; rentals at typical pace (median 18d on market — plan ~3-4 weeks tenant-placement turnaround); high-income renter base; 946 units permitted in Clackamas County in 2024 (188 in 5+ unit buildings).
Forward outlook
- Local home prices are declining (-3.0%/yr); year-one equity from $546 of loan paydown is wiped out by about $2k of value loss. Plan a longer hold.
- Clackamas County population projected at +25% by 2050 — long-run rental-demand tailwind backs the buy-and-hold thesis.
- At projected returns (-3.0% appreciation + 3.0% rent growth), your $22k cash investment doubles in ~6 years — after that, you're playing with house money.
Negotiation context
- It's been on market 238 days — a 12% lower offer ($70k) is reasonable based on typical stale-listing flexibility.
- 2 sale attempts since 18y ago; this cycle's ask has dropped $18k (19%) from the opening price — seller is motivated, your offer sets the floor, not the list.
- Current owner paid $12k; list at $79k implies a 532% gain — meaningful room to come down on a strong offer.
Risks & watch-outs
- Watch-outs: HOA is 38% of rent.
Questions for the listing agent
- It's been on market 238 days. Have you received any prior offers? Is the seller open to a 12% concession, seller financing, or rate buy-down credit?
- What does the HOA fee cover, when was the last increase, and are there any pending special assessments or reserve-fund shortfalls?
- Why hasn't it sold? Are there any deal-killer items the seller is aware of (foundation, flood, title, zoning, code violations)?
- Is there a deadline driving the sale (1031 exchange, divorce, estate, relocation)? That informs how much negotiation room exists.
- Schools are B-rated — typically a magnet for longer-tenancy family renters. What's the average tenant stay here, and is there a school-zone premium baked into asking?
- What's the average days-on-market for RENTAL listings here right now (not sales)? A rising rental-DOM trend means longer vacancies and softer asking-rent achievability than the comps imply.
- What's the recent tenant-quality profile in this submarket — average credit score on applications, eviction rate, late-payment / NSF rate, and stable-employment percentage? A property-management company in the area should have these aggregated.
- How much new for-sale + rental construction is in the pipeline within 1–3 miles? Heavy new supply typically softens prices + rents 12–24 months out; constrained supply supports both.
Investment metrics
- 1% rule
- 2.75% ✓
- Cap rate
- 12.58%
- Cash-on-cash
- 22.46%
- DSCR
- 2.00
- GRM
- 3.0
CMA / ARV
- ARV (median comp)
- $148,629
- List price
- $79,000
- Delta
- -46.85%
- Verdict
- UNDERPRICED
- Comps
- 5 within 1.0 mi
Projected returns pro-forma
-3.0% appreciation · 3.0% rent growth · sell at horizon
- IRR
- 15.7%
- Equity multiple
- 1.64×
- Total profit
- $14,067
- Equity at exit
- $11,779
- IRR
- 24.7%
- Equity multiple
- 3.18×
- Total profit
- $48,224
- Equity at exit
- $6,830
Cash invested: $22,120 (down + closing). Projections, not guarantees.
Landlord ↔ Tenant lean methodology
- Overall (STATE)
- 28 Tenant-Leaning
- State Oregon
- 28 Tenant-Leaning · D+6
- County
- — inherits STATE
- City
- — inherits STATE
ZIP-level market 97055
- Active inventory
- 167
- Price-to-rent
- 3.0×
Monthly cashflow live
- Estimated rent
- $2,171 high interval (Pro) →
- Mortgage (P&I)
- −$414
- Tax from tax record
- −$24 /mo · $282/yr
- Insurance
- −$33
- HOA
- −$830
- Vacancy / Maint / Mgmt
- −$456
- Net cashflow
- $414
Break-even live
UW: 25.0% down · 7.5% · 30yr · 1.5% tax · 5.0% vac · 8.0% maint · 8.0% mgmt
Financing live
Cash to close
- Down payment
- $19,750
- Closing costs
- $2,370
- Reserves months
- —
- Total cash needed
- —
Loan-product check · same deal, 3 products live
Conventional
25% down · 7.5% · 30yr
- Down + closing
- —
- Monthly P&I
- —
- Monthly cashflow
- —
- DSCR
- —
- Eligible?
- —
Personal DTI + credit; lowest rate.
DSCR
20% down · 8.5% · 30yr
- Down + closing
- —
- Monthly P&I
- —
- Monthly cashflow
- —
- DSCR
- —
- Eligible?
- —
No personal income docs; deal must DSCR.
Hard money
10% down · 12.0% · 12mo
- Down + closing
- —
- Monthly P&I
- —
- Monthly cashflow
- —
- DSCR
- —
- Eligible?
- —
Short-term bridge; refi at stabilization.
Rent comps 12 comps
| Address | Beds | Baths | Sqft | Rent | $/sqft | DOM | Units | Dist |
|---|---|---|---|---|---|---|---|---|
| 17333 Ruben Ln #18 Sandy, OR | 2.0 | 2.0 | 856 | $1,895 | $2.21 | 43d | 1 | 0.16mi |
| 38100 Sandy Heights St Sandy, OR | 2.0 | 1.0–2.0 | 864 | $2,070 | $2.39 | 1d | 11 | 0.48mi |
| 36196 Skogan Rd Unit 1 Sandy, OR | 2.0 | 2.0 | 1000 | $1,995 | $2.00 | 23d | 1 | 0.52mi |
| 18230 Seaman St Sandy, OR | 3.0 | 1.0 | 1000 | $2,400 | $2.40 | 4d | 1 | 0.66mi |
| 18230 Seaman St Sandy, OR | 3.0 | 1.0 | 1000 | $2,400 | $2.40 | 17d | 1 | 0.66mi |
| 18138 Seaman St Sandy, OR | 3.0 | 2.0 | 1296 | $2,495 | $1.93 | 2d | 1 | 0.71mi |
| 38800 Creekside Loop Sandy, OR | 2.0 | 2.0 | 1000 | $1,695 | $1.70 | 1d | 1 | 0.78mi |
| 38927 Cascadia Village Dr Sandy, OR | 3.0 | 2.0 | 1250 | $2,500 | $2.00 | 43d | 1 | 1.09mi |
| 39560 Gary St Unit 24 Sandy, OR | 2.0 | 1.0 | 850 | $1,875 | $2.21 | 7d | 1 | 1.18mi |
| 19040 Wallingford Ave Sandy, OR | 3.0 | 2.0 | 1217 | $2,650 | $2.18 | 43d | 1 | 1.30mi |
| 39910 McCormick Dr Unit 39910 Sandy, OR | 2.0 | 1.0 | 956 | $1,950 | $2.04 | 23d | 1 | 1.31mi |
| 39895 Evans St Sandy, OR | 3.0 | 2.5 | 1215 | $2,795 | $2.30 | 7d | 1 | 1.32mi |
HOA detail
- Monthly dues
- $830 · $9,960/yr
Listing history 19 events
-
2026-06-18days on market $79,000 Active 238 DOM
-
2026-06-17days on market $79,000 Active 237 DOM
-
2026-06-16days on market $79,000 Active 236 DOM
-
2026-06-15days on market $79,000 Active 235 DOM
-
2026-06-13days on market $79,000 Active 233 DOM
-
2026-06-13days on market $79,000 Active 232 DOM
-
2026-06-09days on market $79,000 Active 229 DOM
-
2026-06-08days on market $79,000 Active 228 DOM
-
2026-06-07days on market $79,000 Active 227 DOM
-
2026-06-03days on market $79,000 Active 223 DOM
-
2026-06-02days on market $79,000 Active 222 DOM
-
2026-06-01days on market $79,000 Active 221 DOM
-
2026-05-31days on market $79,000 Active 220 DOM
-
2026-05-18price $79,000 384-char remark
Show marketing remark (384 chars)
This home is a must see and bigger than it looks. This 2-bed, 2-bath home has a roomy kitchen, a cozy dining area, and a comfortable living room that's perfect for relaxing or entertaining. Enjoy the private yard, a great back deck for BBQs or morning coffee, and a handy tool shed for extra storage Washer, dryer, and refrigerator are all included-move-in ready and waiting for you!
-
2025-12-03price $89,000 384-char remark
Show marketing remark (384 chars)
This home is a must see and bigger than it looks. This 2-bed, 2-bath home has a roomy kitchen, a cozy dining area, and a comfortable living room that's perfect for relaxing or entertaining. Enjoy the private yard, a great back deck for BBQs or morning coffee, and a handy tool shed for extra storage Washer, dryer, and refrigerator are all included-move-in ready and waiting for you!
-
2025-10-23$97,000 Active 384-char remark
Show marketing remark (384 chars)
This home is a must see and bigger than it looks. This 2-bed, 2-bath home has a roomy kitchen, a cozy dining area, and a comfortable living room that's perfect for relaxing or entertaining. Enjoy the private yard, a great back deck for BBQs or morning coffee, and a handy tool shed for extra storage Washer, dryer, and refrigerator are all included-move-in ready and waiting for you!
-
2008-09-29soldstatus $12,500 181-char remark
Show marketing remark (181 chars)
Super Nice Home with Newer Carpet, Vinyl Windows, Rubber Roof & Appliances. Home has Large Tip Out which enlarged the Living Room to18 x 13 and the Formal Dining Room to 9 x 7.
-
2008-09-26historical 181-char remark
Show marketing remark (181 chars)
Super Nice Home with Newer Carpet, Vinyl Windows, Rubber Roof & Appliances. Home has Large Tip Out which enlarged the Living Room to18 x 13 and the Formal Dining Room to 9 x 7.
-
2008-08-01$12,500 181-char remark
Show marketing remark (181 chars)
Super Nice Home with Newer Carpet, Vinyl Windows, Rubber Roof & Appliances. Home has Large Tip Out which enlarged the Living Room to18 x 13 and the Formal Dining Room to 9 x 7.
ⓘ Source: listings_history table (triggers on properties + properties_extension) + one-shot
backfill from property_details.listing_events for pre-trigger history.
Tax reassessment forecast OR · Resets to sale price
- Current annual tax
- $282 · $24/mo
- Projected year-2 tax
- $766 · $64/mo
- Expected delta
- +$484/yr (+$40/mo · 171.6%)
ⓘ Screening estimate from a state-policy table — verify with the county assessor before closing.
Climate risk First Street
- Flood 1/10 Low FEMA zone X (unshaded) · 0% chance over 30 yrs
- Wildfire 4/10 Moderate
- Heat 2/10 Low 7 d/yr ≥89°F today · 15 d/yr by 30 yrs out
- Wind 1/10 Low
- Air quality 9/10 Extreme 11 unhealthy d/yr today · 12 by 30 yrs out
Nearby sold comps map
Loading sold comps map…
Walkable amenities ~0.75 mi
Loading nearby amenities…
Taxation est. · year 1
- Rental income
- $26,047
- − Mortgage interest
- −$4,425
- − Property taxes
- −$282
- − Insurance
- −$395
- − Repairs & maintenance
- −$2,084
- − Management
- −$2,084
- − HOA
- −$9,960
- − Depreciation
- −$2,298
- Taxable income
- $4,519
- Est. tax owed @ 24.0%
- −$1,085
- After-tax cash flow
- $3,884/yr
For passive investors: Depreciation is non-cash, so a rental often shows a tax loss while cash-flowing — sheltering income. Rental losses are passive: they offset passive income freely, and up to $25,000/yr can offset ordinary (W-2) income if you actively participate and your MAGI is under $100k (phasing out to $0 by $150k); unused losses carry forward. On sale, claimed depreciation is recaptured at up to 25%, and gains may owe capital-gains tax (a 1031 exchange can defer both). Figures are a year-1 estimate at your 24.0% rate — not tax advice; consult a CPA.
Schools (NCES district)
- District
- Oregon Trail SD 46
- NCES district ID
- 4110890
- Math proficiency
- 47% ▬ 0.00%
- Reading proficiency
- 64% ▲ 1.00%
- Median HH income
- $61,406
- Composite
- 50.19/100
- National rank
- #4075
- State rank
- #12 of 183 in OR
Livability — Sandy
- Score
- 84/100
- State rank
- #30
- US rank
- #755
Category grades
Schools grade is shown separately in the Schools card above.
Census & demographics
- Census place
- Sandy, OR
- County
- Clackamas County · 361,406 people
- City population
- 19,786
- Metro
- Portland-Vancouver-Hillsboro, OR-WA
- Population (ZIP)
- 19,786
- Household income
- $112,323
- Rent vs Own
- Severe rent burden
- 377.0
Population outlook (Clackamas County) Hauer SSP2
- Today (2025)
- 458,456 people
- By 2030
- 485,185 · +5.8%
- By 2040
- 532,932 · +16.2%
- By 2050
- 574,445 · +25.3%
- By 2075
- 665,497 · +45.2%
- By 2100
- 697,488 · +52.1%
Race, ethnicity, and origin ACS 2023
- Neighborhood character
- Predominantly White (87%)
- Race & ethnicity
- White 87% Two or more races 8% Hispanic / Latino 5% Asian 1% Native American 1%
- Common ancestry
- Portuguese 4% Iranian 4% Italian 3%
- Foreign-born
- 4% · Canada, Vietnam
- Languages at home
- 95% English-only · Spanish 2% Other Asian/Pacific 1% German/W. Germanic 1%
Political lean MEDSL · Clackamas
- 2024 margin
- Lean D (+9.7) · D 53.4% · R 43.6% · Other 3.0%
- 2008→2024 swing
- -0.6pp no change · 2008: 10.4pp · 2024: 9.7pp
- All cycles
- 2024: D+9.7 2020: D+11.1 2016: D+6.1 2012: D+3.5 2008: D+10.4
Not yet ingested
- Civics
- —
Market trends
- HPI YoY
- ▼ -230.74%
- Current HPI
- 274.9046
- Rent YoY
- —
- Metro
- Portland-Vancouver-Hillsboro, OR-WA
- State GDP YoY
- ▲ 2.05%
- F500 in state
- 2
Industry mix (Fortune 500 HQ in OR)
| Industry | F500 HQs | Revenue |
|---|---|---|
| Consumer Goods | 1 | $51B |
|
||
Price history
+532.0% since first listed6 events — show timeline
- 2026-05-18 Price Changed $79,000 RMLS
- 2025-12-03 Price Changed $89,000 RMLS
- 2025-10-23 Listed $97,000 RMLS
- 2008-09-29 Sold (MLS) $12,500 RMLS
- 2008-09-26 Delisted — RMLS
- 2008-08-01 Listed $12,500 RMLS
Property tax history
+1.8%/yrLatest (2018): $282 · +3.0% YoY. Source: county tax records.
Cash-flow waterfall
monthlySold comps — $/sqft
last 12 mo · ≤1 miLoading sold comps…