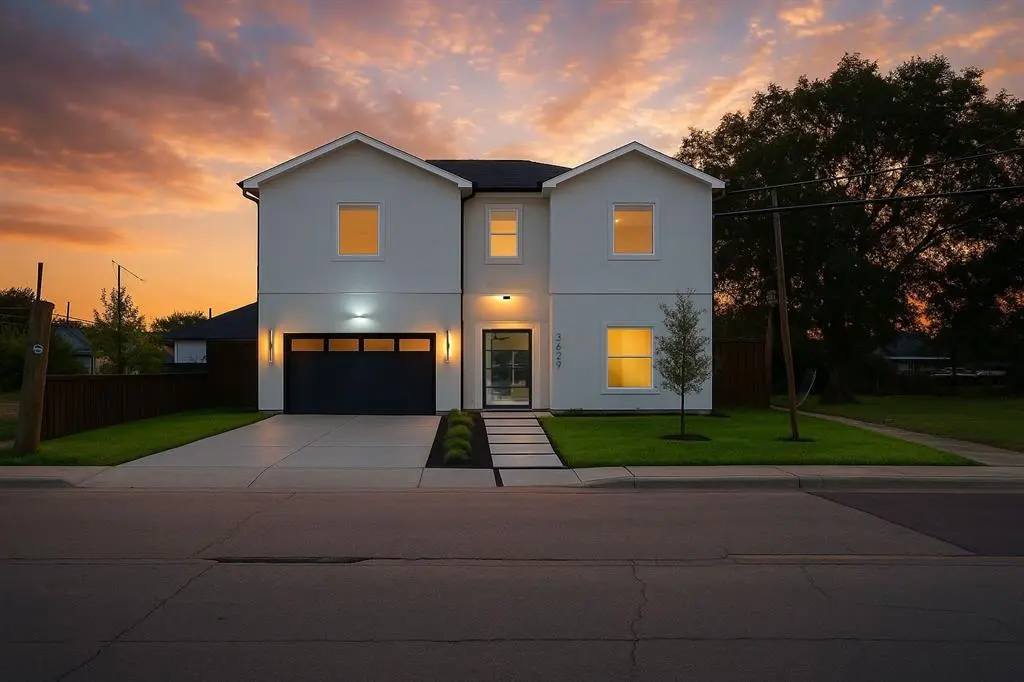
3629 Vilbig Rd · Dallas, TX
Flood risk No data
- FEMA flood zone
- —
- Chance of flooding over 30 yrs
- —
- Est. flood insurance / yr
- —
Fire risk No data
- Est. fire insurance / yr
- —
Heat risk No data
- Hot days now (above threshold)
- —
- Hot days in 30 yrs
- —
Wind risk No data
- Chance of severe wind over 30 yrs
- —
Air-quality risk No data
- Unhealthy air days now
- —
- Unhealthy air days in 30 yrs
- —
Risk factors via First Street. Map © Google.
Why this score? — see what drove the F grade
The composite is a weighted blend of 9 inputs, each scored 0–100. Each bar is that input's sub-score; the figure is the points it added to the 100-point composite (weight × sub-score).
- Appreciation +10.0/10.0
- ARV discount +5.1/15.0
- Livability +4.0/5.0
- Schools +2.8/10.0
- Cash flow +2.6/30.0
- Condition / age +2.5/5.0
- Rent growth +1.4/5.0
- 1% rule +0.0/10.0
- DSCR +0.0/10.0
$699,000
🖨 Deal sheet (PDF) 📄 Offer letter ✓ Due diligence
Listing remarks
Experience luxury living in this stunning 3,572 sq ft modern new construction, perfectly located just minutes from Downtown Dallas in the heart of vibrant Trinity Groves. Featuring 4 spacious bedrooms and 3.5 baths, this home offers the option to have your primary suite either upstairs or downstairs. The primary suite is a true retreat with a spa-inspired bathroom, double vanities, a soaking tub, and an oversized walk-in closet. The chef’s kitchen is a showstopper, boasting Quartzite countertops, an island with a pop-up charging port, under-cabinet lighting, a luxury 6-burner range, pot filler, and a spacious walk-in pantry. Just off the kitchen, a stunning glass-enclosed wine display
Key facts
- Second living area
- Chef's kitchen
- 9,191 sq ft lot
Tags
Property features AI
Finance
- Other: Property is not attached; Subdivision: Victory Gardens 02; County: Dallas; Possession at closing/funding; Listing status: Active
- Financial info: Accepts Cash, Conventional, FHA, and VA financing
- HOA & community: No association
Exterior
- Parking: 2 covered spaces; 2-car attached garage; Driveway; Garage door opener
- Security: Smoke detector(s)
- Utilities: City water; City sewer; No municipal utility district
- Home design: Single-family residence; Residential property; Two levels; New construction (completed in 2025)
- Construction: Composition roof; Slab foundation; Built in 2025
- Exterior features: Corner lot
Interior
- Kitchen: Built-in gas range; Kitchen island; Pantry
- Bedrooms: 4 bedrooms (primary bedroom on level 1)
- Bathrooms: 3 full bathrooms; 1 half bathroom
- Interior features: Built-in features; Cable TV available; Decorative lighting; Double vanity; High speed internet available; Kitchen island; Pantry; Walk-in closets; Two living areas; Two dining areas; Electric fireplace
Neighborhood map
What this means for you Summary
Snapshot
- This is a 3-bed/2.0-bath single-family listed at $699k.
Deal economics
- At list price, monthly cash flow is $-2k ($-29k/yr) — negative.
- To cash-flow at today's rent, offer at most $274k (60.8% below list).
- To meet the 1% rule (rent ≥ 1% of price), the offer needs to be $224k (68.0% below list).
- Recommended offer: $224k (68.0% below list) — sets the bar for 1% rule.
Location & tenants
- Location reads 81/100 on livability (#24 in TX, #1,380 nationally) — a professional / high-income tenant draw. Strengths: amenities A+, commute A+, housing A+; Watch: crime F.
- Dallas ISD (urban): math 31% / reading 36% proficiency, ranked #559 of 826 in TX (top 68%) — families likely to look elsewhere, expect single-tenant / working-renter base with shorter leases; 83% free/reduced lunch — lower-income household profile, screen leases tightly.
- Zoned schools: C F Carr El (math 32% / reading 22%, grade F, #2,791 of 4,322 statewide, top 68%, 281 students, 99% FRL); D A Hulcy Steam Middle (math 33% / reading 32%, grade F, #947 of 1,662 statewide, top 58%, 423 students, 88% FRL); L G Pinkston H S (math 10% / reading 21%, grade F, #1,505 of 1,632 statewide, top 92%, 1,139 students, 92% FRL).
- Market conditions: Rents falling (-4.2%/yr); 249 active listings in the ZIP; 40 comparable units currently listed for rent nearby; rentals at typical pace (median 20d on market — plan ~3-4 weeks tenant-placement turnaround); 12,577 units permitted in Dallas County in 2024 (6,829 in 5+ unit buildings).
- This rent runs 45% of the median local income ($60k/yr) — at the standard rent-burdened threshold; future hikes will face affordability resistance.
Forward outlook
- In year one you build about $75k of equity ($5k loan paydown + $70k appreciation (10.0% local appreciation)).
- Dallas County population projected at +35% by 2050 — long-run rental-demand tailwind backs the buy-and-hold thesis.
- By year 2, paydown + projected appreciation supports a ~$120k cash-out refi (75% LTV) — recoverable capital for the next deal without selling this one.
Negotiation context
- It's been on market 39 days — a 3% lower offer ($678k) is reasonable based on typical stale-listing flexibility.
- 5 sale attempts; this cycle's ask is 14462% above the opening price — seller raised mid-cycle; expect resistance to lowballs.
Questions for the listing agent
- What do current leases actually rent for vs. the listed asking? Can we see a recent rent roll and the last 12 months of T-12 income?
- It's been on market 39 days. Have you received any prior offers? Is the seller open to a 68% concession, seller financing, or rate buy-down credit?
- Is there a deadline driving the sale (1031 exchange, divorce, estate, relocation)? That informs how much negotiation room exists.
- Crime grade is F in this area — have there been break-ins, vandalism, or insurance claims at this property in the last 3 years? What carrier currently insures it and at what premium?
- The area grade is low — what's the realistic commute time and amenity access for the typical tenant pool here? Any planned neighborhood developments (good or bad) we should know about?
- What's the average days-on-market for RENTAL listings here right now (not sales)? A rising rental-DOM trend means longer vacancies and softer asking-rent achievability than the comps imply.
- What's the recent tenant-quality profile in this submarket — average credit score on applications, eviction rate, late-payment / NSF rate, and stable-employment percentage? A property-management company in the area should have these aggregated.
- How much new for-sale + rental construction is in the pipeline within 1–3 miles? Heavy new supply typically softens prices + rents 12–24 months out; constrained supply supports both.
Investment metrics
- 1% rule
- 0.32% ✗
- Cap rate
- 2.17%
- Cash-on-cash
- -14.74%
- DSCR
- 0.34
- GRM
- 26.0
CMA / ARV
- ARV (median comp)
- $663,337
- List price
- $699,000
- Delta
- 5.38%
- Verdict
- FAIR
- Comps
- 20 within 1.0 mi
Show comp detail 12 sales within ~0.75 mi
| Address | Dist | Beds/Ba | Sqft | Sold | Price | $/sf | Match |
|---|---|---|---|---|---|---|---|
| 1826 Kraft St | 0.25mi | 3/2.0 | 1,333 (+0%) | 3mo | $314,990 | $236 | 86 |
| 3503 Chicago St | 0.34mi | 3/2.0 | 1,283 (-4%) | 1mo | $296,240 | $231 | 77 |
| 3411 Ladd | 0.33mi | 3/2.0 | 1,253 (-6%) | 4mo | $250,000 | $200 | 72 |
| 3414 Vilbig Rd | 0.23mi | 4/2.0 (+1) | 1,243 (-6%) | 5mo | $285,000 | $229 | 69 |
| 1711 Kraft St | 0.22mi | 2/1.0 (-1) | 1,226 (-8%) | 7mo | $154,900 | $126 | 62 |
| 2019 Mcbroom St | 0.47mi | 3/1.5 | 1,288 (-3%) | 11mo | $275,000 | $214 | 62 |
| 4011 Puget St | 0.43mi | 3/2.0 | 1,465 (+10%) | 2mo | $250,000 | $171 | 62 |
| 1961 Morris St | 0.38mi | 3/2.0 | 1,169 (-12%) | 3mo | $285,000 | $244 | 60 |
| 1949 Gallagher St | 0.30mi | 3/2.0 | 1,188 (-11%) | 11mo | $200,000 | $168 | 59 |
| 2001 Toronto St | 0.61mi | 3/2.0 | 1,271 (-4%) | 9mo | $250,000 | $197 | 56 |
| 1423 Toronto St | 0.59mi | 3/2.0 | 1,428 (+7%) | 6mo | $250,000 | $175 | 55 |
| 1402 Mcbroom St | 0.46mi | 2/1.0 (-1) | 1,190 (-10%) | 5mo | $189,500 | $159 | 48 |
Match score weights: distance 35% · size 25% · config 20% · recency 20%. Top-matched comps best support the ARV.
Projected returns pro-forma
10.0% appreciation · 0.0% rent growth · sell at horizon
- IRR
- 13.6%
- Equity multiple
- 2.13×
- Total profit
- $220,625
- Equity at exit
- $629,715
- IRR
- 13.5%
- Equity multiple
- 4.87×
- Total profit
- $757,639
- Equity at exit
- $1,358,003
Cash invested: $195,720 (down + closing). Projections, not guarantees.
Landlord ↔ Tenant lean methodology
- Overall (STATE)
- 87 Strongly Landlord-Friendly
- State Texas
- 87 Strongly Landlord-Friendly · R+5
- County
- — inherits STATE
- City
- — inherits STATE
ZIP-level market 75212
- Rents YoY
- -4.2%
- Active inventory
- 249
- Price-to-rent
- 26.0×
Monthly cashflow live
- Estimated rent
- $2,240 high interval (Pro) →
- Mortgage (P&I)
- −$3,666
- Tax from tax record
- −$217 /mo · $2,604/yr
- Insurance
- −$291
- HOA
- −$0
- Vacancy / Maint / Mgmt
- −$470
- Net cashflow
- $-2,404
Break-even live
Sensitivity live
| Price | -10% $-2,009 | -5% $-2,207 | +0% $-2,404 | +5% $-2,602 | +10% $-2,800 |
|---|---|---|---|---|---|
| Rent | -10% $-2,581 | -5% $-2,493 | +0% $-2,404 | +5% $-2,316 | +10% $-2,227 |
| Rate | -1.0pp $-2,052 | -0.5pp $-2,227 | base $-2,404 | +0.5pp $-2,585 | +1.0pp $-2,770 |
UW: 25.0% down · 7.5% · 30yr · 1.5% tax · 5.0% vac · 8.0% maint · 8.0% mgmt
Financing live
Cash to close
- Down payment
- $174,750
- Closing costs
- $20,970
- Reserves months
- —
- Total cash needed
- —
Loan-product check · same deal, 3 products live
Conventional
25% down · 7.5% · 30yr
- Down + closing
- —
- Monthly P&I
- —
- Monthly cashflow
- —
- DSCR
- —
- Eligible?
- —
Personal DTI + credit; lowest rate.
DSCR
20% down · 8.5% · 30yr
- Down + closing
- —
- Monthly P&I
- —
- Monthly cashflow
- —
- DSCR
- —
- Eligible?
- —
No personal income docs; deal must DSCR.
Hard money
10% down · 12.0% · 12mo
- Down + closing
- —
- Monthly P&I
- —
- Monthly cashflow
- —
- DSCR
- —
- Eligible?
- —
Short-term bridge; refi at stabilization.
Rent comps 40 comps
| Address | Beds | Baths | Sqft | Rent | $/sqft | DOM | Units | Dist |
|---|---|---|---|---|---|---|---|---|
| 1723 Shaw St Dallas, TX | 4.0 | 3.0 | 1720 | $2,699 | $1.57 | 9d | 1 | 0.10mi |
| 1834 Bayside St Dallas, TX | 3.0 | 2.0 | 1322 | $2,000 | $1.51 | 19d | 1 | 0.13mi |
| 1610 Life Ave Dallas, TX | 3.0 | 2.5 | 1657 | $2,800 | $1.69 | 45d | 1 | 0.15mi |
| 1902 Angelina Dr Dallas, TX | 3.0 | 1.0 | 1040 | $1,695 | $1.63 | 1d | 1 | 0.26mi |
| 1739 McBroom St Dallas, TX | 3.0 | 2.0 | 1138 | $2,100 | $1.85 | 13d | 1 | 0.30mi |
| 1944 Gallagher St Dallas, TX | 3.0 | 2.0 | 1125 | $1,961 | $1.74 | 7d | 1 | 0.30mi |
| 3517 Chicago St Dallas, TX | 3.0 | 3.0 | 1538 | $1,200 | $0.78 | 8d | 1 | 0.31mi |
| 1728 McBroom St Dallas, TX | 3.0 | 1.0 | 1027 | $1,695 | $1.65 | 45d | 1 | 0.32mi |
| 3321 Rutz St Dallas, TX | 3.0 | 2.5 | 1436 | $2,550 | $1.78 | 6d | 1 | 0.34mi |
| 1520 McBroom St Dallas, TX | 2.0 | 1.0 | 900 | $1,590 | $1.77 | 45d | 1 | 0.37mi |
| 3226 Navaro St Dallas, TX | 3.0 | 2.0 | 1547 | $2,500 | $1.62 | 45d | 1 | 0.41mi |
| 1907 Nomas St Dallas, TX | 3.0 | 2.0 | 1368 | $2,900 | $2.12 | 20d | 1 | 0.43mi |
| 3015 Chihuahua Ave Unit 1069902P Dallas, TX | 3.0 | 2.0 | 904 | $6,725 | $7.44 | 1d | 1 | 0.56mi |
| 3015 Chihuahua Ave Dallas, TX | 3.0 | 2.0 | 912 | $4,500 | $4.93 | 9d | 1 | 0.56mi |
| 2322 Tan Oak Dr Dallas, TX | 3.0 | 2.5 | 1630 | $2,500 | $1.53 | 45d | 1 | 0.69mi |
| 2901 Borger St Apt 511 Dallas, TX | 2.0 | 2.0 | 1084 | $1,850 | $1.71 | 0d | 1 | 0.75mi |
| 3213 Obenchain St Dallas, TX | 3.0 | 1.0 | 1120 | $1,690 | $1.51 | 45d | 1 | 0.76mi |
| 1010 Singleton Blvd Unit 1043 Dallas, TX | 3.0 | 2.0 | 1581 | $3,127 | $1.98 | 0d | 1 | 0.79mi |
| 1010 Singleton Blvd Unit 1047 Dallas, TX | 2.0 | 2.0 | 990 | $2,327 | $2.35 | 0d | 1 | 0.79mi |
| 996 Singleton Blvd Dallas, TX | 2.0 | 2.0 | 1203 | $1,981 | $1.65 | 4d | 1 | 0.82mi |
| 1130 Tea Olive Ln Dallas, TX | 3.0 | 2.5 | 1751 | $3,000 | $1.71 | 45d | 1 | 0.83mi |
| 1190 Manacor Ln Dallas, TX | 3.0 | 3.5 | 1849 | $2,999 | $1.62 | 14d | 1 | 0.84mi |
| 1115 Manacor Ln Dallas, TX | 3.0 | 2.5 | 1827 | $3,200 | $1.75 | 26d | 1 | 0.85mi |
| 990 Singleton Blvd Dallas, TX | 2.0 | 1.0–2.5 | 942 | $2,235 | $2.37 | 1d | 26 | 0.92mi |
| 941 Bayonne St Unit 939 Dallas, TX | 2.0 | 2.0 | 917 | $1,350 | $1.47 | 6d | 1 | 0.94mi |
| 941 Bayonne St Unit 941 Dallas, TX | 2.0 | 2.0 | 917 | $1,295 | $1.41 | 20d | 1 | 0.94mi |
| 4043 Gray Oak Pl Dallas, TX | 3.0 | 2.0 | 1152 | $1,999 | $1.74 | 18d | 1 | 1.03mi |
| 4043 Gray Oak Pl Dallas, TX | 3.0 | 2.0 | 1152 | $2,100 | $1.82 | 45d | 1 | 1.03mi |
| 1293 Clifftop Ln Dallas, TX | 2.0 | 2.5 | 1411 | $2,900 | $2.06 | 45d | 1 | 1.14mi |
| 320 Singleton Blvd Dallas, TX | 2.0 | 1.0–2.0 | 874 | $2,069 | $2.37 | 0d | 15 | 1.24mi |
| 120 Turtle Creek Blvd Dallas, TX | 2.0 | 1.0–2.0 | 920 | $2,203 | $2.39 | 0d | 28 | 1.24mi |
| 3386 Peyton Lila Rd Dallas, TX | 4.0 | 2.5 | 1739 | $2,350 | $1.35 | 45d | 1 | 1.28mi |
| 455 W Commerce St Dallas, TX | 2.0 | 2.0 | 1121 | $1,810 | $1.61 | 22d | 1 | 1.35mi |
| 455 W Commerce St Dallas, TX | 2.0 | 2.0 | 1121 | $1,810 | $1.61 | 21d | 1 | 1.35mi |
| 718 Fort Worth Ave Dallas, TX | 3.0 | 3.0 | 1452 | $2,672 | $1.84 | 24d | 1 | 1.37mi |
| 718 Fort Worth Ave Dallas, TX | 2.0 | 2.0 | 1163 | $2,026 | $1.74 | 21d | 1 | 1.37mi |
| 718 Fort Worth Ave Dallas, TX | 2.0 | 2.0 | 1163 | $2,026 | $1.74 | 14d | 1 | 1.37mi |
| 718 Fort Worth Ave Dallas, TX | 3.0 | 3.0 | 1452 | $2,672 | $1.84 | 14d | 1 | 1.37mi |
| 431 W Commerce St Dallas, TX | 2.0 | 1.0 | 1037 | $2,568 | $2.48 | 26d | 1 | 1.37mi |
| 710 Fort Worth Ave Dallas, TX | 2.0 | 2.0 | 1122 | $1,479 | $1.32 | 45d | 1 | 1.37mi |
Listing history 26 events
-
2026-06-21days on market $699,000 Active 39 DOM
-
2026-06-18days on market $699,000 Active 36 DOM
-
2026-06-17days on market $699,000 Active 35 DOM
-
2026-06-16days on market $699,000 Active 34 DOM
-
2026-06-15days on market $699,000 Active 33 DOM
-
2026-06-13days on market $699,000 Active 31 DOM
-
2026-06-09days on market $699,000 Active 27 DOM
-
2026-06-08days on market $699,000 Active 26 DOM
-
2026-06-07days on market $699,000 Active 25 DOM
-
2026-06-04days on market $699,000 Active 22 DOM
-
2026-06-03days on market $699,000 Active 21 DOM
-
2026-06-02days on market $699,000 Active 20 DOM
-
2026-06-01days on market $699,000 Active 19 DOM
-
2026-05-31days on market $699,000 Active 18 DOM
-
2026-05-14price $699,000 1206-char remark
-
2026-05-14price $750,000 1206-char remark
-
2026-05-14$819,000 Active 1206-char remark
-
2026-05-13historical
-
2026-03-25$699,000 Active
-
2026-03-25historical
-
2026-02-09price $724,800
-
2025-11-17$724,900 Active
-
2025-11-16historical
-
2025-11-06price $755,000
-
2025-08-08$759,000 Active
-
2024-12-31soldstatus
ⓘ Source: listings_history table (triggers on properties + properties_extension) + one-shot
backfill from property_details.listing_events for pre-trigger history.
Tax reassessment forecast TX · Resets to sale price
- Current annual tax
- $2,604 · $217/mo
- Projected year-2 tax
- $12,792 · $1,066/mo
- Expected delta
- +$10,188/yr (+$849/mo · 391.2%)
ⓘ Screening estimate from a state-policy table — verify with the county assessor before closing.
Nearby sold comps map
Loading sold comps map…
Walkable amenities ~0.75 mi
Loading nearby amenities…
Taxation est. · year 1
- Rental income
- $26,879
- − Mortgage interest
- −$39,155
- − Property taxes
- −$2,604
- − Insurance
- −$3,495
- − Repairs & maintenance
- −$2,150
- − Management
- −$2,150
- − Depreciation
- −$20,335
- Taxable loss
- −$43,010
- Est. tax savings @ 24.0%
- +$10,322
- After-tax cash flow
- $-18,530/yr
For passive investors: Depreciation is non-cash, so a rental often shows a tax loss while cash-flowing — sheltering income. Rental losses are passive: they offset passive income freely, and up to $25,000/yr can offset ordinary (W-2) income if you actively participate and your MAGI is under $100k (phasing out to $0 by $150k); unused losses carry forward. On sale, claimed depreciation is recaptured at up to 25%, and gains may owe capital-gains tax (a 1031 exchange can defer both). Figures are a year-1 estimate at your 24.0% rate — not tax advice; consult a CPA.
Schools (NCES district)
- District
- Dallas ISD
- NCES district ID
- 4816230
- Math proficiency
- 31% ▼ -16.00%
- Reading proficiency
- 36% ▼ -4.00%
- Median HH income
- $42,881
- Composite
- 28.41/100
- National rank
- #6763
- State rank
- #559 of 826 in TX
Livability — Dallas
- Score
- 81/100
- State rank
- #24
- US rank
- #1380
Category grades
Schools grade is shown separately in the Schools card above.
Census & demographics
- Census place
- Dallas, TX
- County
- Dallas County · 2,612,404 people
- City population
- 1,168,437
- Metro
- Dallas-Fort Worth-Arlington, TX
- Population (ZIP)
- 28,259
- Household income
- $59,750
- Rent vs Own
- Severe rent burden
- 892.0
Population outlook (Dallas County) Hauer SSP2
- Today (2025)
- 2,979,839 people
- By 2030
- 3,191,823 · +7.1%
- By 2040
- 3,619,611 · +21.5%
- By 2050
- 4,026,915 · +35.1%
- By 2075
- 4,957,073 · +66.4%
- By 2100
- 5,508,725 · +84.9%
Race, ethnicity, and origin ACS 2023
- Neighborhood character
- Predominantly Hispanic (67%)
- Race & ethnicity
- Hispanic / Latino 67% Two or more races 26% Black 23% White 6% Asian 2%
- Hispanic origin (detail)
- Mexican 55%
- Common ancestry
- Slovak 1%
- Foreign-born
- 27% · Canada, Vietnam, Jamaica
- Languages at home
- 42% English-only · Spanish 52% Vietnamese 1%
Political lean MEDSL · Dallas
- 2024 margin
- Strong D (+22.2) · D 60.2% · R 38.0% · Other 1.8%
- 2008→2024 swing
- +6.9pp toward D · 2008: 15.3pp · 2024: 22.2pp
- All cycles
- 2024: D+22.2 2020: D+31.6 2016: D+26.2 2012: D+15.4 2008: D+15.3
Not yet ingested
- Civics
- —
Market trends
- HPI YoY
- ▲ 138.69%
- Current HPI
- 477.2035
- Rent YoY
- ▼ -4.21%
- Metro
- Dallas-Fort Worth-Arlington, TX
- State GDP YoY
- ▲ 3.95%
- F500 in state
- 110
Industry mix (Fortune 500 HQ in TX)
| Industry | F500 HQs | Revenue |
|---|---|---|
| Energy | 16 | $1,198B |
|
||
| Technology | 5 | $198B |
|
||
| Engineering / Construction | 4 | $72B |
|
||
| Energy Services | 3 | $60B |
|
||
| Utilities | 3 | $41B |
|
||
| Healthcare | 2 | $330B |
|
||
Price history
-99.4% since first listed13 events — show timeline
- 2026-05-27 Listed for Rent $4,800 NTREIS
- 2026-05-14 Price Changed $699,000 NTREIS
- 2026-05-14 Price Changed $750,000 NTREIS
- 2026-05-14 Listed $819,000 NTREIS
- 2026-05-13 Listing Removed — NTREIS
- 2026-03-25 Listing Removed — NTREIS
- 2026-03-25 Listed $699,000 NTREIS
- 2026-02-09 Price Changed $724,800 NTREIS
- 2025-11-17 Listed $724,900 NTREIS
- 2025-11-16 Listing Removed — NTREIS
- 2025-11-06 Price Changed $755,000 NTREIS
- 2025-08-08 Listed $759,000 NTREIS
- 2024-12-31 Sold (Public Records) — Public Records
Property tax history
+2.3%/yrLatest (2025): $2,604 · -70.9% YoY. Source: county tax records.
Cash-flow waterfall
monthlySold comps — $/sqft
last 12 mo · ≤1 miLoading sold comps…