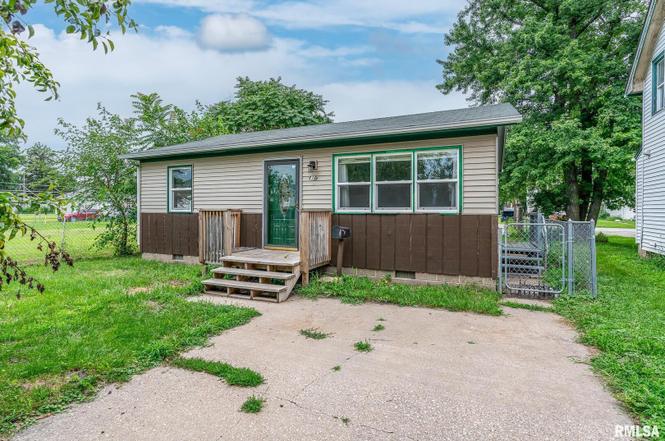
815 21st St · East Moline, IL
Flood risk 1/10 · Minimal
- FEMA flood zone
- X
- Chance of flooding over 30 yrs
- 0.0%
- Est. flood insurance / yr
- $507 – $1,088
Fire risk 1/10 · Minimal
- Est. fire insurance / yr
- $804 – $1,492
Heat risk 3/10 · Minor
- Hot days now (above 104°F)
- 7 days/yr
- Hot days in 30 yrs
- 17 days/yr
Wind risk 2/10 · Minimal
- Chance of severe wind over 30 yrs
- —
Air-quality risk 3/10 · Minor
- Unhealthy air days now
- 2 days/yr
- Unhealthy air days in 30 yrs
- 3 days/yr
Risk factors via First Street. Map © Google.
Why this score? — see what drove the B grade
The composite is a weighted blend of 9 inputs, each scored 0–100. Each bar is that input's sub-score; the figure is the points it added to the 100-point composite (weight × sub-score).
- Cash flow +27.5/30.0
- ARV discount +15.0/15.0
- DSCR +9.7/10.0
- 1% rule +8.7/10.0
- Livability +3.1/5.0
- Rent growth +2.5/5.0
- Condition / age +2.5/5.0
- Schools +1.2/10.0
- Appreciation +0.0/10.0
$70,000
🖨 Deal sheet (PDF) 📄 Offer letter ✓ Due diligence
Listing remarks
Cute & Cozy 2-Bedroom Ranch - All on One Level! Welcome to this charming 2-bedroom, 1-bath home offering convenient single-level living. Inside, you'll find a warm and inviting layout that's perfect for easy living. The fenced backyard provides a private outdoor space for pets, gardening, or entertaining. A standout feature is the oversized 20x20 workshop, which could easily be converted back into a garage, transformed into a man cave, hobby space, or extra storage with a little TLC. This home is being sold as-is, and per the seller, the water heater is only 4 years old, giving you peace of mind for one of the major systems. Whether you're looking for a starter home, downsizing, or an
Key facts
- Single level living
- Fenced backyard
- Oversized workshop
Tags
Neighborhood map
What this means for you Summary
Snapshot
- This is a 2-bed/1.0-bath single-family listed at $70k.
Deal economics
- At list price, monthly cash flow is $208 ($2k/yr) — positive.
- The deal already cash-flows at list — no discount required.
- Meets the 1% rule at list price ($958 rent vs $70k).
- Cap rate 9.9% vs local median 3.5% in East Moline — top-decile yield for the area; either an underpriced asset or a hidden risk that comps aren't pricing in. Stress-test before assuming the spread holds.
Location & tenants
- Location reads 62/100 on livability (#870 in IL) — a middle-class / working-renter tenant base. Strengths: cost of living A+, housing A+; Watch: crime C-, employment C-, amenities F.
- United Twp Hsd 30 (suburban): math 12% / reading 15% proficiency, ranked #536 of 620 in IL (top 86%) — low school quality limits family demand, transient renter base, plan for 1-2y turnover.
- Zoned schools: Ridgewood Elem School (math 8% / reading 17%, grade F, #1,371 of 2,056 statewide, top 68%, 413 students, 0% FRL); Glenview Middle School (math 10% / reading 13%, grade F, #571 of 665 statewide, top 86%, 1,150 students, 0% FRL); United Twp High School (math 12% / reading 15%, grade F, #498 of 693 statewide, top 72%, 1,789 students, 0% FRL).
- Market conditions: 126 active listings in the ZIP; 2 comparable units currently listed for rent nearby; 116 units permitted in Rock Island County in 2024 (50 in 5+ unit buildings).
Forward outlook
- Local home prices are declining (-3.0%/yr); year-one equity from $484 of loan paydown is wiped out by about $2k of value loss. Plan a longer hold.
- Rock Island County population projected at -12% by 2050 — secular population decline; favor cash flow + early exit over multi-decade hold.
- At projected returns (-3.0% appreciation + 3.0% rent growth), your $20k cash investment doubles in ~9 years — after that, you're playing with house money.
Negotiation context
- Only 12 days on market — expect competitive offers; lowballing is unlikely to land.
- 10 sale attempts since 21y ago; this cycle's ask is 28% above the opening price — seller raised mid-cycle; expect resistance to lowballs.
Risks & watch-outs
- Watch-outs: property tax is 2.6% of price.
Questions for the listing agent
- Built in 1978 — when were the roof, HVAC, electrical panel, plumbing, and water heater last replaced?
- Property tax is high relative to price — has the assessment been appealed recently, and will the sale trigger a re-assessment?
- Is there a deadline driving the sale (1031 exchange, divorce, estate, relocation)? That informs how much negotiation room exists.
- Schools are F-rated, which usually means shorter tenancies and higher turnover. Who's the typical renter profile here, and what's been the actual vacancy rate?
- What's the average days-on-market for RENTAL listings here right now (not sales)? A rising rental-DOM trend means longer vacancies and softer asking-rent achievability than the comps imply.
- What's the recent tenant-quality profile in this submarket — average credit score on applications, eviction rate, late-payment / NSF rate, and stable-employment percentage? A property-management company in the area should have these aggregated.
- How much new for-sale + rental construction is in the pipeline within 1–3 miles? Heavy new supply typically softens prices + rents 12–24 months out; constrained supply supports both.
Investment metrics
- 1% rule
- 1.37% ✓
- Cap rate
- 9.86%
- Cash-on-cash
- 12.73%
- DSCR
- 1.57
- GRM
- 6.1
CMA / ARV
- ARV (on-the-fly)
- $118,080
- Comps found
- 5
Show comp detail 5 sales within ~0.75 mi
| Address | Dist | Beds/Ba | Sqft | Sold | Price | $/sf | Match |
|---|---|---|---|---|---|---|---|
| 815 21st St | 0.00mi | 2/1.0 | 720 (0%) | 5mo | $70,000 | $97 | 96 |
| 1548 11th Ave | 0.32mi | 2/1.5 | 728 (+1%) | 2mo | $36,500 | $50 | 80 |
| 742 26th St | 0.34mi | 2/1.0 | 672 (-7%) | 3mo | $109,900 | $164 | 71 |
| 344 22nd St | 0.53mi | 2/1.0 | 703 (-2%) | 14mo | $115,000 | $164 | 59 |
| 171 Hero St | 0.64mi | 3/2.0 (+1) | 720 (0%) | 11mo | $126,000 | $175 | 52 |
Match score weights: distance 35% · size 25% · config 20% · recency 20%. Top-matched comps best support the ARV.
Projected returns pro-forma
-3.0% appreciation · 3.0% rent growth · sell at horizon
- IRR
- 2.6%
- Equity multiple
- 1.10×
- Total profit
- $1,952
- Equity at exit
- $10,437
- IRR
- 12.2%
- Equity multiple
- 1.97×
- Total profit
- $18,970
- Equity at exit
- $6,052
Cash invested: $19,600 (down + closing). Projections, not guarantees.
Landlord ↔ Tenant lean methodology
- Overall (STATE)
- 43 Moderately Tenant-Leaning
- State Illinois
- 43 Moderately Tenant-Leaning · D+7
- County
- — inherits STATE
- City
- — inherits STATE
ZIP-level market 61244
- Active inventory
- 126
- Price-to-rent
- 6.1×
Monthly cashflow live
- Estimated rent
- $958 medium interval (Pro) →
- Mortgage (P&I)
- −$367
- Tax from tax record
- −$153 /mo · $1,833/yr
- Insurance
- −$29
- HOA
- −$0
- Vacancy / Maint / Mgmt
- −$201
- Net cashflow
- $208
Break-even live
Sensitivity live
| Price | -10% $248 | -5% $228 | +0% $208 | +5% $188 | +10% $168 |
|---|---|---|---|---|---|
| Rent | -10% $132 | -5% $170 | +0% $208 | +5% $246 | +10% $284 |
| Rate | -1.0pp $243 | -0.5pp $226 | base $208 | +0.5pp $190 | +1.0pp $171 |
UW: 25.0% down · 7.5% · 30yr · 1.5% tax · 5.0% vac · 8.0% maint · 8.0% mgmt
Financing live
Cash to close
- Down payment
- $17,500
- Closing costs
- $2,100
- Reserves months
- —
- Total cash needed
- —
Loan-product check · same deal, 3 products live
Conventional
25% down · 7.5% · 30yr
- Down + closing
- —
- Monthly P&I
- —
- Monthly cashflow
- —
- DSCR
- —
- Eligible?
- —
Personal DTI + credit; lowest rate.
DSCR
20% down · 8.5% · 30yr
- Down + closing
- —
- Monthly P&I
- —
- Monthly cashflow
- —
- DSCR
- —
- Eligible?
- —
No personal income docs; deal must DSCR.
Hard money
10% down · 12.0% · 12mo
- Down + closing
- —
- Monthly P&I
- —
- Monthly cashflow
- —
- DSCR
- —
- Eligible?
- —
Short-term bridge; refi at stabilization.
Rent comps 2 comps
| Address | Beds | Baths | Sqft | Rent | $/sqft | DOM | Units | Dist |
|---|---|---|---|---|---|---|---|---|
| 1454 18th St East Moline, IL | 2.0 | 1.5 | 650 | $995 | $1.53 | 22d | 1 | 0.41mi |
| 735 20th Ave Unit 3 East Moline, IL | 2.0 | 1.0 | 690 | $790 | $1.14 | 22d | 1 | 1.22mi |
Listing history 46 events
-
2026-05-24status Pending
-
2026-05-24status Pending
-
2026-05-22status Pending
-
2026-01-26soldstatus $70,000
-
2026-01-23soldstatus $70,000 Closed
-
2026-01-23soldstatus $70,000 Closed
-
2026-01-23soldstatus $70,000 Closed
-
2026-01-23soldstatus $70,000 Closed
-
2026-01-16status Pending
-
2026-01-14historical
-
2026-01-08status Pending
-
2026-01-06historical
-
2026-01-05historical
-
2025-12-29status Pending
-
2025-12-17historical
-
2025-10-08Active
-
2025-08-20status Pending
-
2025-08-19historical
-
2025-08-07price
-
2025-07-18Active
-
2021-08-06historical
-
2021-08-06historical
-
2021-08-06historical
-
2021-08-06historical
-
2021-08-06historical
-
2020-06-03soldstatus $54,900
-
2020-06-01soldstatus $54,900
-
2020-06-01soldstatus $54,900
-
2019-07-24$54,900
-
2019-07-24$54,900
-
2016-06-08soldstatus $140,600
-
2016-04-21$149,900
-
2009-08-03soldstatus $57,000
-
2009-07-31soldstatus $56,000
-
2009-07-31soldstatus $56,000
-
2009-01-25$58,900
-
2009-01-25$58,900
-
2008-11-30historical
-
2007-06-18soldstatus $53,000
-
2007-06-15soldstatus $53,000
-
2007-06-15soldstatus $53,000
-
2007-04-20$58,900
-
2007-04-20$58,900
-
2006-02-14soldstatus $38,000
-
2006-02-10soldstatus $38,000
-
2005-12-04$42,000
ⓘ Source: listings_history table (triggers on properties + properties_extension) + one-shot
backfill from property_details.listing_events for pre-trigger history.
Tax reassessment forecast IL · Partial reset (capped growth)
- Current annual tax
- $1,833 · $153/mo
- Projected year-2 tax
- $1,833 · $153/mo
- Expected delta
- $0/yr ($0/mo · 0.0%)
ⓘ Screening estimate from a state-policy table — verify with the county assessor before closing.
Climate risk First Street
- Flood 1/10 Low FEMA zone X · 0% chance over 30 yrs
- Wildfire 1/10 Low
- Heat 3/10 Moderate 7 d/yr ≥104°F today · 17 d/yr by 30 yrs out
- Wind 2/10 Low
- Air quality 3/10 Moderate 2 unhealthy d/yr today · 3 by 30 yrs out
Nearby sold comps map
Loading sold comps map…
Walkable amenities ~0.75 mi
Loading nearby amenities…
Taxation est. · year 1
- Rental income
- $11,497
- − Mortgage interest
- −$3,921
- − Property taxes
- −$1,833
- − Insurance
- −$350
- − Repairs & maintenance
- −$920
- − Management
- −$920
- − Depreciation
- −$2,036
- Taxable income
- $1,517
- Est. tax owed @ 24.0%
- −$364
- After-tax cash flow
- $2,131/yr
For passive investors: Depreciation is non-cash, so a rental often shows a tax loss while cash-flowing — sheltering income. Rental losses are passive: they offset passive income freely, and up to $25,000/yr can offset ordinary (W-2) income if you actively participate and your MAGI is under $100k (phasing out to $0 by $150k); unused losses carry forward. On sale, claimed depreciation is recaptured at up to 25%, and gains may owe capital-gains tax (a 1031 exchange can defer both). Figures are a year-1 estimate at your 24.0% rate — not tax advice; consult a CPA.
Schools (NCES district)
- District
- United Twp Hsd 30
- NCES district ID
- 1739870
- Math proficiency
- 12% ▼ -5.00%
- Reading proficiency
- 15% ▼ -6.00%
- Median HH income
- $43,647
- Composite
- 11.91/100
- National rank
- #9670
- State rank
- #536 of 620 in IL
Livability — East Moline
- Score
- 62/100
- State rank
- #870
- US rank
- #16964
Category grades
Schools grade is shown separately in the Schools card above.
Census & demographics
- Census place
- East Moline, IL
- County
- Rock Island County · 103,822 people
- City population
- 23,308
- Metro
- Davenport-Moline-Rock Island, IA-IL
- Population (ZIP)
- 23,308
- Household income
- $63,819
- Rent vs Own
- Severe rent burden
- 746.0
Population outlook (Rock Island County) Hauer SSP2
- Today (2025)
- 140,982 people
- By 2030
- 137,705 · -2.3%
- By 2040
- 130,512 · -7.4%
- By 2050
- 123,841 · -12.2%
- By 2075
- 109,851 · -22.1%
- By 2100
- 90,922 · -35.5%
Race, ethnicity, and origin ACS 2023
- Neighborhood character
- Diverse neighborhood (Simpson 0.62)
- Race & ethnicity
- White 55% Hispanic / Latino 19% Black 18% Two or more races 9% Asian 3%
- Hispanic origin (detail)
- Mexican 17%
- Common ancestry
- English 3% Lithuanian 2% Romanian 2%
- Foreign-born
- 13% · Canada, United Kingdom, Philippines
- Languages at home
- 78% English-only · Spanish 12% French/Haitian/Cajun 3% Other Asian/Pacific 2%
Political lean MEDSL · Rock Island
- 2024 margin
- Lean D (+9.6) · D 53.9% · R 44.4% · Other 1.7%
- 2008→2024 swing
- -15.0pp toward R · 2008: 24.6pp · 2024: 9.6pp
- All cycles
- 2024: D+9.6 2020: D+12.1 2016: D+8.4 2012: D+21.9 2008: D+24.6
Not yet ingested
- Civics
- —
Market trends
- HPI YoY
- ▼ -108.05%
- Current HPI
- 154.4012
- Rent YoY
- —
- Metro
- Davenport-Moline-Rock Island, IA-IL
- State GDP YoY
- ▲ 1.59%
- F500 in state
- 60
Industry mix (Fortune 500 HQ in IL)
| Industry | F500 HQs | Revenue |
|---|---|---|
| Insurance | 4 | $201B |
|
||
| Consumer Goods | 4 | $87B |
|
||
| Industrial Machinery | 3 | $64B |
|
||
| Healthcare | 2 | $55B |
|
||
| Retail / Pharmacy | 1 | $148B |
|
||
| Agriculture / Food | 1 | $86B |
|
||
Price history
+66.7% since first listed46 events — show timeline
- 2026-05-24 Pending — MRED as Distributed by MLS Grid
- 2026-05-24 Pending — MRED as Distributed by MLS Grid
- 2026-05-22 Pending — MRED as Distributed by MLS Grid
- 2026-01-26 Sold (Public Records) $70,000 Public Records
- 2026-01-23 Sold (MLS) $70,000 MRED as Distributed by MLS Grid
- 2026-01-23 Sold (MLS) $70,000 MRED as Distributed by MLS Grid
- 2026-01-23 Sold (MLS) $70,000 MRED as Distributed by MLS Grid
- 2026-01-23 Sold (MLS) $70,000 MRED as Distributed by MLS Grid
- 2026-01-16 Pending — MRED as Distributed by MLS Grid
- 2026-01-14 Listing Removed — MRED as Distributed by MLS Grid
- 2026-01-08 Pending — MRED as Distributed by MLS Grid
- 2026-01-06 Listing Removed — RMLSA as Distributed by MLS Grid
- 2026-01-05 Listing Removed — MRED as Distributed by MLS Grid
- 2025-12-29 Pending — MRED as Distributed by MLS Grid
- 2025-12-17 Listing Removed — MRED as Distributed by MLS Grid
- 2025-10-08 Listed — RMLSA as Distributed by MLS Grid
- 2025-08-20 Pending — RMLSA as Distributed by MLS Grid
- 2025-08-19 Listing Removed — RMLSA as Distributed by MLS Grid
- 2025-08-07 Price Changed — RMLSA as Distributed by MLS Grid
- 2025-07-18 Listed — RMLSA as Distributed by MLS Grid
- 2021-08-06 Listing Removed — RMLSA as Distributed by MLS Grid
- 2021-08-06 Listing Removed — RMLSA as Distributed by MLS Grid
- 2021-08-06 Listing Removed — RMLSA as Distributed by MLS Grid
- 2021-08-06 Listing Removed — RMLSA as Distributed by MLS Grid
- 2021-08-06 Listing Removed — RMLSA as Distributed by MLS Grid
- 2020-06-03 Sold (Public Records) $54,900 Public Records
- 2020-06-01 Sold (MLS) $54,900 RMLSA as Distributed by MLS Grid
- 2020-06-01 Sold (MLS) $54,900 MRED as Distributed by MLS Grid
- 2019-07-24 Listed $54,900 RMLSA as Distributed by MLS Grid
- 2019-07-24 Listed $54,900 MRED as Distributed by MLS Grid
- 2016-06-08 Sold (MLS) $140,600 MRED as Distributed by MLS Grid
- 2016-04-21 Listed $149,900 MRED as Distributed by MLS Grid
- 2009-08-03 Sold (Public Records) $57,000 Public Records
- 2009-07-31 Sold (MLS) $56,000 MRED as Distributed by MLS Grid
- 2009-07-31 Sold (MLS) $56,000 RMLSA as Distributed by MLS Grid
- 2009-01-25 Listed $58,900 MRED as Distributed by MLS Grid
- 2009-01-25 Listed $58,900 RMLSA as Distributed by MLS Grid
- 2008-11-30 Listing Removed — MRED as Distributed by MLS Grid
- 2007-06-18 Sold (Public Records) $53,000 Public Records
- 2007-06-15 Sold (MLS) $53,000 RMLSA as Distributed by MLS Grid
- 2007-06-15 Sold (MLS) $53,000 MRED as Distributed by MLS Grid
- 2007-04-20 Listed $58,900 RMLSA as Distributed by MLS Grid
- 2007-04-20 Listed $58,900 MRED as Distributed by MLS Grid
- 2006-02-14 Sold (Public Records) $38,000 Public Records
- 2006-02-10 Sold (MLS) $38,000 RMLSA as Distributed by MLS Grid
- 2005-12-04 Listed $42,000 RMLSA as Distributed by MLS Grid
Property tax history
+2.3%/yrLatest (2024): $1,833 · +6.3% YoY. Source: county tax records.
Cash-flow waterfall
monthlySold comps — $/sqft
last 12 mo · ≤1 miLoading sold comps…