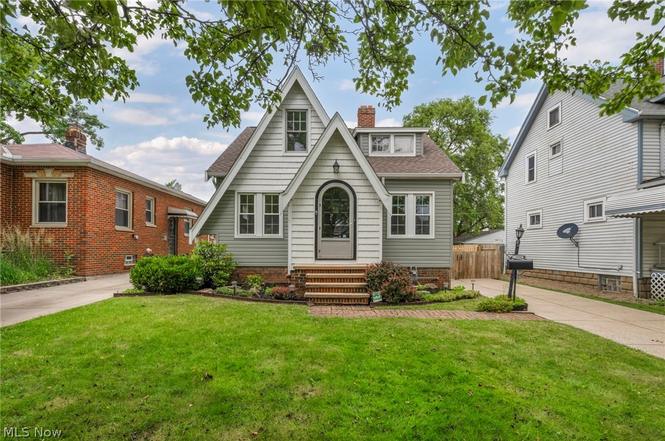
3326 Lincoln Ave · Parma, OH
Flood risk 1/10 · Minimal
- FEMA flood zone
- X (unshaded)
- Chance of flooding over 30 yrs
- 0.0%
- Est. flood insurance / yr
- $473 – $860
Fire risk 1/10 · Minimal
- Est. fire insurance / yr
- $713 – $1,323
Heat risk 3/10 · Minor
- Hot days now (above 95°F)
- 7 days/yr
- Hot days in 30 yrs
- 17 days/yr
Wind risk 1/10 · Minimal
- Chance of severe wind over 30 yrs
- —
Air-quality risk 3/10 · Minor
- Unhealthy air days now
- 2 days/yr
- Unhealthy air days in 30 yrs
- 4 days/yr
Risk factors via First Street. Map © Google.
Why this score? — see what drove the D+ grade
The composite is a weighted blend of 9 inputs, each scored 0–100. Each bar is that input's sub-score; the figure is the points it added to the 100-point composite (weight × sub-score).
- Cash flow +14.0/30.0
- ARV discount +12.5/15.0
- Rent growth +5.0/5.0
- DSCR +4.2/10.0
- Schools +4.1/10.0
- Livability +4.1/5.0
- 1% rule +3.7/10.0
- Condition / age +2.5/5.0
- Appreciation +0.0/10.0
$194,900
🖨 Deal sheet 📄 Offer letter ✓ Due diligence
Listing remarks
Welcome home to this cozy and beautifully updated 4-bedroom, 2-bath residence featuring new carpet, fresh interior paint, and updated light fixtures throughout. The flexible floor plan offers a spacious main-floor bedroom, while three additional upstairs bedrooms are ideal for family, guests, a home office, or extra storage. With two full bathrooms, the layout provides added comfort and convenience for everyday living. The bright, inviting interior is move-in ready, and the washer and dryer are included. Step outside to enjoy the fully fenced backyard with a privacy fence—perfect for entertaining, pets, or relaxing outdoors. Conveniently located near shopping, dining, parks, schools,
Key facts
- New carpet
- Flexible floor plan
- Fresh interior paint
Tags
Property features AI
Exterior
- Parking: Detached garage; Two garage spaces
- Utilities: Public water; Public sewer
- Home design: Two-story home; Home warranty included
- Construction: Frame construction with vinyl siding; Asphalt/fiberglass roof; Concrete perimeter foundation; Built according to public records
- Exterior features: Privacy fencing enclosing the yard; Shed(s) on the property
Interior
- Kitchen: Range; Refrigerator; Eat-in kitchen
- Bedrooms: One main-level bedroom
- Bathrooms: Two full bathrooms; One bathroom on the main level
- Heating & cooling: Hot water heating; Radiator/steam heating; Ceiling fans; Window air conditioning unit(s)
- Interior features: Ceiling fans; Entrance foyer; Eat-in kitchen; Recessed lighting; Full basement with partial finishing and storage space; One fireplace
- Laundry & utility: Washer; Dryer
Neighborhood map
What this means for you Summary
Snapshot
- This is a 3-bed/1.0-bath single-family listed at $195k.
Deal economics
- At list price, monthly cash flow is $23 ($282/yr) — positive.
- The deal already cash-flows at list — no discount required.
- To meet the 1% rule (rent ≥ 1% of price), the offer needs to be $169k (13.4% below list).
- Recommended offer: $169k (13.4% below list) — sets the bar for 1% rule.
- Cap rate 6.4% vs local median 5.0% in Parma — meaningfully above typical; check what's discounted (condition, days-on-market, listing class) to confirm the premium yield is real.
Location & tenants
- Location reads 82/100 on livability (#84 in OH, #1,232 nationally) — a professional / high-income tenant draw. Strengths: crime A+, amenities A+, cost of living A+; Watch: employment C-, commute F.
- Parma City (suburban): math 43% / reading 52% proficiency, ranked #469 of 656 in OH (top 72%) — families likely to look elsewhere, expect single-tenant / working-renter base with shorter leases.
- Market conditions: Rents rising fast (+10.6%/yr); 118 active listings in the ZIP; 14 comparable units currently listed for rent nearby; rentals at typical pace (median 24d on market — plan ~3-4 weeks tenant-placement turnaround); 1,441 units permitted in Cuyahoga County in 2024 (700 in 5+ unit buildings).
Forward outlook
- Local home prices are declining (-3.0%/yr); year-one equity from $1k of loan paydown is wiped out by about $6k of value loss. Plan a longer hold.
- Cuyahoga County population projected to shrink 8% by 2050 — rents likely to lag national; underwrite the cash flow, not the appreciation.
Negotiation context
- Only 1 days on market — expect competitive offers; lowballing is unlikely to land.
- Current owner paid $102k; list at $195k implies a 91% gain — meaningful room to come down on a strong offer.
Risks & watch-outs
- Watch-outs: built in 1935 — expect roof / HVAC / electrical / plumbing capex.
Questions for the listing agent
- Built in 1935 — when were the roof, HVAC, electrical panel, plumbing, and water heater last replaced?
- Is there a deadline driving the sale (1031 exchange, divorce, estate, relocation)? That informs how much negotiation room exists.
- Schools are B-rated — typically a magnet for longer-tenancy family renters. What's the average tenant stay here, and is there a school-zone premium baked into asking?
- The area grade is low — what's the realistic commute time and amenity access for the typical tenant pool here? Any planned neighborhood developments (good or bad) we should know about?
- What's the average days-on-market for RENTAL listings here right now (not sales)? A rising rental-DOM trend means longer vacancies and softer asking-rent achievability than the comps imply.
- What's the recent tenant-quality profile in this submarket — average credit score on applications, eviction rate, late-payment / NSF rate, and stable-employment percentage? A property-management company in the area should have these aggregated.
- How much new for-sale + rental construction is in the pipeline within 1–3 miles? Heavy new supply typically softens prices + rents 12–24 months out; constrained supply supports both.
Investment metrics
- 1% rule
- 0.87% ✗
- Cap rate
- 6.44%
- Cash-on-cash
- 0.52%
- DSCR
- 1.02
- GRM
- 9.6
CMA / ARV
- ARV (on-the-fly)
- $219,118
- Comps found
- 12
Show comp detail 12 sales within ~0.75 mi
| Address | Dist | Beds/Ba | Sqft | Sold | Price | $/sf | Match |
|---|---|---|---|---|---|---|---|
| 3423 Russell Ave | 0.08mi | 3/2.0 | 1,232 (+0%) | 0mo | $205,000 | $166 | 92 |
| 3908 Kenmore Ave | 0.49mi | 3/1.5 | 1,242 (+1%) | 0mo | $151,000 | $122 | 73 |
| 2902 Marmore Ave | 0.36mi | 4/2.0 (+1) | 1,236 (+0%) | 1mo | $230,000 | $186 | 73 |
| 2819 Tuxedo Ave | 0.26mi | 3/1.5 | 1,104 (-10%) | 1mo | $197,000 | $178 | 68 |
| 3810 Russell Ave | 0.23mi | 3/2.0 | 1,088 (-12%) | 0mo | $189,900 | $175 | 66 |
| 2506 Torrington Ave | 0.45mi | 4/2.0 (+1) | 1,200 (-2%) | 0mo | $230,000 | $192 | 65 |
| 4312 Kenmore Ave | 0.56mi | 2/1.0 (-1) | 1,255 (+2%) | 1mo | $130,000 | $104 | 65 |
| 3111 Tuxedo Ave | 0.14mi | 3/2.0 | 1,050 (-15%) | 1mo | $230,000 | $219 | 65 |
| 5271 W 49th St | 0.62mi | 3/1.0 | 1,147 (-7%) | 1mo | $210,000 | $183 | 59 |
| 2436 Tuxedo Ave | 0.43mi | 3/1.5 | 1,064 (-14%) | 1mo | $220,000 | $207 | 54 |
| 4911 Tuxedo Ave | 0.64mi | 3/2.0 | 1,336 (+8%) | 0mo | $220,000 | $165 | 52 |
| 4606 Lincoln Ave | 0.51mi | 3/2.0 | 1,070 (-13%) | 1mo | $184,700 | $173 | 49 |
Match score weights: distance 35% · size 25% · config 20% · recency 20%. Top-matched comps best support the ARV.
Projected returns pro-forma
-3.0% appreciation · 8.0% rent growth · sell at horizon
- IRR
- -10.2%
- Equity multiple
- 0.61×
- Total profit
- $-21,168
- Equity at exit
- $29,060
- IRR
- 4.9%
- Equity multiple
- 1.44×
- Total profit
- $24,088
- Equity at exit
- $16,851
Cash invested: $54,572 (down + closing). Projections, not guarantees.
Landlord ↔ Tenant lean methodology
- Overall (STATE)
- 73 Landlord-Friendly
- State Ohio
- 73 Landlord-Friendly · R+6
- County
- — inherits STATE
- City
- — inherits STATE
ZIP-level market 44134
- Rents YoY
- 10.6%
- Active inventory
- 118
- Price-to-rent
- 9.6×
Monthly cashflow live
- Estimated rent
- $1,687 high interval (Pro) →
- Mortgage (P&I)
- −$1,022
- Tax from tax record
- −$206 /mo · $2,475/yr
- Insurance
- −$81
- HOA
- −$0
- Vacancy / Maint / Mgmt
- −$354
- Net cashflow
- $23
Break-even live
UW: 25.0% down · 7.5% · 30yr · 1.5% tax · 5.0% vac · 8.0% maint · 8.0% mgmt
Financing live
Cash to close
- Down payment
- $48,725
- Closing costs
- $5,847
- Reserves months
- —
- Total cash needed
- —
Loan-product check · same deal, 3 products live
Conventional
25% down · 7.5% · 30yr
- Down + closing
- —
- Monthly P&I
- —
- Monthly cashflow
- —
- DSCR
- —
- Eligible?
- —
Personal DTI + credit; lowest rate.
DSCR
20% down · 8.5% · 30yr
- Down + closing
- —
- Monthly P&I
- —
- Monthly cashflow
- —
- DSCR
- —
- Eligible?
- —
No personal income docs; deal must DSCR.
Hard money
10% down · 12.0% · 12mo
- Down + closing
- —
- Monthly P&I
- —
- Monthly cashflow
- —
- DSCR
- —
- Eligible?
- —
Short-term bridge; refi at stabilization.
Rent comps 14 comps
| Address | Beds | Baths | Sqft | Rent | $/sqft | DOM | Units | Dist |
|---|---|---|---|---|---|---|---|---|
| 3330 Fortune Ave Cleveland, OH | 3.0 | 1.5 | 1258 | $1,775 | $1.41 | 43d | 1 | 0.17mi |
| 3027 Fortune Ave Unit 2 Parma, OH | 2.0 | 1.0 | 726 | $1,150 | $1.58 | 43d | 1 | 0.24mi |
| 3027 Fortune Ave Unit 1 Parma, OH | 2.0 | 1.0 | 880 | $1,175 | $1.34 | 43d | 1 | 0.24mi |
| 2910 Fortune Ave Cleveland, OH | 2.0 | 1.0 | 744 | $1,775 | $2.39 | 23d | 1 | 0.27mi |
| 2716 Lincoln Ave Unit 1288912P Parma, OH | 4.0 | 2.0 | 1205 | $4,125 | $3.42 | 7d | 1 | 0.30mi |
| 2611 Brookdale Ave Cleveland, OH | 3.0 | 1.0 | 1092 | $1,825 | $1.67 | 43d | 1 | 0.37mi |
| 5220 W 44th St #2 Parma, OH | 2.0 | 1.0 | 1156 | $1,400 | $1.21 | 23d | 1 | 0.49mi |
| 4606 Lincoln Ave Cleveland, OH | 3.0 | 2.0 | 1418 | $1,995 | $1.41 | 1d | 1 | 0.49mi |
| 5252 W 45th St Unit 1496134P Parma, OH | 3.0 | 2.0 | 1065 | $5,388 | $5.06 | 14d | 1 | 0.50mi |
| 2907 Snow Rd Unit up Parma, OH | 3.0 | 1.0 | 1026 | $1,700 | $1.66 | 43d | 1 | 0.67mi |
| 5406 Merkle Ave Cleveland, OH | 2.0 | 1.0 | 946 | $1,300 | $1.37 | 4d | 1 | 0.83mi |
| 5406 Merkle Ave Cleveland, OH | 2.0 | 1.0 | 958 | $1,300 | $1.36 | 7d | 1 | 0.83mi |
| 6007 Merkle Ave Unit Down Parma, OH | 3.0 | 1.0 | 1250 | $1,399 | $1.12 | 1d | 1 | 1.01mi |
| 6505 Snow Rd Unit REAR Parma, OH | 3.0 | 1.5 | 1312 | $1,599 | $1.22 | 7d | 1 | 1.28mi |
Listing history 2 events
-
2026-06-18remarks 693-char remark
-
2026-06-18$194,900 Active 1 DOM
ⓘ Source: listings_history table (triggers on properties + properties_extension) + one-shot
backfill from property_details.listing_events for pre-trigger history.
Tax reassessment forecast OH · Partial reset (capped growth)
- Current annual tax
- $2,475 · $206/mo
- Projected year-2 tax
- $2,758 · $230/mo
- Expected delta
- +$283/yr (+$24/mo · 11.4%)
ⓘ Screening estimate from a state-policy table — verify with the county assessor before closing.
Climate risk First Street
- Flood 1/10 Low FEMA zone X (unshaded) · 0% chance over 30 yrs
- Wildfire 1/10 Low
- Heat 3/10 Moderate 7 d/yr ≥95°F today · 17 d/yr by 30 yrs out
- Wind 1/10 Low
- Air quality 3/10 Moderate 2 unhealthy d/yr today · 4 by 30 yrs out
Nearby sold comps map
Loading sold comps map…
Walkable amenities ~0.75 mi
Loading nearby amenities…
Taxation est. · year 1
- Rental income
- $20,248
- − Mortgage interest
- −$10,917
- − Property taxes
- −$2,475
- − Insurance
- −$974
- − Repairs & maintenance
- −$1,620
- − Management
- −$1,620
- − Depreciation
- −$5,670
- Taxable loss
- −$3,028
- Est. tax savings @ 24.0%
- +$727
- After-tax cash flow
- $1,008/yr
For passive investors: Depreciation is non-cash, so a rental often shows a tax loss while cash-flowing — sheltering income. Rental losses are passive: they offset passive income freely, and up to $25,000/yr can offset ordinary (W-2) income if you actively participate and your MAGI is under $100k (phasing out to $0 by $150k); unused losses carry forward. On sale, claimed depreciation is recaptured at up to 25%, and gains may owe capital-gains tax (a 1031 exchange can defer both). Figures are a year-1 estimate at your 24.0% rate — not tax advice; consult a CPA.
Schools (NCES district)
- District
- Parma City
- NCES district ID
- 3904463
- Math proficiency
- 43% ▼ -18.00%
- Reading proficiency
- 52% ▼ -10.00%
- Median HH income
- $50,371
- Composite
- 40.72/100
- National rank
- #3662
- State rank
- #469 of 656 in OH
Livability — Parma
- Score
- 82/100
- State rank
- #84
- US rank
- #1232
Category grades
Schools grade is shown separately in the Schools card above.
Census & demographics
- Census place
- Parma, OH
- County
- Cuyahoga County · 1,090,369 people
- City population
- 66,574
- Metro
- Cleveland-Elyria, OH
- Population (ZIP)
- 37,774
- Household income
- $68,625
- Rent vs Own
- Severe rent burden
- 668.0
Population outlook (Cuyahoga County) Hauer SSP2
- Today (2025)
- 1,244,621 people
- By 2030
- 1,230,093 · -1.2%
- By 2040
- 1,189,108 · -4.5%
- By 2050
- 1,145,706 · -7.9%
- By 2075
- 1,076,557 · -13.5%
- By 2100
- 978,987 · -21.3%
Race, ethnicity, and origin ACS 2023
- Neighborhood character
- Predominantly White (85%)
- Race & ethnicity
- White 85% Two or more races 6% Hispanic / Latino 5% Black 3% Asian 3%
- Common ancestry
- Romanian 14% Subsaharan African 6% Slovak 1%
- Foreign-born
- 11% · Canada, Vietnam
- Languages at home
- 84% English-only · Russian/Polish/Slavic 7% Spanish 3% Other Indo-European 2%
Political lean MEDSL · Cuyahoga
- 2024 margin
- Solid D (+31.5) · D 65.4% · R 33.9%
- 2008→2024 swing
- -7.4pp toward R · 2008: 38.9pp · 2024: 31.5pp
- All cycles
- 2024: D+31.5 2020: D+34.1 2016: D+35.0 2012: D+38.7 2008: D+38.9
Not yet ingested
- Civics
- —
Market trends
- HPI YoY
- ▼ -215.17%
- Current HPI
- 184.0553
- Rent YoY
- ▲ 10.56%
- Metro
- Cleveland-Elyria, OH
- State GDP YoY
- ▲ 1.98%
- F500 in state
- 48
Industry mix (Fortune 500 HQ in OH)
| Industry | F500 HQs | Revenue |
|---|---|---|
| Insurance | 3 | $145B |
|
||
| Industrial Machinery | 3 | $49B |
|
||
| Financial Services | 3 | $24B |
|
||
| Consumer Goods | 2 | $93B |
|
||
| Aerospace / Defense | 2 | $47B |
|
||
| Utilities | 2 | $33B |
|
||
Price history
+464.9% since first listed4 events — show timeline
- 2026-06-18 Listed $194,900 MLSNOW
- 2002-08-15 Sold (Public Records) $102,000 Public Records
- 1997-07-30 Sold (Public Records) $94,900 Public Records
- 1976-08-01 Sold (Public Records) $34,500 Public Records
Property tax history
+1.2%/yrLatest (2025): $2,475 · -5.6% YoY. Source: county tax records.
Cash-flow waterfall
monthlySold comps — $/sqft
last 12 mo · ≤1 miLoading sold comps…