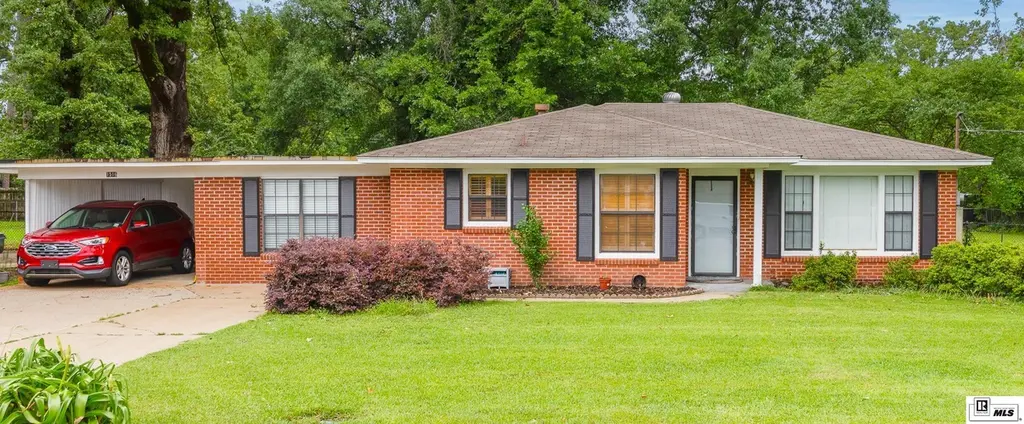
1516 Cedar St · West Monroe, LA
Flood risk 1/10 · Minimal
- FEMA flood zone
- X (unshaded)
- Chance of flooding over 30 yrs
- 0.0%
- Est. flood insurance / yr
- $507 – $1,088
Fire risk 1/10 · Minimal
- Est. fire insurance / yr
- $1,269 – $2,357
Heat risk 7/10 · Major
- Hot days now (above 111°F)
- 7 days/yr
- Hot days in 30 yrs
- 20 days/yr
Wind risk 6/10 · Moderate
- Chance of severe wind over 30 yrs
- 74.0%
Air-quality risk 1/10 · Minimal
- Unhealthy air days now
- 0 days/yr
- Unhealthy air days in 30 yrs
- 0 days/yr
Risk factors via First Street. Map © Google.
Why this score? — see what drove the C grade
The composite is a weighted blend of 9 inputs, each scored 0–100. Each bar is that input's sub-score; the figure is the points it added to the 100-point composite (weight × sub-score).
- Cash flow +19.5/30.0
- ARV discount +15.0/15.0
- DSCR +6.2/10.0
- Rent growth +4.7/5.0
- 1% rule +4.4/10.0
- Livability +3.5/5.0
- Schools +3.2/10.0
- Condition / age +2.5/5.0
- Appreciation +0.0/10.0
$160,000
🖨 Deal sheet 📄 Offer letter ✓ Due diligence
Listing remarks MLS
Neat as a Pin! Come check out this spacious 2/1 Brick home conveniently located in the heart of West Monroe 2 large living areas. huge fenced backyard with a wonderful covered patio and storage building. Large bedrooms, pretty wood and tile floors and so much more!
Key facts
- Versatile den
- Covered back patio
- Fenced-in backyard
Tags
Property features AI
Finance
- Other: Located in the SUNSHINE HGHTS subdivision; Driving directions available to the property
- HOA & community: No association amenities
Exterior
- Parking: Has garage; 1-car garage
- Utilities: Public water; Public sewer; Natural gas available and connected
- Home design: Single-family residence; One story; Entry level is 1; Brick veneer construction; Site-built home
- Construction: Brick veneer exterior; Slab foundation
- Exterior features: Covered patio/porch; Chain link fence; Landscaped and cleared lot; Paved road access; Storage building/structure
Interior
- Kitchen: Gas range; Gas water heater
- Bedrooms: 2 bedrooms on the main level
- Bathrooms: 1 full bathroom
- Heating & cooling: Natural gas heating; Central air conditioning; Ceiling fan(s) for cooling
- Interior features: Ceiling fans; Walk-in closets
Neighborhood map
What this means for you Summary
Snapshot
- This is a 2-bed/1.0-bath single-family listed at $160k.
Deal economics
- At list price, monthly cash flow is $181 ($2k/yr) — positive.
- The deal already cash-flows at list — no discount required.
- To meet the 1% rule (rent ≥ 1% of price), the offer needs to be $150k (6.1% below list).
- Recommended offer: $150k (6.1% below list) — sets the bar for 1% rule.
- Cap rate 7.7% vs local median 5.5% in West Monroe — top-decile yield for the area; either an underpriced asset or a hidden risk that comps aren't pricing in. Stress-test before assuming the spread holds.
Location & tenants
- Location reads 70/100 on livability (#53 in LA) — a middle-class / working-renter tenant base. Strengths: cost of living A+, health & safety A+, housing A; Watch: crime F, commute F, employment F.
- Ouachita Parish (suburban): math 31% / reading 45% proficiency, ranked #26 of 98 in LA (top 26%) — families likely to look elsewhere, expect single-tenant / working-renter base with shorter leases.
- Zoned schools: West Ridge Middle School (math 52% / reading 65%, grade B, #13 of 218 statewide, top 6%, 635 students, 47% FRL); West Monroe High School (math 32% / reading 48%, grade F, #77 of 265 statewide, top 29%, 2,189 students, 58% FRL) — zoned schools at 52% FRL track the district average.
- Market conditions: Rents rising fast (+8.9%/yr); 199 active listings in the ZIP; 4 comparable units currently listed for rent nearby; rentals lingering (median 44d on market — plan ~5-8 weeks vacancy on turnover, expect pricing pressure); 75% of comp listings sitting > 30 days — soft ceiling on asking rent; 345 units permitted in Ouachita Parish in 2024 (0 in 5+ unit buildings).
Forward outlook
- Local home prices are declining (-3.0%/yr); year-one equity from $1k of loan paydown is wiped out by about $5k of value loss. Plan a longer hold.
- At projected returns (-3.0% appreciation + 8.0% rent growth), your $45k cash investment doubles in ~10 years — after that, you're playing with house money.
Negotiation context
- Only 1 days on market — expect competitive offers; lowballing is unlikely to land.
- 2 sale attempts since 6y ago with the ask held roughly flat each time — persistent listings suggest the price (not the market) is what's stuck; bring a comps-based counter.
Risks & watch-outs
- Watch-outs: built in 1950 — expect roof / HVAC / electrical / plumbing capex.
- Climate carrying-cost: major wind risk, 74% chance of damaging wind over 30y; extreme-heat days projected 7→20/yr by 2055 (HVAC capex compounding) — expect insurance premiums to compound above CPI over the hold.
Questions for the listing agent
- Built in 1950 — when were the roof, HVAC, electrical panel, plumbing, and water heater last replaced?
- Is there a deadline driving the sale (1031 exchange, divorce, estate, relocation)? That informs how much negotiation room exists.
- Schools are B-rated — typically a magnet for longer-tenancy family renters. What's the average tenant stay here, and is there a school-zone premium baked into asking?
- Crime grade is F in this area — have there been break-ins, vandalism, or insurance claims at this property in the last 3 years? What carrier currently insures it and at what premium?
- What's the average days-on-market for RENTAL listings here right now (not sales)? A rising rental-DOM trend means longer vacancies and softer asking-rent achievability than the comps imply.
- What's the recent tenant-quality profile in this submarket — average credit score on applications, eviction rate, late-payment / NSF rate, and stable-employment percentage? A property-management company in the area should have these aggregated.
- How much new for-sale + rental construction is in the pipeline within 1–3 miles? Heavy new supply typically softens prices + rents 12–24 months out; constrained supply supports both.
Investment metrics
- 1% rule
- 0.94% ✗
- Cap rate
- 7.65%
- Cash-on-cash
- 4.85%
- DSCR
- 1.22
- GRM
- 8.9
CMA / ARV
- ARV (median comp)
- $194,953
- List price
- $160,000
- Delta
- -17.93%
- Verdict
- UNDERPRICED
- Comps
- 20 within 1.0 mi
Show comp detail 12 sales within ~0.75 mi
| Address | Dist | Beds/Ba | Sqft | Sold | Price | $/sf | Match |
|---|---|---|---|---|---|---|---|
| 1421 Elizabeth St | 0.17mi | 3/1.0 (+1) | 1,410 (-2%) | 13mo | $170,000 | $121 | 72 |
| 130 Tuscany Cir | 0.23mi | 2/2.0 | 1,469 (+2%) | 14mo | $222,000 | $151 | 71 |
| 1517 Elizabeth St | 0.03mi | 3/2.0 (+1) | 1,630 (+13%) | 4mo | $195,000 | $120 | 65 |
| 128 Tuscany Cir | 0.22mi | 2/2.0 | 1,288 (-11%) | 9mo | $202,000 | $157 | 60 |
| 101 Nichols Dr | 0.39mi | 3/1.5 (+1) | 1,377 (-5%) | 14mo | $170,000 | $123 | 55 |
| 120 Orleans Pl | 0.20mi | 3/2.0 (+1) | 1,296 (-10%) | 13mo | $213,000 | $164 | 54 |
| 1018 Ridge Ave | 0.68mi | 3/2.0 (+1) | 1,500 (+4%) | 5mo | $195,000 | $130 | 48 |
| 615 Nichols Pl | 0.53mi | 3/2.0 (+1) | 1,360 (-6%) | 10mo | $215,000 | $158 | 48 |
| 1010 Audubon Ave | 0.51mi | 3/1.5 (+1) | 1,266 (-12%) | 2mo | $188,000 | $148 | 47 |
| 602 Nichols Pl | 0.53mi | 3/2.0 (+1) | 1,280 (-12%) | 3mo | $212,500 | $166 | 44 |
| 1106 Otis St | 0.48mi | 3/2.0 (+1) | 1,654 (+14%) | 6mo | $298,500 | $180 | 40 |
| 101 Clay St | 0.41mi | 3/2.0 (+1) | 1,254 (-13%) | 15mo | $224,900 | $179 | 37 |
Match score weights: distance 35% · size 25% · config 20% · recency 20%. Top-matched comps best support the ARV.
Projected returns pro-forma
-3.0% appreciation · 8.0% rent growth · sell at horizon
- IRR
- -3.7%
- Equity multiple
- 0.86×
- Total profit
- $-6,479
- Equity at exit
- $23,857
- IRR
- 10.7%
- Equity multiple
- 2.01×
- Total profit
- $45,219
- Equity at exit
- $13,834
Cash invested: $44,800 (down + closing). Projections, not guarantees.
Landlord ↔ Tenant lean methodology
- Overall (STATE)
- 90 Strongly Landlord-Friendly
- State Louisiana
- 90 Strongly Landlord-Friendly · R+12
- County
- — inherits STATE
- City
- — inherits STATE
ZIP-level market 71291
- Home prices YoY
- -30.2%
- Rents YoY
- 8.9%
- Active inventory
- 199
- Price-to-rent
- 8.9×
Monthly cashflow live
- Estimated rent
- $1,503 medium interval (Pro) →
- Mortgage (P&I)
- −$839
- Tax from tax record
- −$100 /mo · $1,206/yr
- Insurance
- −$67
- HOA
- −$0
- Vacancy / Maint / Mgmt
- −$316
- Net cashflow
- $181
Break-even live
UW: 25.0% down · 7.5% · 30yr · 1.5% tax · 5.0% vac · 8.0% maint · 8.0% mgmt
Financing live
Cash to close
- Down payment
- $40,000
- Closing costs
- $4,800
- Reserves months
- —
- Total cash needed
- —
Loan-product check · same deal, 3 products live
Conventional
25% down · 7.5% · 30yr
- Down + closing
- —
- Monthly P&I
- —
- Monthly cashflow
- —
- DSCR
- —
- Eligible?
- —
Personal DTI + credit; lowest rate.
DSCR
20% down · 8.5% · 30yr
- Down + closing
- —
- Monthly P&I
- —
- Monthly cashflow
- —
- DSCR
- —
- Eligible?
- —
No personal income docs; deal must DSCR.
Hard money
10% down · 12.0% · 12mo
- Down + closing
- —
- Monthly P&I
- —
- Monthly cashflow
- —
- DSCR
- —
- Eligible?
- —
Short-term bridge; refi at stabilization.
Rent comps 4 comps
| Address | Beds | Baths | Sqft | Rent | $/sqft | DOM | Units | Dist |
|---|---|---|---|---|---|---|---|---|
| 1114 Otis St West Monroe, LA | 3.0 | 2.0 | 1304 | $1,595 | $1.22 | 43d | 1 | 0.44mi |
| 112 Fairlane Dr Unit 8 West Monroe, LA | 2.0 | 2.0 | 1050 | $1,600 | $1.52 | 20d | 1 | 0.58mi |
| 202 Gross St West Monroe, LA | 3.0 | 1.0 | 1100 | $1,350 | $1.23 | 43d | 1 | 0.64mi |
| 2417 N 9th St West Monroe, LA | 2.0 | 1.0 | 900 | $2,000 | $2.22 | 43d | 1 | 0.66mi |
Listing history 6 events
-
2026-05-03status Pending 764-char remark
-
2026-05-01$160,000 Active 764-char remark
-
2021-02-01soldstatus $122,500
-
2021-01-29soldstatus 267-char remark
Show marketing remark (267 chars)
Neat as a Pin! Come check out this spacious 2/1 Brick home conveniently located in the heart of West Monroe 2 large living areas. huge fenced backyard with a wonderful covered patio and storage building. Large bedrooms, pretty wood and tile floors and so much more!
-
2020-08-21$139,000 267-char remark
Show marketing remark (267 chars)
Neat as a Pin! Come check out this spacious 2/1 Brick home conveniently located in the heart of West Monroe 2 large living areas. huge fenced backyard with a wonderful covered patio and storage building. Large bedrooms, pretty wood and tile floors and so much more!
-
2013-04-23soldstatus
ⓘ Source: listings_history table (triggers on properties + properties_extension) + one-shot
backfill from property_details.listing_events for pre-trigger history.
Tax reassessment forecast LA · Resets to sale price
- Current annual tax
- $1,206 · $100/mo
- Projected year-2 tax
- $1,206 · $100/mo
- Expected delta
- $0/yr ($0/mo · 0.0%)
ⓘ Screening estimate from a state-policy table — verify with the county assessor before closing.
Climate risk First Street
- Flood 1/10 Low FEMA zone X (unshaded) · 0% chance over 30 yrs
- Wildfire 1/10 Low
- Heat 7/10 Severe 7 d/yr ≥111°F today · 20 d/yr by 30 yrs out
- Wind 6/10 Major 74% chance of damaging wind over 30 yrs
- Air quality 1/10 Low 0 unhealthy d/yr today · 0 by 30 yrs out
Nearby sold comps map
Loading sold comps map…
Walkable amenities ~0.75 mi
Loading nearby amenities…
Taxation est. · year 1
- Rental income
- $18,037
- − Mortgage interest
- −$8,962
- − Property taxes
- −$1,206
- − Insurance
- −$800
- − Repairs & maintenance
- −$1,443
- − Management
- −$1,443
- − Depreciation
- −$4,655
- Taxable loss
- −$472
- Est. tax savings @ 24.0%
- +$113
- After-tax cash flow
- $2,288/yr
For passive investors: Depreciation is non-cash, so a rental often shows a tax loss while cash-flowing — sheltering income. Rental losses are passive: they offset passive income freely, and up to $25,000/yr can offset ordinary (W-2) income if you actively participate and your MAGI is under $100k (phasing out to $0 by $150k); unused losses carry forward. On sale, claimed depreciation is recaptured at up to 25%, and gains may owe capital-gains tax (a 1031 exchange can defer both). Figures are a year-1 estimate at your 24.0% rate — not tax advice; consult a CPA.
Schools (NCES district)
- District
- Ouachita Parish
- NCES district ID
- 2201200
- Math proficiency
- 31% ▼ -38.00%
- Reading proficiency
- 45% ▼ -31.00%
- Median HH income
- $43,316
- Composite
- 32.14/100
- National rank
- #5791
- State rank
- #26 of 98 in LA
Livability — West Monroe
- Score
- 70/100
- State rank
- #53
- US rank
- #7498
Category grades
Schools grade is shown separately in the Schools card above.
Census & demographics
- Census place
- West Monroe, LA
- County
- Ouachita Parish · 118,340 people
- City population
- 58,204
- Metro
- Monroe, LA
- Population (ZIP)
- 35,269
- Household income
- $71,639
- Rent vs Own
- Severe rent burden
- 847.0
Population outlook (Ouachita County) Hauer SSP2
- Today (2025)
- 163,370 people
- By 2030
- 165,520 · +1.3%
- By 2040
- 167,652 · +2.6%
- By 2050
- 166,699 · +2.0%
- By 2075
- 156,348 · -4.3%
- By 2100
- 134,102 · -17.9%
Race, ethnicity, and origin ACS 2023
- Neighborhood character
- Predominantly White (78%)
- Race & ethnicity
- White 78% Black 13% Hispanic / Latino 6% Two or more races 3% Asian 1%
- Hispanic origin (detail)
- Mexican 3%
- Common ancestry
- Lithuanian 3% Italian 2% Slovak 1%
- Foreign-born
- 4% · Canada
- Languages at home
- 94% English-only · Spanish 4% Other Indo-European 1%
Political lean MEDSL · Ouachita
- 2024 margin
- Strong R (+27.9) · D 35.5% · R 63.3% · Other 1.2%
- 2008→2024 swing
- -2.7pp toward R · 2008: -25.2pp · 2024: -27.9pp
- All cycles
- 2024: R+27.9 2020: R+23.6 2016: R+25.4 2012: R+20.9 2008: R+25.2
Not yet ingested
- Civics
- —
Market trends
- HPI YoY
- ▼ -95.15%
- Current HPI
- 220.1737
- Rent YoY
- ▲ 8.93%
- Metro
- Monroe, LA
- State GDP YoY
- ▲ 3.29%
- F500 in state
- 10
Industry mix (Fortune 500 HQ in LA)
| Industry | F500 HQs | Revenue |
|---|---|---|
| Telecommunications | 2 | $23B |
|
||
| Utilities | 1 | $12B |
|
||
| Wholesale / Distribution | 1 | $5B |
|
||
| Advertising | 1 | $2B |
|
||
Price history
+21.1% since first listed8 events — show timeline
- 2026-06-05 Sold (Public Records) $168,370 Public Records
- 2026-06-05 Sold (MLS) — NELABOR
- 2026-05-03 Pending — NELABOR
- 2026-05-01 Listed $160,000 NELABOR
- 2021-02-01 Sold (Public Records) $122,500 Public Records
- 2021-01-29 Sold (MLS) — NELABOR
- 2020-08-21 Listed $139,000 NELABOR
- 2013-04-23 Sold (Public Records) — Public Records
Property tax history
+5.5%/yrLatest (2025): $1,206 · +5.8% YoY. Source: county tax records.
Cash-flow waterfall
monthlySold comps — $/sqft
last 12 mo · ≤1 miLoading sold comps…