264 Aylsworth Ave · Woonsocket, RI
Flood risk 1/10 · Minimal
- FEMA flood zone
- X (unshaded)
- Chance of flooding over 30 yrs
- 0.0%
- Est. flood insurance / yr
- $473 – $860
Fire risk 3/10 · Minor
- Est. fire insurance / yr
- $835 – $1,551
Heat risk 4/10 · Minor
- Hot days now (above 95°F)
- 7 days/yr
- Hot days in 30 yrs
- 15 days/yr
Wind risk 6/10 · Moderate
- Chance of severe wind over 30 yrs
- 62.0%
Air-quality risk 2/10 · Minimal
- Unhealthy air days now
- 1 days/yr
- Unhealthy air days in 30 yrs
- 2 days/yr
Risk factors via First Street. Map © Google.
Why this score? — see what drove the B- grade
The composite is a weighted blend of 9 inputs, each scored 0–100. Each bar is that input's sub-score; the figure is the points it added to the 100-point composite (weight × sub-score).
- Cash flow +30.0/30.0
- 1% rule +10.0/10.0
- DSCR +10.0/10.0
- ARV discount +7.5/15.0
- Rent growth +4.8/5.0
- Livability +3.2/5.0
- Condition / age +2.5/5.0
- Schools +0.8/10.0
- Appreciation +0.0/10.0
$75,000
🖨 Deal sheet 📄 Offer letter ✓ Due diligence
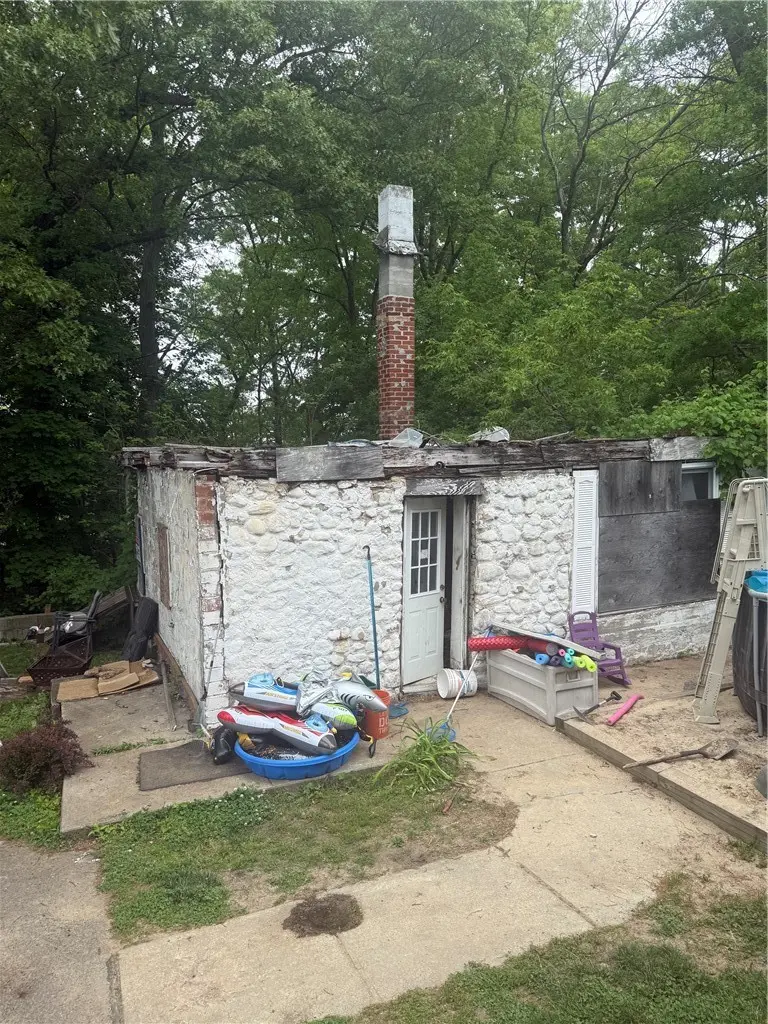
Listing remarks
Ranch style home nestled in the heart of East Woonsocket. This property requires a full rehab but well worth the price to renovate. Buyer to do due diligence and being sold in as is condition. Cash offers only as this property will not qualify for conventional loans. Please submit your highest and best offer by May 31st.
Key facts
- Built 1930
- Listed 26 days
Property features AI
Exterior
- Parking: No garage
- Utilities: Sewer connected; Water connected; Circuit breaker electrical service
- Home design: Single-story; Above-grade finished area approximately 624
- Construction: Masonry construction; Stone foundation; Built on a stone foundation
- Exterior features: Small lot (approximately 0.02 acres)
Interior
- Flooring: Carpet; Laminate
- Bathrooms: 1 full bathroom
- Heating & cooling: Hot water heating; Oil fuel; Has heating
- Interior features: Carpet and laminate flooring; Oil water heater
Neighborhood map
What this means for you Summary
Snapshot
- This is a 2-bed/1.0-bath single-family listed at $75k.
Deal economics
- At list price, monthly cash flow is $876 ($11k/yr) — positive.
- The deal already cash-flows at list — no discount required.
- Meets the 1% rule at list price ($2k rent vs $75k).
- Recommended offer: $74k (1.5% below list) — sets the bar for market timing.
- Cap rate 20.3% vs local median 3.3% in Woonsocket — top-decile yield for the area; either an underpriced asset or a hidden risk that comps aren't pricing in. Stress-test before assuming the spread holds.
Location & tenants
- Location reads 65/100 on livability (#24 in RI) — a middle-class / working-renter tenant base. Strengths: housing A+, health & safety A+, cost of living A; Watch: crime C-, schools D-, amenities F.
- Woonsocket (suburban): math 5% / reading 14% proficiency, ranked #37 of 39 in RI (top 95%) — low school quality limits family demand, transient renter base, plan for 1-2y turnover; 68% free/reduced lunch — lower-income household profile, screen leases tightly.
- Market conditions: Rents rising fast (+9.2%/yr); 163 active listings in the ZIP; 40 comparable units currently listed for rent nearby; rentals at typical pace (median 17d on market — plan ~3-4 weeks tenant-placement turnaround); 776 units permitted in Providence County in 2024 (229 in 5+ unit buildings).
- This rent runs 34% of the median local income ($61k/yr) — at the standard rent-burdened threshold; future hikes will face affordability resistance.
Forward outlook
- Local home prices are declining (-3.0%/yr); year-one equity from $519 of loan paydown is wiped out by about $2k of value loss. Plan a longer hold.
- Providence County population projected at +5% by 2050 — modest demand growth; plan on rents tracking national, not racing it.
- At projected returns (-3.0% appreciation + 8.0% rent growth), your $21k cash investment doubles in ~3 years — after that, you're playing with house money.
Negotiation context
- It's been on market 26 days — a 2% lower offer ($74k) is reasonable based on typical stale-listing flexibility.
- 6 sale attempts since 29y ago with the ask held roughly flat each time — persistent listings suggest the price (not the market) is what's stuck; bring a comps-based counter.
Risks & watch-outs
- Watch-outs: built in 1930 — expect roof / HVAC / electrical / plumbing capex.
- Climate carrying-cost: major wind risk, 62% chance of damaging wind over 30y — expect insurance premiums to compound above CPI over the hold.
Questions for the listing agent
- Built in 1930 — when were the roof, HVAC, electrical panel, plumbing, and water heater last replaced?
- Is there a deadline driving the sale (1031 exchange, divorce, estate, relocation)? That informs how much negotiation room exists.
- Schools are D-rated, which usually means shorter tenancies and higher turnover. Who's the typical renter profile here, and what's been the actual vacancy rate?
- What's the average days-on-market for RENTAL listings here right now (not sales)? A rising rental-DOM trend means longer vacancies and softer asking-rent achievability than the comps imply.
- What's the recent tenant-quality profile in this submarket — average credit score on applications, eviction rate, late-payment / NSF rate, and stable-employment percentage? A property-management company in the area should have these aggregated.
- How much new for-sale + rental construction is in the pipeline within 1–3 miles? Heavy new supply typically softens prices + rents 12–24 months out; constrained supply supports both.
Investment metrics
- 1% rule
- 2.31% ✓
- Cap rate
- 20.31%
- Cash-on-cash
- 50.05%
- DSCR
- 3.23
- GRM
- 3.6
CMA / ARV
- ARV (on-the-fly)
- $356,592
- Comps found
- 4
Show comp detail 4 sales within ~0.75 mi
| Address | Dist | Beds/Ba | Sqft | Sold | Price | $/sf | Match |
|---|---|---|---|---|---|---|---|
| 167 Dana St | 0.51mi | 2/1.0 | 912 (+4%) | 10mo | $350,000 | $384 | 61 |
| 26 Kenwood St | 0.35mi | 2/1.0 | 768 (-12%) | 6mo | $313,500 | $408 | 59 |
| 546 Robinson St | 0.58mi | 2/1.0 | 816 (-7%) | 4mo | $205,000 | $251 | 58 |
| 191 St Barnabe St | 0.73mi | 2/1.0 | 768 (-12%) | 0mo | $320,000 | $417 | 46 |
Match score weights: distance 35% · size 25% · config 20% · recency 20%. Top-matched comps best support the ARV.
Projected returns pro-forma
-3.0% appreciation · 8.0% rent growth · sell at horizon
- IRR
- 53.2%
- Equity multiple
- 3.51×
- Total profit
- $52,780
- Equity at exit
- $11,183
- IRR
- 60.4%
- Equity multiple
- 8.59×
- Total profit
- $159,415
- Equity at exit
- $6,485
Cash invested: $21,000 (down + closing). Projections, not guarantees.
Landlord ↔ Tenant lean methodology
- Overall (STATE)
- 31 Tenant-Leaning
- State Rhode Island
- 31 Tenant-Leaning · D+8
- County
- — inherits STATE
- City
- — inherits STATE
ZIP-level market 02895
- Rents YoY
- 9.2%
- Active inventory
- 163
- Price-to-rent
- 3.6×
Monthly cashflow live
- Estimated rent
- $1,729 high interval (Pro) →
- Mortgage (P&I)
- −$393
- Tax from tax record
- −$65 /mo · $783/yr
- Insurance
- −$31
- HOA
- −$0
- Vacancy / Maint / Mgmt
- −$363
- Net cashflow
- $876
Break-even live
UW: 25.0% down · 7.5% · 30yr · 1.5% tax · 5.0% vac · 8.0% maint · 8.0% mgmt
Financing live
Cash to close
- Down payment
- $18,750
- Closing costs
- $2,250
- Reserves months
- —
- Total cash needed
- —
Loan-product check · same deal, 3 products live
Conventional
25% down · 7.5% · 30yr
- Down + closing
- —
- Monthly P&I
- —
- Monthly cashflow
- —
- DSCR
- —
- Eligible?
- —
Personal DTI + credit; lowest rate.
DSCR
20% down · 8.5% · 30yr
- Down + closing
- —
- Monthly P&I
- —
- Monthly cashflow
- —
- DSCR
- —
- Eligible?
- —
No personal income docs; deal must DSCR.
Hard money
10% down · 12.0% · 12mo
- Down + closing
- —
- Monthly P&I
- —
- Monthly cashflow
- —
- DSCR
- —
- Eligible?
- —
Short-term bridge; refi at stabilization.
Rent comps 40 comps
| Address | Beds | Baths | Sqft | Rent | $/sqft | DOM | Units | Dist |
|---|---|---|---|---|---|---|---|---|
| 166 Newland Ave Unit 3 Woonsocket, RI | 2.0 | 1.0 | 900 | $1,550 | $1.72 | 23d | 1 | 0.20mi |
| 95 Victor St Unit 6 Woonsocket, RI | 3.0 | 1.0 | 900 | $1,775 | $1.97 | 43d | 1 | 0.21mi |
| 968 Elm St Woonsocket, RI | 2.0 | 1.0 | 953 | $1,895 | $1.99 | 43d | 1 | 0.34mi |
| 968 Elm St #2 Woonsocket, RI | 2.0 | 1.0 | 952 | $1,895 | $1.99 | 21d | 1 | 0.34mi |
| 968 Elm St Unit 1 Woonsocket, RI | 2.0 | 1.0 | 952 | $1,995 | $2.10 | 1d | 1 | 0.34mi |
| 1371 Mendon Rd Unit 30 Woonsocket, RI | 1.0 | 1.0 | 650 | $1,850 | $2.85 | 11d | 1 | 0.35mi |
| 1371 Mendon Rd Unit 32 Woonsocket, RI | 1.0 | 1.0 | 650 | $1,850 | $2.85 | 10d | 1 | 0.35mi |
| 1037 Cass Ave Woonsocket, RI | 2.0 | 1.0 | 860 | $1,975 | $2.30 | 1d | 1 | 0.44mi |
| 59 Sweet Ave Woonsocket, RI | 2.0 | 1.0 | 950 | $1,495 | $1.57 | 21d | 1 | 0.49mi |
| 635 Elm St Unit 2F Woonsocket, RI | 2.0 | 1.0 | 800 | $1,800 | $2.25 | 4d | 1 | 0.53mi |
| 1067 Mendon Rd Unit 3 Woonsocket, RI | 1.0 | 1.0 | 710 | $1,750 | $2.46 | 1d | 1 | 0.53mi |
| 1067 Mendon Rd Unit 1 Woonsocket, RI | 2.0 | 1.0 | 831 | $1,975 | $2.38 | 1d | 1 | 0.53mi |
| 51 Wood Ave Unit 1R Woonsocket, RI | 2.0 | 1.0 | 1080 | $1,325 | $1.23 | 23d | 1 | 0.61mi |
| 583 Willow St Woonsocket, RI | 2.0 | 1.0 | 750 | $1,595 | $2.13 | 2d | 1 | 0.62mi |
| 428 Elm St Unit 2nd floor Woonsocket, RI | 3.0 | 1.0 | 1100 | $2,800 | $2.55 | 1d | 1 | 0.63mi |
| 107 Mount Saint Charles Ave Unit 2 Woonsocket, RI | 3.0 | 1.0 | 981 | $1,675 | $1.71 | 4d | 1 | 0.66mi |
| 36 Roberts St Woonsocket, RI | 2.0 | 1.0 | 850 | $1,450 | $1.71 | 43d | 1 | 0.69mi |
| 87 Manville Rd Woonsocket, RI | 2.0 | 1.0 | 900 | $1,500 | $1.67 | 23d | 1 | 0.70mi |
| 858 Bernon St Unit LL Woonsocket, RI | 1.0 | 1.0 | 700 | $1,400 | $2.00 | 11d | 1 | 0.71mi |
| 72 Kendrick Ave Woonsocket, RI | 1.0 | 1.0 | 1120 | $1,700 | $1.52 | 43d | 1 | 0.73mi |
| 160 Papineau Ave Woonsocket, RI | 2.0 | 1.0 | 750 | $2,000 | $2.67 | 2d | 1 | 0.74mi |
| 145 Burnside Ave Woonsocket, RI | 2.0 | 1.0 | 727 | $1,550 | $2.13 | 43d | 1 | 0.81mi |
| 52 Bellevue Ave Unit 3 Woonsocket, RI | 2.0 | 1.0 | 900 | $1,900 | $2.11 | 16d | 1 | 0.84mi |
| 24 Birch St Unit 2 Woonsocket, RI | 2.0 | 1.0 | 750 | $1,700 | $2.27 | 14d | 1 | 0.84mi |
| 425 Wood Ave #2 Woonsocket, RI | 1.0 | 1.0 | 800 | $1,500 | $1.88 | 15d | 1 | 0.85mi |
| 425 Wood Ave Woonsocket, RI | 3.0 | 1.0 | 1100 | $2,000 | $1.82 | 43d | 1 | 0.85mi |
| 663 Bernon St Apt 2 Woonsocket, RI | 3.0 | 1.0 | 1000 | $2,395 | $2.40 | 1d | 1 | 0.89mi |
| 242 Burnside Ave Unit 3F/4 Woonsocket, RI | 2.0 | 1.0 | 1080 | $1,400 | $1.30 | 1d | 1 | 0.90mi |
| 71 Hamlet Ave Unit 3R Woonsocket, RI | 1.0 | 1.0 | 800 | $1,500 | $1.88 | 44d | 1 | 0.90mi |
| 341 Burnside Ave Unit 2 Woonsocket, RI | 3.0 | 1.0 | 1114 | $1,650 | $1.48 | 43d | 1 | 0.95mi |
| 24 Paradis Ave Unit 3 Woonsocket, RI | 2.0 | 1.0 | 1080 | $1,300 | $1.20 | 43d | 1 | 0.97mi |
| 188 Division St Unit 2F Woonsocket, RI | 2.0 | 1.0 | 900 | $2,000 | $2.22 | 43d | 1 | 1.04mi |
| 188 Division St Unit 2R Woonsocket, RI | 2.0 | 1.0 | 900 | $1,900 | $2.11 | 23d | 1 | 1.04mi |
| 188 Division St Unit 3R Woonsocket, RI | 2.0 | 1.0 | 900 | $1,800 | $2.00 | 43d | 1 | 1.04mi |
| 18 Oak Hill Ave Unit 3F Woonsocket, RI | 2.0 | 1.0 | 650 | $1,500 | $2.31 | 23d | 1 | 1.07mi |
| 102 Mill St #203 Woonsocket, RI | 2.0 | 2.0 | 1052 | $2,100 | $2.00 | 1d | 1 | 1.08mi |
| 515 E School St Unit 9 Woonsocket, RI | 2.0 | 1.0 | 1080 | $1,600 | $1.48 | 4d | 1 | 1.08mi |
| 104 Mill St Woonsocket, RI | 2.0 | 2.0 | 1054 | $2,100 | $1.99 | 1d | 1 | 1.08mi |
| 220 Rathbun St Unit 2R Woonsocket, RI | 2.0 | 1.0 | 850 | $1,600 | $1.88 | 1d | 1 | 1.09mi |
| 35 Greene St Unit 2R Woonsocket, RI | 1.0 | 1.0 | 780 | $1,150 | $1.47 | 23d | 1 | 1.13mi |
Listing history 29 events
-
2026-06-18days on market $75,000 Active 26 DOM
-
2026-06-17days on market $75,000 Active 25 DOM
-
2026-06-16days on market $75,000 Active 24 DOM
-
2026-06-15days on market $75,000 Active 23 DOM
-
2026-06-13days on market $75,000 Active 21 DOM
-
2026-06-13days on market $75,000 Active 20 DOM
-
2026-06-09days on market $75,000 Active 17 DOM
-
2026-06-08days on market $75,000 Active 16 DOM
-
2026-06-07days on market $75,000 Active 15 DOM
-
2026-06-05days on market $75,000 Active 12 DOM
-
2026-06-03days on market $75,000 Active 11 DOM
-
2026-06-02days on market $75,000 Active 10 DOM
-
2026-06-01days on market $75,000 Active 9 DOM
-
2026-05-31days on market $75,000 Active 8 DOM
-
2026-05-22$75,000 Active
-
2022-08-08historical
-
2022-05-06$110,000 Active
-
2016-11-08price $149,900
-
2014-01-09soldstatus $262,377
-
2007-08-18historical
-
2007-07-16$150,000
-
2007-06-23historical
-
2007-01-28$159,000
-
2003-09-10soldstatus $200,000
-
2002-01-30historical
-
2001-08-01$85,000
-
1997-09-02soldstatus $10,000
-
1997-08-06historical
-
1997-06-18$29,900
ⓘ Source: listings_history table (triggers on properties + properties_extension) + one-shot
backfill from property_details.listing_events for pre-trigger history.
Tax reassessment forecast RI · Partial reset (capped growth)
- Current annual tax
- $783 · $65/mo
- Projected year-2 tax
- $1,003 · $84/mo
- Expected delta
- +$220/yr (+$18/mo · 28.1%)
ⓘ Screening estimate from a state-policy table — verify with the county assessor before closing.
Climate risk First Street
- Flood 1/10 Low FEMA zone X (unshaded) · 0% chance over 30 yrs
- Wildfire 3/10 Moderate
- Heat 4/10 Moderate 7 d/yr ≥95°F today · 15 d/yr by 30 yrs out
- Wind 6/10 Major 62% chance of damaging wind over 30 yrs
- Air quality 2/10 Low 1 unhealthy d/yr today · 2 by 30 yrs out
Nearby sold comps map
Loading sold comps map…
Walkable amenities ~0.75 mi
Loading nearby amenities…
Taxation est. · year 1
- Rental income
- $20,745
- − Mortgage interest
- −$4,201
- − Property taxes
- −$783
- − Insurance
- −$375
- − Repairs & maintenance
- −$1,660
- − Management
- −$1,660
- − Depreciation
- −$2,182
- Taxable income
- $9,885
- Est. tax owed @ 24.0%
- −$2,372
- After-tax cash flow
- $8,139/yr
For passive investors: Depreciation is non-cash, so a rental often shows a tax loss while cash-flowing — sheltering income. Rental losses are passive: they offset passive income freely, and up to $25,000/yr can offset ordinary (W-2) income if you actively participate and your MAGI is under $100k (phasing out to $0 by $150k); unused losses carry forward. On sale, claimed depreciation is recaptured at up to 25%, and gains may owe capital-gains tax (a 1031 exchange can defer both). Figures are a year-1 estimate at your 24.0% rate — not tax advice; consult a CPA.
Schools (NCES district)
- District
- Woonsocket
- NCES district ID
- 4401200
- Math proficiency
- 5% ▼ -7.00%
- Reading proficiency
- 14% ▼ -2.00%
- Median HH income
- $37,757
- Composite
- 8.01/100
- National rank
- #9923
- State rank
- #37 of 39 in RI
Livability — Woonsocket
- Score
- 65/100
- State rank
- #24
- US rank
- #12968
Category grades
Schools grade is shown separately in the Schools card above.
Census & demographics
- Census place
- Woonsocket, RI
- County
- Providence County · 548,917 people
- City population
- 43,521
- Metro
- Providence-Warwick, RI-MA
- Population (ZIP)
- 43,521
- Household income
- $61,059
- Rent vs Own
- Severe rent burden
- 2658.0
Population outlook (Providence County) Hauer SSP2
- Today (2025)
- 653,469 people
- By 2030
- 660,819 · +1.1%
- By 2040
- 672,747 · +3.0%
- By 2050
- 683,741 · +4.6%
- By 2075
- 720,435 · +10.2%
- By 2100
- 741,582 · +13.5%
Race, ethnicity, and origin ACS 2023
- Neighborhood character
- Diverse neighborhood (Simpson 0.64)
- Race & ethnicity
- White 54% Hispanic / Latino 26% Two or more races 18% Asian 7% Black 6% Native American 1%
- Hispanic origin (detail)
- Mexican 1% Puerto Rican 15% Dominican 4%
- Common ancestry
- Lithuanian 13% Romanian 3% Russian 3%
- Foreign-born
- 15% · Canada, Jamaica
- Languages at home
- 68% English-only · Spanish 17% Other Asian/Pacific 4% Other Indo-European 4%
Political lean MEDSL · Providence
- 2024 margin
- D (+14.4) · D 56.1% · R 41.7% · Other 2.2%
- 2008→2024 swing
- -20.0pp toward R · 2008: 34.4pp · 2024: 14.4pp
- All cycles
- 2024: D+14.4 2020: D+22.9 2016: D+21.2 2012: D+34.9 2008: D+34.4
Not yet ingested
- Civics
- —
Market trends
- HPI YoY
- ▼ -431.80%
- Current HPI
- 357.8858
- Rent YoY
- ▲ 9.15%
- Metro
- Providence-Warwick, RI-MA
- State GDP YoY
- ▲ 2.25%
- F500 in state
- 10
Industry mix (Fortune 500 HQ in RI)
| Industry | F500 HQs | Revenue |
|---|---|---|
| Healthcare | 1 | $373B |
|
||
| Food Distribution | 1 | $31B |
|
||
| Aerospace / Defense | 1 | $14B |
|
||
| Financial Services | 1 | $8B |
|
||
| Consumer Goods | 1 | $4B |
|
||
Price history
+150.8% since first listed15 events — show timeline
- 2026-05-22 Listed $75,000 RIS
- 2022-08-08 Listing Removed — RIS
- 2022-05-06 Listed $110,000 RIS
- 2016-11-08 Price Changed $149,900 RIS
- 2014-01-09 Sold (Public Records) $262,377 Public Records
- 2007-08-18 Listing Removed — RIS
- 2007-07-16 Listed $150,000 RIS
- 2007-06-23 Listing Removed — RIS
- 2007-01-28 Listed $159,000 RIS
- 2003-09-10 Sold (Public Records) $200,000 Public Records
- 2002-01-30 Listing Removed — RIS
- 2001-08-01 Listed $85,000 RIS
- 1997-09-02 Sold (MLS) $10,000 RIS
- 1997-08-06 Listing Removed — RIS
- 1997-06-18 Listed $29,900 RIS
Property tax history
-8.0%/yrLatest (2025): $783 · -61.9% YoY. Source: county tax records.
Cash-flow waterfall
monthlySold comps — $/sqft
last 12 mo · ≤1 miLoading sold comps…