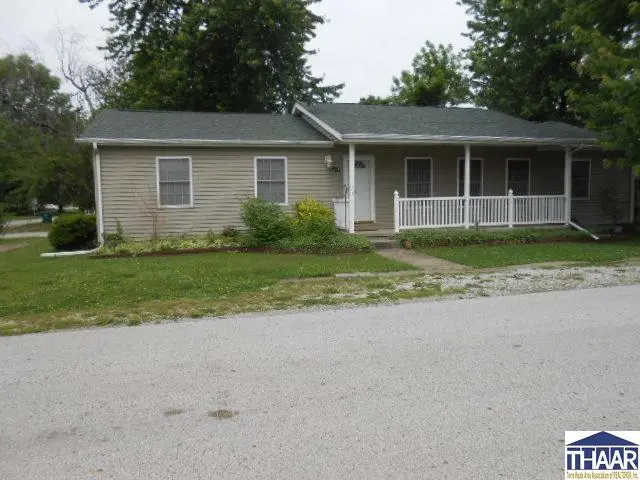
204 N 8th St · Farmersburg, IN
Flood risk 1/10 · Minimal
- FEMA flood zone
- —
- Chance of flooding over 30 yrs
- 0.0%
- Est. flood insurance / yr
- —
Fire risk 2/10 · Minimal
- Est. fire insurance / yr
- $717 – $1,331
Heat risk 4/10 · Minor
- Hot days now (above 104°F)
- 7 days/yr
- Hot days in 30 yrs
- 19 days/yr
Wind risk 2/10 · Minimal
- Chance of severe wind over 30 yrs
- 1.0%
Air-quality risk 3/10 · Minor
- Unhealthy air days now
- 1 days/yr
- Unhealthy air days in 30 yrs
- 3 days/yr
Risk factors via First Street. Map © Google.
Why this score? — see what drove the B grade
The composite is a weighted blend of 9 inputs, each scored 0–100. Each bar is that input's sub-score; the figure is the points it added to the 100-point composite (weight × sub-score).
- Cash flow +30.0/30.0
- ARV discount +15.0/15.0
- DSCR +10.0/10.0
- 1% rule +7.6/10.0
- Livability +3.2/5.0
- Schools +2.7/10.0
- Rent growth +2.5/5.0
- Condition / age +2.5/5.0
- Appreciation +1.4/10.0
$119,900
🖨 Deal sheet 📄 Offer letter ✓ Due diligence
Listing remarks
This is an Estate. It is a one owner home that was built, on a corner lot, in 2003. The home is in very good condition. The only thing a buyer will do is paint the walls as there has many items hanging on the wall while the homeowners lived there. There is large 23 ft. Living Rm. , a Dining Room or Family Rm. /Dining Combo that has French doors and the buyer could build a deck or porch area if they would like that for their family. The Kitchen is over 15 ft. long and has Solid Oak Cabinets. All the appliances are staying with the home. There is a utility room off the kitchen with the washer & dryer that will also be staying. There are 4 bedrooms. The Master Bedroom has its own bath a
Key facts
- Covered front porch
- Solid oak cabinets
- Utility room
Tags
Property features AI
Exterior
- Parking: Detached garage with garage door opener (1 car)
- Security: Smoke detector(s)
- Utilities: Public sewer
- Home design: Single family residence; 1 story
- Construction: Vinyl siding; Shingle roof
- Exterior features: Covered patio/porch
Interior
- Kitchen: Dishwasher; Electric range; Electric oven; Microwave; Refrigerator
- Flooring: Carpet; Vinyl
- Bathrooms: 2 full bathrooms
- Heating & cooling: Natural gas heating; Central air conditioning; Ceiling fans
- Interior features: Window coverings; Crawl space basement
- Laundry & utility: Washer; Dryer
Neighborhood map
What this means for you Summary
Snapshot
- This is a 4-bed/1.0-bath single-family listed at $120k.
Deal economics
- At list price, monthly cash flow is $471 ($6k/yr) — positive.
- The deal already cash-flows at list — no discount required.
- Meets the 1% rule at list price ($2k rent vs $120k).
Location & tenants
- Location reads 63/100 on livability (#434 in IN) — a middle-class / working-renter tenant base. Strengths: crime A+, cost of living A+, housing A; Watch: employment D+, amenities F, commute F.
- Northeast School Corporation (rural): math 29% / reading 34% proficiency, ranked #228 of 301 in IN (top 76%) — families likely to look elsewhere, expect single-tenant / working-renter base with shorter leases.
- Zoned schools: North Central Jr/Sr High School (math 12% / reading 32%, grade F, #343 of 369 statewide, top 93%, 374 students, 55% FRL).
- Market conditions: 19 active listings in the ZIP; 4 units permitted in Sullivan County in 2024 (0 in 5+ unit buildings).
Forward outlook
- Local home prices are declining (-3.0%/yr); year-one equity from $829 of loan paydown is wiped out by about $4k of value loss. Plan a longer hold.
- Sullivan County population projected at -12% by 2050 — secular population decline; favor cash flow + early exit over multi-decade hold.
- At projected returns (-3.0% appreciation + 3.0% rent growth), your $34k cash investment doubles in ~8 years — after that, you're playing with house money.
Negotiation context
- Only 2 days on market — expect competitive offers; lowballing is unlikely to land.
- Current owner paid $79k; list at $120k implies a 52% gain — meaningful room to come down on a strong offer.
Questions for the listing agent
- Is there a deadline driving the sale (1031 exchange, divorce, estate, relocation)? That informs how much negotiation room exists.
- What's the average days-on-market for RENTAL listings here right now (not sales)? A rising rental-DOM trend means longer vacancies and softer asking-rent achievability than the comps imply.
- What's the recent tenant-quality profile in this submarket — average credit score on applications, eviction rate, late-payment / NSF rate, and stable-employment percentage? A property-management company in the area should have these aggregated.
- How much new for-sale + rental construction is in the pipeline within 1–3 miles? Heavy new supply typically softens prices + rents 12–24 months out; constrained supply supports both.
Investment metrics
- 1% rule
- 1.26% ✓
- Cap rate
- 11.00%
- Cash-on-cash
- 16.82%
- DSCR
- 1.75
- GRM
- 6.6
CMA / ARV
- ARV (on-the-fly)
- $191,520
- Comps found
- 4
Show comp detail 4 sales within ~0.75 mi
| Address | Dist | Beds/Ba | Sqft | Sold | Price | $/sf | Match |
|---|---|---|---|---|---|---|---|
| 204 N 8th St | 0.00mi | 4/2.0 | 1,680 (0%) | 0mo | $120,000 | $71 | 96 |
| 301 W Illinois St | 0.37mi | 4/2.0 | 1,912 (+14%) | 1mo | $195,000 | $102 | 55 |
| 603 S Third St | 0.48mi | 3/1.0 (-1) | 1,494 (-11%) | 2mo | $170,000 | $114 | 52 |
| 515 E Main St | 0.73mi | 3/2.0 (-1) | 1,456 (-13%) | 4mo | $192,000 | $132 | 31 |
Match score weights: distance 35% · size 25% · config 20% · recency 20%. Top-matched comps best support the ARV.
Projected returns pro-forma
-3.0% appreciation · 3.0% rent growth · sell at horizon
- IRR
- 8.0%
- Equity multiple
- 1.31×
- Total profit
- $10,501
- Equity at exit
- $17,877
- IRR
- 17.2%
- Equity multiple
- 2.42×
- Total profit
- $47,561
- Equity at exit
- $10,367
Cash invested: $33,572 (down + closing). Projections, not guarantees.
Landlord ↔ Tenant lean methodology
- Overall (STATE)
- 90 Strongly Landlord-Friendly
- State Indiana
- 90 Strongly Landlord-Friendly · R+11
- County
- — inherits STATE
- City
- — inherits STATE
ZIP-level market 47850
- Home prices YoY
- -3.8%
- Active inventory
- 19
- Price-to-rent
- 6.6×
Monthly cashflow live
- Estimated rent
- $1,507 medium interval (Pro) →
- Mortgage (P&I)
- −$629
- Tax from tax record
- −$41 /mo · $491/yr
- Insurance
- −$50
- HOA
- −$0
- Vacancy / Maint / Mgmt
- −$316
- Net cashflow
- $471
Break-even live
UW: 25.0% down · 7.5% · 30yr · 1.5% tax · 5.0% vac · 8.0% maint · 8.0% mgmt
Financing live
Cash to close
- Down payment
- $29,975
- Closing costs
- $3,597
- Reserves months
- —
- Total cash needed
- —
Loan-product check · same deal, 3 products live
Conventional
25% down · 7.5% · 30yr
- Down + closing
- —
- Monthly P&I
- —
- Monthly cashflow
- —
- DSCR
- —
- Eligible?
- —
Personal DTI + credit; lowest rate.
DSCR
20% down · 8.5% · 30yr
- Down + closing
- —
- Monthly P&I
- —
- Monthly cashflow
- —
- DSCR
- —
- Eligible?
- —
No personal income docs; deal must DSCR.
Hard money
10% down · 12.0% · 12mo
- Down + closing
- —
- Monthly P&I
- —
- Monthly cashflow
- —
- DSCR
- —
- Eligible?
- —
Short-term bridge; refi at stabilization.
Listing history 2 events
-
2026-05-26$119,900 Active
-
2003-12-01soldstatus $78,900
ⓘ Source: listings_history table (triggers on properties + properties_extension) + one-shot
backfill from property_details.listing_events for pre-trigger history.
Tax reassessment forecast IN · Partial reset (capped growth)
- Current annual tax
- $491 · $41/mo
- Projected year-2 tax
- $755 · $63/mo
- Expected delta
- +$264/yr (+$22/mo · 53.9%)
ⓘ Screening estimate from a state-policy table — verify with the county assessor before closing.
Climate risk First Street
- Flood 1/10 Low 0% chance over 30 yrs
- Wildfire 2/10 Low
- Heat 4/10 Moderate 7 d/yr ≥104°F today · 19 d/yr by 30 yrs out
- Wind 2/10 Low 100% chance of damaging wind over 30 yrs
- Air quality 3/10 Moderate 1 unhealthy d/yr today · 3 by 30 yrs out
Nearby sold comps map
Loading sold comps map…
Walkable amenities ~0.75 mi
Loading nearby amenities…
Taxation est. · year 1
- Rental income
- $18,080
- − Mortgage interest
- −$6,716
- − Property taxes
- −$491
- − Insurance
- −$600
- − Repairs & maintenance
- −$1,446
- − Management
- −$1,446
- − Depreciation
- −$3,488
- Taxable income
- $3,892
- Est. tax owed @ 24.0%
- −$934
- After-tax cash flow
- $4,713/yr
For passive investors: Depreciation is non-cash, so a rental often shows a tax loss while cash-flowing — sheltering income. Rental losses are passive: they offset passive income freely, and up to $25,000/yr can offset ordinary (W-2) income if you actively participate and your MAGI is under $100k (phasing out to $0 by $150k); unused losses carry forward. On sale, claimed depreciation is recaptured at up to 25%, and gains may owe capital-gains tax (a 1031 exchange can defer both). Figures are a year-1 estimate at your 24.0% rate — not tax advice; consult a CPA.
Schools (NCES district)
- District
- Northeast School Corporation
- NCES district ID
- 1808160
- Math proficiency
- 29% ▼ -10.00%
- Reading proficiency
- 34% ▼ -7.00%
- Median HH income
- $45,565
- Composite
- 27.01/100
- National rank
- #7061
- State rank
- #228 of 301 in IN
Livability — Farmersburg
- Score
- 63/100
- State rank
- #434
- US rank
- #15622
Category grades
Schools grade is shown separately in the Schools card above.
Census & demographics
- Census place
- Farmersburg, IN
- Population (ZIP)
- 2,027
Population outlook (Sullivan County) Hauer SSP2
- Today (2025)
- 20,313 people
- By 2030
- 19,908 · -2.0%
- By 2040
- 19,009 · -6.4%
- By 2050
- 17,972 · -11.5%
- By 2075
- 14,929 · -26.5%
- By 2100
- 11,391 · -43.9%
Race, ethnicity, and origin ACS 2023
- Neighborhood character
- Predominantly White (95%)
- Race & ethnicity
- White 95% Asian 4%
- Common ancestry
- Italian 4% Slovak 3% Romanian 3%
- Foreign-born
- 4% · Canada
- Languages at home
- 99% English-only · Other Asian/Pacific 1%
Political lean MEDSL · Sullivan
- 2024 margin
- Solid R (+52.7) · D 22.8% · R 75.5% · Other 1.7%
- 2008→2024 swing
- -52.0pp toward R · 2008: -0.7pp · 2024: -52.7pp
- All cycles
- 2024: R+52.7 2020: R+50.5 2016: R+47.0 2012: R+20.6 2008: R+0.7
Not yet ingested
- Civics
- —
Market trends
- HPI YoY
- ▼ -7.13%
- Current HPI
- 183.1507
- Rent YoY
- —
- Metro
- —
- State GDP YoY
- ▲ 2.90%
- F500 in state
- 18
Industry mix (Fortune 500 HQ in IN)
| Industry | F500 HQs | Revenue |
|---|---|---|
| Industrial Machinery | 2 | $37B |
|
||
| Healthcare | 1 | $177B |
|
||
| Pharmaceuticals | 1 | $45B |
|
||
| Metals / Steel | 1 | $18B |
|
||
| Agriculture | 1 | $17B |
|
||
| Packaging | 1 | $12B |
|
||
Price history
+52.0% since first listed2 events — show timeline
- 2026-05-26 Listed $119,900 THAAR
- 2003-12-01 Sold (Public Records) $78,900 Public Records
Property tax history
+22.0%/yrLatest (2024): $491 · +31.1% YoY. Source: county tax records.
Cash-flow waterfall
monthlySold comps — $/sqft
last 12 mo · ≤1 miLoading sold comps…