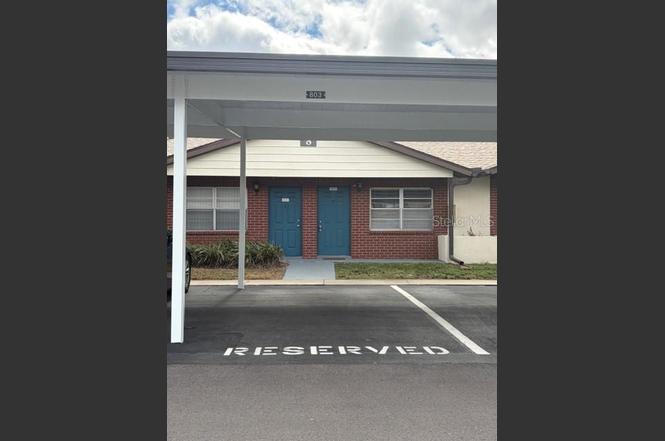
24862 N US Highway 19 #803 · Clearwater, FL
Flood risk 1/10 · Minimal
- FEMA flood zone
- X (unshaded)
- Chance of flooding over 30 yrs
- 0.0%
- Est. flood insurance / yr
- $507 – $1,088
Fire risk 1/10 · Minimal
- Est. fire insurance / yr
- $947 – $1,759
Heat risk 10/10 · Severe
- Hot days now (above 107°F)
- 7 days/yr
- Hot days in 30 yrs
- 28 days/yr
Wind risk 10/10 · Severe
- Chance of severe wind over 30 yrs
- 99.0%
Air-quality risk 3/10 · Minor
- Unhealthy air days now
- 3 days/yr
- Unhealthy air days in 30 yrs
- 3 days/yr
Risk factors via First Street. Map © Google.
Why this score? — see what drove the D+ grade
The composite is a weighted blend of 9 inputs, each scored 0–100. Each bar is that input's sub-score; the figure is the points it added to the 100-point composite (weight × sub-score).
- Cash flow +14.3/30.0
- 1% rule +10.0/10.0
- ARV discount +7.5/15.0
- DSCR +4.3/10.0
- Schools +4.3/10.0
- Livability +4.1/5.0
- Condition / age +2.5/5.0
- Rent growth +1.8/5.0
- Appreciation +0.0/10.0
$93,000
🖨 Deal sheet 📄 Offer letter ✓ Due diligence
Listing remarks
Charming Clearwater Condo - one bedroom, one bath centrally located for shopping and restaurants. Condo has been recently renovated and is in move in condition! A/C is less then 1 yr old, Hot water heater is 3 plus yrs old. This condo features a pulldown ladder with attic storage. This condo also features a large screened in porch for your outside entertainment. This unit is close to the clubhouse, pool and laundry facilities. A MUST SEE!
Key facts
- Close to pool
- Pulldown ladder
- Attic storage
Tags
Property features AI
Finance
- Other: Listing shows as unfurnished
- Financial info: Total annual HOA fees approximately $5,256; Lease restrictions apply
- HOA & community: HOA with monthly fee required ($438/month); Association approval required; Community clubhouse and pool; Community mailbox; Deed restrictions; Buyer approval required; Pets allowed with size limit
Exterior
- Parking: Assigned covered parking; 1-car carport
- Utilities: Public sewer; Broadband/high-speed internet available; Cable available; Electricity available and connected; Water available and connected
- Home design: Residential villa; Single-story (one level); Completed condition; Faces north
- Construction: Block, cement siding and stucco construction; Shingle roof; Block and slab foundation; Built area approximately 55.09 m²
- Exterior features: Rear screened porch; Sidewalk; Exterior storage; Trees and landscaping
Interior
- Kitchen: Range; Range hood; Refrigerator; Electric water heater
- Bedrooms: 1 bedroom
- Flooring: Laminate
- Bathrooms: 1 full bathroom
- Heating & cooling: Central heating; Central air conditioning
- Interior features: Living room and dining room combined; Blinds; Attic (additional room)
- Laundry & utility: Common area laundry
Neighborhood map
What this means for you Summary
Snapshot
- This is a 1-bed/1.0-bath condo listed at $93k.
Deal economics
- At list price, monthly cash flow is $16 ($195/yr) — positive.
- The deal already cash-flows at list — no discount required.
- Meets the 1% rule at list price ($1k rent vs $93k).
- Recommended offer: $82k (12.0% below list) — sets the bar for market timing.
- Cap rate 6.5% vs local median 2.9% in Clearwater — top-decile yield for the area; either an underpriced asset or a hidden risk that comps aren't pricing in. Stress-test before assuming the spread holds.
Location & tenants
- Location reads 82/100 on livability (#60 in FL, #988 nationally) — a professional / high-income tenant draw. Strengths: commute A+, housing A+, health & safety A+; Watch: schools C-, employment C-.
- Pinellas (suburban): math 51% / reading 51% proficiency, ranked #31 of 73 in FL (top 42%) — acceptable for families but not a draw, mixed tenant base, ~2y average lease.
- Market conditions: Rents soft (-2.6%/yr); 288 active listings in the ZIP; 12 comparable units currently listed for rent nearby; rentals leasing fast (median 4d on market — plan ~1-2 weeks tenant-placement turnaround); 2,676 units permitted in Pinellas County in 2024 (1,422 in 5+ unit buildings).
- This rent runs 31% of the median local income ($55k/yr) — at the standard rent-burdened threshold; future hikes will face affordability resistance.
Forward outlook
- Local home prices are declining (-3.0%/yr); year-one equity from $643 of loan paydown is wiped out by about $3k of value loss. Plan a longer hold.
- Pinellas County population projected at +14% by 2050 — modest demand growth; plan on rents tracking national, not racing it.
Negotiation context
- It's been on market 130 days — a 12% lower offer ($82k) is reasonable based on typical stale-listing flexibility.
- Current owner paid $35k; list at $93k implies a 166% gain — meaningful room to come down on a strong offer.
Risks & watch-outs
- Watch-outs: HOA is 31% of rent.
- Climate carrying-cost: severe wind risk, 99% chance of damaging wind over 30y; extreme-heat days projected 7→28/yr by 2055 (HVAC capex compounding) — expect insurance premiums to compound above CPI over the hold.
Questions for the listing agent
- It's been on market 130 days. Have you received any prior offers? Is the seller open to a 12% concession, seller financing, or rate buy-down credit?
- Built in 1978 — when were the roof, HVAC, electrical panel, plumbing, and water heater last replaced?
- What does the HOA fee cover, when was the last increase, and are there any pending special assessments or reserve-fund shortfalls?
- Any open or pending special assessments — roof, HVAC, plumbing, elevator, façade? What's the per-unit balance and payoff schedule, and is the seller paying it off at close or rolling it to the buyer?
- Why hasn't it sold? Are there any deal-killer items the seller is aware of (foundation, flood, title, zoning, code violations)?
- Is there a deadline driving the sale (1031 exchange, divorce, estate, relocation)? That informs how much negotiation room exists.
- The area grade is low — what's the realistic commute time and amenity access for the typical tenant pool here? Any planned neighborhood developments (good or bad) we should know about?
- What's the average days-on-market for RENTAL listings here right now (not sales)? A rising rental-DOM trend means longer vacancies and softer asking-rent achievability than the comps imply.
- What's the recent tenant-quality profile in this submarket — average credit score on applications, eviction rate, late-payment / NSF rate, and stable-employment percentage? A property-management company in the area should have these aggregated.
- How much new apartment / multifamily construction is in the pipeline within 1–3 miles? Heavy new supply (>2% of stock underway) typically softens rents 12–24 months out; light construction supports rent growth.
Investment metrics
- 1% rule
- 1.53% ✓
- Cap rate
- 6.50%
- Cash-on-cash
- 0.75%
- DSCR
- 1.03
- GRM
- 5.4
CMA / ARV
No comps found within radius.
Projected returns pro-forma
-3.0% appreciation · 0.0% rent growth · sell at horizon
- IRR
- -20.7%
- Equity multiple
- 0.31×
- Total profit
- $-17,909
- Equity at exit
- $13,867
- IRR
- -35.5%
- Equity multiple
- -0.12×
- Total profit
- $-29,169
- Equity at exit
- $8,041
Cash invested: $26,040 (down + closing). Projections, not guarantees.
Landlord ↔ Tenant lean methodology
- Overall (STATE)
- 87 Strongly Landlord-Friendly
- State Florida
- 87 Strongly Landlord-Friendly · R+3
- County
- — inherits STATE
- City
- — inherits STATE
ZIP-level market 33763
- Rents YoY
- -2.6%
- Active inventory
- 288
- Price-to-rent
- 5.4×
Monthly cashflow live
- Estimated rent
- $1,427 high interval (Pro) →
- Mortgage (P&I)
- −$488
- Tax from tax record
- −$147 /mo · $1,759/yr
- Insurance
- −$39
- HOA
- −$438
- Vacancy / Maint / Mgmt
- −$300
- Net cashflow
- $16
Break-even live
UW: 25.0% down · 7.5% · 30yr · 1.5% tax · 5.0% vac · 8.0% maint · 8.0% mgmt
Financing live
Cash to close
- Down payment
- $23,250
- Closing costs
- $2,790
- Reserves months
- —
- Total cash needed
- —
Loan-product check · same deal, 3 products live
Conventional
25% down · 7.5% · 30yr
- Down + closing
- —
- Monthly P&I
- —
- Monthly cashflow
- —
- DSCR
- —
- Eligible?
- —
Personal DTI + credit; lowest rate.
DSCR
20% down · 8.5% · 30yr
- Down + closing
- —
- Monthly P&I
- —
- Monthly cashflow
- —
- DSCR
- —
- Eligible?
- —
No personal income docs; deal must DSCR.
Hard money
10% down · 12.0% · 12mo
- Down + closing
- —
- Monthly P&I
- —
- Monthly cashflow
- —
- DSCR
- —
- Eligible?
- —
Short-term bridge; refi at stabilization.
Rent comps 12 comps
| Address | Beds | Baths | Sqft | Rent | $/sqft | DOM | Units | Dist |
|---|---|---|---|---|---|---|---|---|
| 24862 U.S. 19 Unit 3202 1 Clearwater, FL | 1.0 | 1.0 | 640 | $1,295 | $2.02 | 23d | 1 | 0.09mi |
| 24862 US Highway 19 N #3202 Clearwater, FL | 1.0 | 1.0 | 600 | $1,295 | $2.16 | 3d | 1 | 0.15mi |
| 25350 US Highway 19 N Clearwater, FL | 3.0 | 1.0–2.0 | 875 | $1,466 | $1.68 | 2d | 28 | 0.29mi |
| 2031 Glass Loop Clearwater, FL | 1.0–3.0 | 1.0–2.0 | 1058 | $1,848 | $1.75 | 2d | 34 | 0.38mi |
| 2400 Franciscan Dr #44 Clearwater, FL | 1.0 | 1.0 | 735 | $1,200 | $1.63 | 24d | 1 | 0.58mi |
| 2599 Countryside Blvd #210 Clearwater, FL | 1.0 | 1.0 | 575 | $1,400 | $2.43 | 2d | 1 | 0.83mi |
| 2597 Countryside Blvd #209 Clearwater, FL | 1.0 | 1.0 | 575 | $1,500 | $2.61 | 3d | 1 | 0.89mi |
| 1730 Audrey Dr Unit 2 Clearwater, FL | 1.0 | 1.0 | 700 | $2,100 | $3.00 | 24d | 1 | 1.05mi |
| 2583 Countryside Blvd #3103 Clearwater, FL | 1.0 | 1.0 | 555 | $1,400 | $2.52 | 24d | 1 | 1.08mi |
| 2524 Alexander Pl Clearwater, FL | 1.0–3.0 | 1.0–2.0 | 991 | $1,735 | $1.75 | 1d | 20 | 1.13mi |
| 2625 Florida 590 Unit 1414 Clearwater, FL | 1.0 | 1.0 | 600 | $1,300 | $2.17 | 24d | 1 | 1.28mi |
| 2481 NE Coachman Rd Clearwater, FL | 1.0–2.0 | 1.0–2.0 | 762 | $1,424 | $1.87 | 1d | 14 | 1.44mi |
HOA detail condo
- Monthly dues
- $438 · $5,256/yr
- Likely covers
- waterpool
- Assessments
- None detected in remarks — confirm with the listing agent.
Listing history 17 events
-
2026-06-18days on market $93,000 Active 130 DOM
-
2026-06-17days on market $93,000 Active 129 DOM
-
2026-06-16days on market $93,000 Active 128 DOM
-
2026-06-15days on market $93,000 Active 127 DOM
-
2026-06-13days on market $93,000 Active 125 DOM
-
2026-06-09days on market $93,000 Active 121 DOM
-
2026-06-08days on market $93,000 Active 120 DOM
-
2026-06-07days on market $93,000 Active 119 DOM
-
2026-06-04days on market $93,000 Active 116 DOM
-
2026-06-03days on market $93,000 Active 115 DOM
-
2026-06-01days on market $93,000 Active 113 DOM
-
2026-05-31days on market $93,000 Active 112 DOM
-
2026-05-12price $93,000
-
2026-02-08$107,000 Active
-
2018-01-08soldstatus $35,000
-
2002-03-01soldstatus $72,500
-
1998-03-17soldstatus $750,000
ⓘ Source: listings_history table (triggers on properties + properties_extension) + one-shot
backfill from property_details.listing_events for pre-trigger history.
Tax reassessment forecast FL · Resets to sale price
- Current annual tax
- $1,759 · $147/mo
- Projected year-2 tax
- $1,759 · $147/mo
- Expected delta
- $0/yr ($0/mo · 0.0%)
ⓘ Screening estimate from a state-policy table — verify with the county assessor before closing.
Climate risk First Street
- Flood 1/10 Low FEMA zone X (unshaded) · 0% chance over 30 yrs
- Wildfire 1/10 Low
- Heat 10/10 Extreme 7 d/yr ≥107°F today · 28 d/yr by 30 yrs out
- Wind 10/10 Extreme 99% chance of damaging wind over 30 yrs
- Air quality 3/10 Moderate 3 unhealthy d/yr today · 3 by 30 yrs out
Nearby sold comps map
Loading sold comps map…
Walkable amenities ~0.75 mi
Loading nearby amenities…
Taxation est. · year 1
- Rental income
- $17,123
- − Mortgage interest
- −$5,209
- − Property taxes
- −$1,759
- − Insurance
- −$465
- − Repairs & maintenance
- −$1,370
- − Management
- −$1,370
- − HOA
- −$5,256
- − Depreciation
- −$2,705
- Taxable loss
- −$1,012
- Est. tax savings @ 24.0%
- +$243
- After-tax cash flow
- $437/yr
For passive investors: Depreciation is non-cash, so a rental often shows a tax loss while cash-flowing — sheltering income. Rental losses are passive: they offset passive income freely, and up to $25,000/yr can offset ordinary (W-2) income if you actively participate and your MAGI is under $100k (phasing out to $0 by $150k); unused losses carry forward. On sale, claimed depreciation is recaptured at up to 25%, and gains may owe capital-gains tax (a 1031 exchange can defer both). Figures are a year-1 estimate at your 24.0% rate — not tax advice; consult a CPA.
Schools (NCES district)
- District
- Pinellas
- NCES district ID
- 1201560
- Math proficiency
- 51% ▼ -5.00%
- Reading proficiency
- 51% ▼ -3.00%
- Median HH income
- $46,270
- Composite
- 43.27/100
- National rank
- #3046
- State rank
- #31 of 73 in FL
Livability — Clearwater
- Score
- 82/100
- State rank
- #60
- US rank
- #988
Category grades
Schools grade is shown separately in the Schools card above.
Census & demographics
- Census place
- Clearwater, FL
- County
- Pinellas County · 939,478 people
- City population
- 170,933
- Metro
- Tampa-St. Petersburg-Clearwater, FL
- Population (ZIP)
- 21,146
- Household income
- $54,794
- Rent vs Own
- Severe rent burden
- 753.0
Population outlook (Pinellas County) Hauer SSP2
- Today (2025)
- 1,027,532 people
- By 2030
- 1,063,586 · +3.5%
- By 2040
- 1,125,020 · +9.5%
- By 2050
- 1,168,637 · +13.7%
- By 2075
- 1,265,188 · +23.1%
- By 2100
- 1,260,357 · +22.7%
Race, ethnicity, and origin ACS 2023
- Neighborhood character
- Predominantly White (72%)
- Race & ethnicity
- White 72% Hispanic / Latino 17% Two or more races 9% Black 4% Asian 2%
- Hispanic origin (detail)
- Mexican 5% Puerto Rican 3% Cuban 1%
- Common ancestry
- Romanian 3% Lithuanian 2% Slovak 2%
- Foreign-born
- 15% · Canada, Jamaica, Vietnam
- Languages at home
- 81% English-only · Spanish 10% Other Indo-European 3% Russian/Polish/Slavic 1%
Political lean MEDSL · Pinellas
- 2024 margin
- Lean R (+5.2) · D 46.9% · R 52.1%
- 2008→2024 swing
- -13.5pp toward R · 2008: 8.3pp · 2024: -5.2pp
- All cycles
- 2024: R+5.2 2020: D+0.2 2016: R+1.1 2012: D+5.6 2008: D+8.3
Not yet ingested
- Civics
- —
Market trends
- HPI YoY
- ▼ -439.90%
- Current HPI
- 265.3099
- Rent YoY
- ▼ -2.63%
- Metro
- Tampa-St. Petersburg-Clearwater, FL
- State GDP YoY
- ▲ 3.28%
- F500 in state
- 36
Industry mix (Fortune 500 HQ in FL)
| Industry | F500 HQs | Revenue |
|---|---|---|
| Industrial Technology | 2 | $29B |
|
||
| Insurance | 2 | $17B |
|
||
| Retail | 1 | $60B |
|
||
| Technology Distribution | 1 | $58B |
|
||
| Homebuilding | 1 | $35B |
|
||
| Technology Manufacturing | 1 | $35B |
|
||
Price history
-87.6% since first listed5 events — show timeline
- 2026-05-12 Price Changed $93,000 Stellar MLS as Distributed by MLS Grid
- 2026-02-08 Listed $107,000 Stellar MLS as Distributed by MLS Grid
- 2018-01-08 Sold (Public Records) $35,000 Public Records
- 2002-03-01 Sold (Public Records) $72,500 Public Records
- 1998-03-17 Sold (Public Records) $750,000 Public Records
Property tax history
+8.3%/yrLatest (2025): $1,759 · +3.9% YoY. Source: county tax records.
Cash-flow waterfall
monthlySold comps — $/sqft
last 12 mo · ≤1 miLoading sold comps…