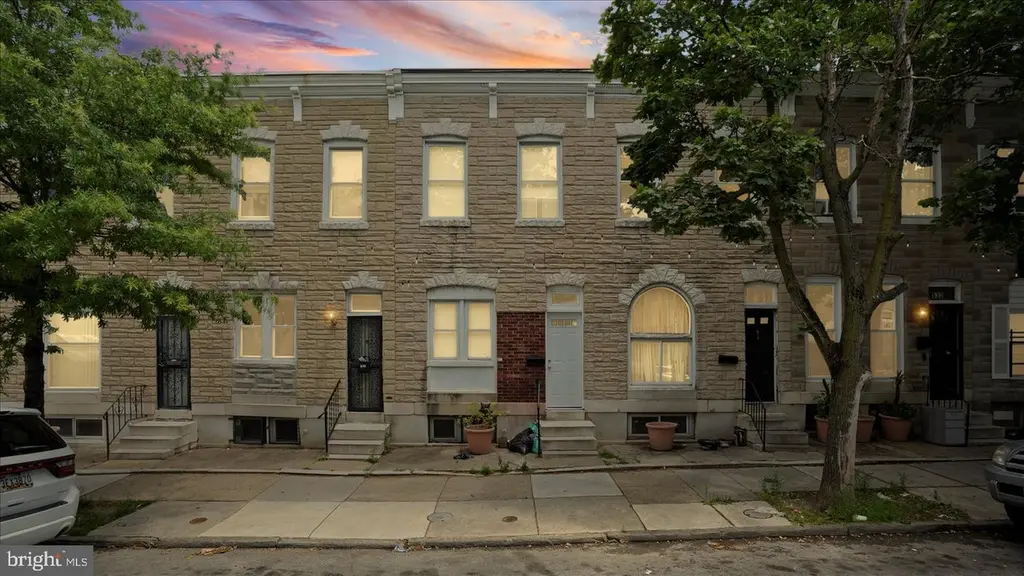
537 N Milton Ave · Baltimore, MD
Flood risk 1/10 · Minimal
- FEMA flood zone
- X (unshaded)
- Chance of flooding over 30 yrs
- 0.0%
- Est. flood insurance / yr
- $507 – $1,088
Fire risk 1/10 · Minimal
- Est. fire insurance / yr
- $755 – $1,403
Heat risk 8/10 · Major
- Hot days now (above 103°F)
- 7 days/yr
- Hot days in 30 yrs
- 15 days/yr
Wind risk 6/10 · Moderate
- Chance of severe wind over 30 yrs
- 27.0%
Air-quality risk 4/10 · Minor
- Unhealthy air days now
- 6 days/yr
- Unhealthy air days in 30 yrs
- 7 days/yr
Risk factors via First Street. Map © Google.
Why this score? — see what drove the C grade
The composite is a weighted blend of 9 inputs, each scored 0–100. Each bar is that input's sub-score; the figure is the points it added to the 100-point composite (weight × sub-score).
- Cash flow +29.3/30.0
- DSCR +10.0/10.0
- 1% rule +7.3/10.0
- Rent growth +5.0/5.0
- Livability +3.8/5.0
- Condition / age +2.5/5.0
- Schools +1.0/10.0
- ARV discount +0.0/15.0
- Appreciation +0.0/10.0
$150,000
🖨 Deal sheet (PDF) 📄 Offer letter ✓ Due diligence
Listing remarks MLS
OWNER PORTFOLIO SALE!! 14 Properties in East Baltimore soon to be rented and well updated. MUST BE PURCHASED AS A PACKAGE. Homes come with fresh paint, updated flooring, average age of roofs 2-3 years, updated electric, Plumbing and HVAC and many many more! 8 Homes are newly renovated, 3 are vacant and under renovation and will be completed prior to closing. 3 Properties are vintage with section 8 tenants and are cash flowing. All homes are being sold AS-IS, Seller will make no repairs. Buyer to verify ground rent if one exists, Seller will not redeem. All offers must have Proof of Funds, EMD and All Required Addenda. Projected rents are $17,600 and could easily be more!! List price is a break down on housing, Current list price for portfolio is $1,485,000. Email listing agent for more details. Leases, Lead Certs, Rental Registrations and Rent breakdown available once a contract has been accepted. See Documents for possible financial options. Put these in your portfolio today!!
Key facts
- No grass to maintain
- Updated kitchen
- Built 1920
Tags
Property features AI
Exterior
- Parking: On-street parking
- Utilities: Public water; Public sewer
- Home design: Interior townhouse/rowhouse; Fee simple ownership; Built year from assessor
- Construction: Brick construction; Permanent foundation; Above-grade and below-grade structures
- Exterior features: No tidal water
Interior
- Bedrooms: 3 bedrooms on the first upper level
- Bathrooms: 1 full bathroom
- Heating & cooling: 90% forced air heating; Electric heating fuel; Electric hot water
- Interior features: Estimated living area; Unfinished basement
Neighborhood map
What this means for you Summary
Snapshot
- This is a 3-bed/1.0-bath townhouse listed at $150k.
Deal economics
- At list price, monthly cash flow is $526 ($6k/yr) — positive.
- The deal already cash-flows at list — no discount required.
- Meets the 1% rule at list price ($2k rent vs $150k).
- Cap rate 10.5% vs local median 6.0% in Baltimore — top-decile yield for the area; either an underpriced asset or a hidden risk that comps aren't pricing in. Stress-test before assuming the spread holds.
Location & tenants
- Location reads 76/100 on livability (#90 in MD, #3,396 nationally) — a middle-class / working-renter tenant base. Strengths: amenities A+, commute A+, housing A+; Watch: crime F.
- Baltimore City Public Schools (urban): math 7% / reading 16% proficiency, ranked #24 of 24 in MD (top 100%) — low school quality limits family demand, transient renter base, plan for 1-2y turnover; 79% free/reduced lunch — lower-income household profile, screen leases tightly.
- Zoned schools: Elmer A. Henderson: A Johns Hopkins Partnership (math 2% / reading 16%, grade F, #650 of 860 statewide, top 77%, 642 students, 80% FRL); Baltimore Polytechnic Institute (math 71% / reading 84%, grade A-, #22 of 222 statewide, top 10%, 1,555 students, 43% FRL) — zoned schools average 62% FRL vs 79% district-wide (17 pts lower); this property's tenant base skews higher-income than the district average.
- Zoned-school proficiency averages 43% at this address vs 12% district-wide (+32 pts) — the actual schools serving this property are materially stronger than the Baltimore City Public Schools average implies; a family-tenant draw the district grade alone would hide.
- Market conditions: Rents rising fast (+9.9%/yr); 145 active listings in the ZIP; 12 comparable units currently listed for rent nearby; rentals at typical pace (median 26d on market — plan ~3-4 weeks tenant-placement turnaround); lower-income renter base — watch delinquency; 1,273 units permitted in Baltimore city in 2024 (1,104 in 5+ unit buildings).
- At $1,845/mo this rent would consume 51% of the median local household income ($43k/yr) (locally 966% of renters already pay >50% of income on rent) — very limited rent-growth headroom before tenants either downsize or default.
Forward outlook
- Local home prices are declining (-3.0%/yr); year-one equity from $1k of loan paydown is wiped out by about $4k of value loss. Plan a longer hold.
- Baltimore County population projected to shrink 4% by 2050 — rents likely to lag national; underwrite the cash flow, not the appreciation.
- At projected returns (-3.0% appreciation + 8.0% rent growth), your $42k cash investment doubles in ~6 years — after that, you're playing with house money.
Negotiation context
- Only 10 days on market — expect competitive offers; lowballing is unlikely to land.
- 5 sale attempts since 28y ago with the ask held roughly flat each time — persistent listings suggest the price (not the market) is what's stuck; bring a comps-based counter.
Risks & watch-outs
- Watch-outs: built in 1920 — expect roof / HVAC / electrical / plumbing capex.
- Climate carrying-cost: major wind risk, 27% chance of damaging wind over 30y; extreme-heat days projected 7→15/yr by 2055 (HVAC capex compounding) — expect insurance premiums to compound above CPI over the hold.
Questions for the listing agent
- Built in 1920 — when were the roof, HVAC, electrical panel, plumbing, and water heater last replaced?
- Is there a deadline driving the sale (1031 exchange, divorce, estate, relocation)? That informs how much negotiation room exists.
- Schools are D-rated, which usually means shorter tenancies and higher turnover. Who's the typical renter profile here, and what's been the actual vacancy rate?
- Crime grade is F in this area — have there been break-ins, vandalism, or insurance claims at this property in the last 3 years? What carrier currently insures it and at what premium?
- What's the average days-on-market for RENTAL listings here right now (not sales)? A rising rental-DOM trend means longer vacancies and softer asking-rent achievability than the comps imply.
- What's the recent tenant-quality profile in this submarket — average credit score on applications, eviction rate, late-payment / NSF rate, and stable-employment percentage? A property-management company in the area should have these aggregated.
- How much new for-sale + rental construction is in the pipeline within 1–3 miles? Heavy new supply typically softens prices + rents 12–24 months out; constrained supply supports both.
Investment metrics
- 1% rule
- 1.23% ✓
- Cap rate
- 10.50%
- Cash-on-cash
- 15.04%
- DSCR
- 1.67
- GRM
- 6.8
CMA / ARV
- ARV (on-the-fly)
- $122,976
- Comps found
- 6
Show comp detail 6 sales within ~0.75 mi
| Address | Dist | Beds/Ba | Sqft | Sold | Price | $/sf | Match |
|---|---|---|---|---|---|---|---|
| 506 N Patterson Park Ave | 0.18mi | 3/1.5 | 640 (-5%) | 8mo | $78,000 | $122 | 76 |
| 2305 Ashland Ave | 0.26mi | 3/1.0 | 616 (-8%) | 4mo | $78,000 | $127 | 71 |
| 26 N Madeira St | 0.38mi | 2/2.0 (-1) | 672 (0%) | 7mo | $103,000 | $153 | 68 |
| 203 S Madeira St | 0.61mi | 2/1.0 (-1) | 601 (-11%) | 7mo | $110,250 | $183 | 43 |
| 313 S Duncan St | 0.74mi | 2/1.0 (-1) | 724 (+8%) | 15mo | $211,000 | $291 | 36 |
| 231-1/2 S Madeira St | 0.64mi | 2/1.5 (-1) | 770 (+15%) | 16mo | $240,000 | $312 | 26 |
Match score weights: distance 35% · size 25% · config 20% · recency 20%. Top-matched comps best support the ARV.
Projected returns pro-forma
-3.0% appreciation · 8.0% rent growth · sell at horizon
- IRR
- 10.8%
- Equity multiple
- 1.45×
- Total profit
- $18,930
- Equity at exit
- $22,365
- IRR
- 23.4%
- Equity multiple
- 3.47×
- Total profit
- $103,881
- Equity at exit
- $12,969
Cash invested: $42,000 (down + closing). Projections, not guarantees.
Landlord ↔ Tenant lean methodology
- Overall (CITY)
- 12 Strongly Tenant-Friendly
- State Maryland
- 27 Tenant-Leaning · D+14
- County
- — inherits STATE
- City Baltimore
- 12 Strongly Tenant-Friendly · D+58
ZIP-level market 21205
- Home prices YoY
- -5.8%
- Rents YoY
- 9.9%
- Active inventory
- 145
- Price-to-rent
- 6.8×
Monthly cashflow live
- Estimated rent
- $1,845 high interval (Pro) →
- Mortgage (P&I)
- −$787
- Tax from tax record
- −$82 /mo · $986/yr
- Insurance
- −$62
- HOA
- −$0
- Vacancy / Maint / Mgmt
- −$387
- Net cashflow
- $526
Break-even live
Sensitivity live
| Price | -10% $611 | -5% $569 | +0% $526 | +5% $484 | +10% $441 |
|---|---|---|---|---|---|
| Rent | -10% $381 | -5% $453 | +0% $526 | +5% $599 | +10% $672 |
| Rate | -1.0pp $602 | -0.5pp $564 | base $526 | +0.5pp $487 | +1.0pp $448 |
UW: 25.0% down · 7.5% · 30yr · 1.5% tax · 5.0% vac · 8.0% maint · 8.0% mgmt
Financing live
Cash to close
- Down payment
- $37,500
- Closing costs
- $4,500
- Reserves months
- —
- Total cash needed
- —
Loan-product check · same deal, 3 products live
Conventional
25% down · 7.5% · 30yr
- Down + closing
- —
- Monthly P&I
- —
- Monthly cashflow
- —
- DSCR
- —
- Eligible?
- —
Personal DTI + credit; lowest rate.
DSCR
20% down · 8.5% · 30yr
- Down + closing
- —
- Monthly P&I
- —
- Monthly cashflow
- —
- DSCR
- —
- Eligible?
- —
No personal income docs; deal must DSCR.
Hard money
10% down · 12.0% · 12mo
- Down + closing
- —
- Monthly P&I
- —
- Monthly cashflow
- —
- DSCR
- —
- Eligible?
- —
Short-term bridge; refi at stabilization.
Rent comps 12 comps
| Address | Beds | Baths | Sqft | Rent | $/sqft | DOM | Units | Dist |
|---|---|---|---|---|---|---|---|---|
| 500 N Rose St Baltimore, MD | 3.0 | 2.0 | 520 | $1,200 | $2.31 | 6d | 1 | 0.07mi |
| 2221 E Preston St Baltimore, MD | 2.0 | 1.0 | 658 | $1,200 | $1.82 | 25d | 1 | 0.57mi |
| 305 S Collington Ave Baltimore, MD | 3.0 | 2.5 | 722 | $2,895 | $4.01 | 19d | 1 | 0.75mi |
| 2410 E Federal St Baltimore, MD | 4.0 | 2.0 | 720 | $2,200 | $3.06 | 25d | 1 | 0.77mi |
| 1607 Hakesley Pl Baltimore, MD | 3.0 | 1.0 | 720 | $1,400 | $1.94 | 45d | 1 | 0.88mi |
| 520 Somerset St Baltimore, MD | 1.0–2.0 | 1.0–2.0 | 634 | $1,578 | $2.49 | 45d | 1 | 1.03mi |
| 210 S Caroline St Baltimore, MD | 1.0–2.0 | 1.0 | 808 | $1,965 | $2.43 | 45d | 23 | 1.07mi |
| 622 S Broadway Baltimore, MD | 2.0 | 1.0–2.0 | 953 | $2,998 | $3.14 | 0d | 12 | 1.16mi |
| 3905 Bank St Baltimore, MD | 4.0 | 1.0–3.0 | 909 | $2,828 | $3.11 | 0d | 18 | 1.21mi |
| 3610 Dillon St Baltimore, MD | 1.0–2.0 | 1.0–2.0 | 828 | $2,820 | $3.41 | 45d | 1 | 1.40mi |
| 555 President St Baltimore, MD | 3.0 | 1.0–4.0 | 1352 | $5,438 | $4.02 | 0d | 1 | 1.41mi |
| 1100 Greenmount Ave Baltimore, MD | 1.0–3.0 | 1.0–2.0 | 839 | $2,584 | $3.08 | 4d | 1 | 1.43mi |
Listing history 7 events
-
2026-06-21days on market $150,000 Active 10 DOM
-
2026-06-18days on market $150,000 Active 7 DOM
-
2026-06-17days on market $150,000 Active 6 DOM
-
2026-06-16days on market $150,000 Active 5 DOM
-
2026-06-15days on market $150,000 Active 4 DOM
-
2026-06-13remarks 693-char remark
-
2026-06-13$150,000 Active 2 DOM
ⓘ Source: listings_history table (triggers on properties + properties_extension) + one-shot
backfill from property_details.listing_events for pre-trigger history.
Tax reassessment forecast MD · Partial reset (capped growth)
- Current annual tax
- $986 · $82/mo
- Projected year-2 tax
- $1,311 · $109/mo
- Expected delta
- +$324/yr (+$27/mo · 32.9%)
ⓘ Screening estimate from a state-policy table — verify with the county assessor before closing.
Climate risk First Street
- Flood 1/10 Low FEMA zone X (unshaded) · 0% chance over 30 yrs
- Wildfire 1/10 Low
- Heat 8/10 Severe 7 d/yr ≥103°F today · 15 d/yr by 30 yrs out
- Wind 6/10 Major 27% chance of damaging wind over 30 yrs
- Air quality 4/10 Moderate 6 unhealthy d/yr today · 7 by 30 yrs out
Nearby sold comps map
Loading sold comps map…
Walkable amenities ~0.75 mi
Loading nearby amenities…
Taxation est. · year 1
- Rental income
- $22,142
- − Mortgage interest
- −$8,402
- − Property taxes
- −$986
- − Insurance
- −$750
- − Repairs & maintenance
- −$1,771
- − Management
- −$1,771
- − Depreciation
- −$4,364
- Taxable income
- $4,096
- Est. tax owed @ 24.0%
- −$983
- After-tax cash flow
- $5,333/yr
For passive investors: Depreciation is non-cash, so a rental often shows a tax loss while cash-flowing — sheltering income. Rental losses are passive: they offset passive income freely, and up to $25,000/yr can offset ordinary (W-2) income if you actively participate and your MAGI is under $100k (phasing out to $0 by $150k); unused losses carry forward. On sale, claimed depreciation is recaptured at up to 25%, and gains may owe capital-gains tax (a 1031 exchange can defer both). Figures are a year-1 estimate at your 24.0% rate — not tax advice; consult a CPA.
Schools (NCES district)
- District
- Baltimore City Public Schools
- NCES district ID
- 2400090
- Math proficiency
- 7% ▼ -9.00%
- Reading proficiency
- 16% ▼ -5.00%
- Median HH income
- $42,108
- Composite
- 10.08/100
- National rank
- #9805
- State rank
- #24 of 24 in MD
Livability — Baltimore
- Score
- 76/100
- State rank
- #90
- US rank
- #3396
Category grades
Schools grade is shown separately in the Schools card above.
Census & demographics
- Census place
- Baltimore, MD
- County
- Baltimore City · 558,601 people
- City population
- 588,727
- Metro
- Baltimore-Columbia-Towson, MD
- Population (ZIP)
- 13,013
- Household income
- $43,176
- Rent vs Own
- Severe rent burden
- 966.0
Population outlook (Baltimore County) Hauer SSP2
- Today (2025)
- 624,249 people
- By 2030
- 621,541 · -0.4%
- By 2040
- 609,756 · -2.3%
- By 2050
- 597,249 · -4.3%
- By 2075
- 552,236 · -11.5%
- By 2100
- 513,934 · -17.7%
Race, ethnicity, and origin ACS 2023
- Neighborhood character
- Diverse neighborhood (Simpson 0.60)
- Race & ethnicity
- Black 60% Hispanic / Latino 16% White 14% Two or more races 11% Asian 3%
- Hispanic origin (detail)
- Mexican 1% Cuban 1% Dominican 4%
- Common ancestry
- Slovak 3% Romanian 1%
- Foreign-born
- 16% · Canada, China
- Languages at home
- 79% English-only · Spanish 11% Arabic 4% Chinese 1%
Political lean MEDSL · Baltimore
- 2024 margin
- Solid D (+73.0) · D 85.2% · R 12.2% · Other 2.6%
- 2008→2024 swing
- -2.5pp toward R · 2008: 75.5pp · 2024: 73.0pp
- All cycles
- 2024: D+73.0 2020: D+76.6 2016: D+74.6 2012: D+76.4 2008: D+75.5
Not yet ingested
- Civics
- —
Market trends
- HPI YoY
- ▼ -15.03%
- Current HPI
- 244.1345
- Rent YoY
- ▲ 9.88%
- Metro
- Baltimore-Columbia-Towson, MD
- State GDP YoY
- ▲ 2.97%
- F500 in state
- 12
Industry mix (Fortune 500 HQ in MD)
| Industry | F500 HQs | Revenue |
|---|---|---|
| Aerospace / Defense | 1 | $71B |
|
||
| Utilities | 1 | $25B |
|
||
| Hotels | 1 | $24B |
|
||
| Consumer Goods | 1 | $7B |
|
||
| Real Estate | 1 | $6B |
|
||
| Chemicals | 1 | $2B |
|
||
Price history
+354.5% since first listed20 events — show timeline
- 2026-06-11 Listed $150,000 BRIGHT MLS
- 2025-01-17 Sold (Public Records) $1,250,000 Public Records
- 2024-10-09 Price Changed $109,900 BRIGHT MLS
- 2024-10-08 Sold (MLS) $89,286 BRIGHT MLS
- 2024-01-07 Pending — BRIGHT MLS
- 2023-07-28 Price Changed $119,900 BRIGHT MLS
- 2023-07-28 Relisted — BRIGHT MLS
- 2023-05-18 Pending — BRIGHT MLS
- 2023-05-18 Price Changed $140,000 BRIGHT MLS
- 2023-05-10 Listed $119,900 BRIGHT MLS
- 2019-04-16 Sold (Public Records) $694,000 Public Records
- 2008-03-05 Sold (MLS) $47,075 MRIS
- 2008-01-24 Delisted — MRIS
- 2007-10-28 Price Changed $46,075 MRIS
- 2007-07-22 Listed $51,000 MRIS
- 2000-03-06 Sold (Public Records) $61,500 Public Records
- 1999-03-17 Sold (MLS) $61,500 MRIS
- 1998-11-19 Delisted — MRIS
- 1998-10-09 Listed $59,900 MRIS
- 1987-09-09 Sold (Public Records) $33,000 Public Records
Property tax history
-2.8%/yrLatest (2025): $986 · +15.6% YoY. Source: county tax records.
Cash-flow waterfall
monthlySold comps — $/sqft
last 12 mo · ≤1 miLoading sold comps…