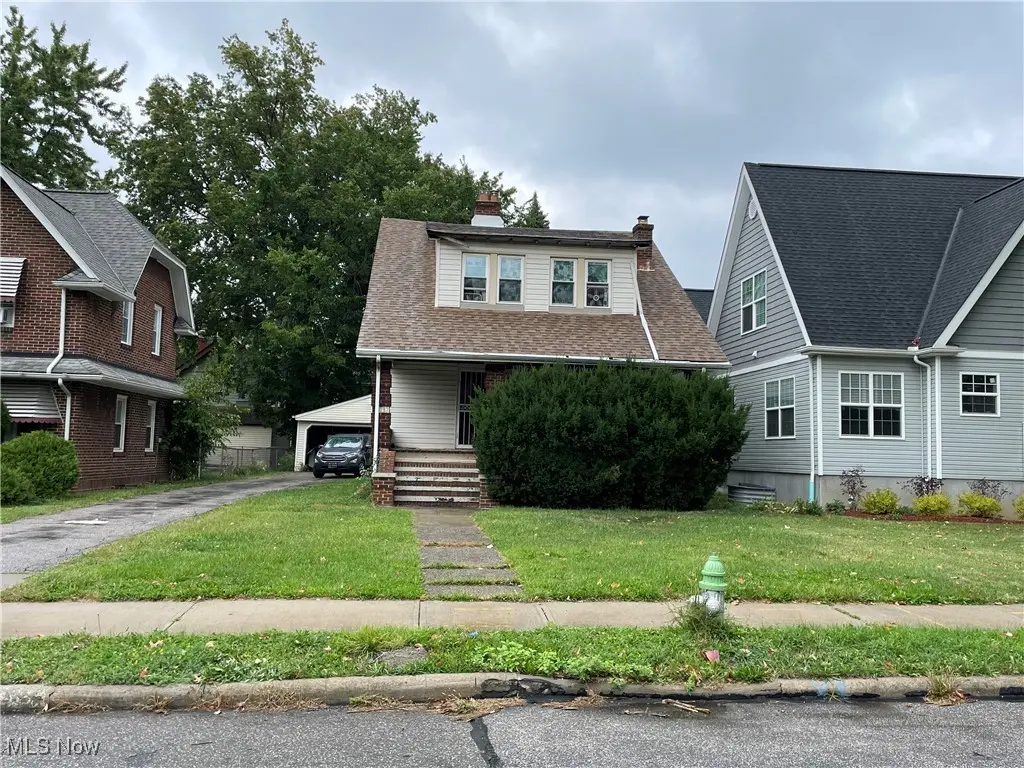
2137 N Taylor Rd · Cleveland Heights, OH
Flood risk 1/10 · Minimal
- FEMA flood zone
- X (unshaded)
- Chance of flooding over 30 yrs
- 0.0%
- Est. flood insurance / yr
- $473 – $860
Fire risk 1/10 · Minimal
- Est. fire insurance / yr
- $713 – $1,323
Heat risk 3/10 · Minor
- Hot days now (above 95°F)
- 6 days/yr
- Hot days in 30 yrs
- 15 days/yr
Wind risk 1/10 · Minimal
- Chance of severe wind over 30 yrs
- —
Air-quality risk 3/10 · Minor
- Unhealthy air days now
- 3 days/yr
- Unhealthy air days in 30 yrs
- 5 days/yr
Risk factors via First Street. Map © Google.
Why this score? — see what drove the B grade
The composite is a weighted blend of 9 inputs, each scored 0–100. Each bar is that input's sub-score; the figure is the points it added to the 100-point composite (weight × sub-score).
- Cash flow +27.9/30.0
- ARV discount +15.0/15.0
- 1% rule +10.0/10.0
- DSCR +9.9/10.0
- Livability +4.5/5.0
- Rent growth +3.8/5.0
- Condition / age +2.5/5.0
- Schools +0.7/10.0
- Appreciation +0.0/10.0
$99,900
🖨 Deal sheet (PDF) 📄 Offer letter ✓ Due diligence
Listing remarks MLS
Welcome INVESTORS and handy HOMEBUYERS!! Looking to complete smaller projects or hold as an addition to start a rental portfolio. Property has updated features, being sold in as-is in current condition. Buyer will assume any point of sale violations from the City of Cleveland Heights. No Wholesalers, No Blind Offers, and NO subject too.
Key facts
- 6,111 sq ft lot
- 2 garage spots
- Built 1925
Neighborhood map
What this means for you Summary
Snapshot
- This is a 3-bed/1.0-bath single-family listed at $100k.
Deal economics
- At list price, monthly cash flow is $306 ($4k/yr) — positive.
- The deal already cash-flows at list — no discount required.
- Meets the 1% rule at list price ($2k rent vs $100k).
- Recommended offer: $88k (12.0% below list) — sets the bar for market timing.
- Cap rate 10.0% vs local median 4.4% in Cleveland Heights — top-decile yield for the area; either an underpriced asset or a hidden risk that comps aren't pricing in. Stress-test before assuming the spread holds.
Location & tenants
- Location reads 89/100 on livability (#12 in OH, #124 nationally) — a professional / high-income tenant draw. Strengths: amenities A+, commute A+, cost of living A+.
- East Cleveland City School District (suburban): math 4% / reading 17% proficiency, ranked #652 of 656 in OH (top 99%) — low school quality limits family demand, transient renter base, plan for 1-2y turnover; 92% free/reduced lunch — lower-income household profile, screen leases tightly.
- Market conditions: Rents rising fast (+5.2%/yr); 99 active listings in the ZIP; 40 comparable units currently listed for rent nearby; rentals at typical pace (median 17d on market — plan ~3-4 weeks tenant-placement turnaround); lower-income renter base — watch delinquency; 1,441 units permitted in Cuyahoga County in 2024 (700 in 5+ unit buildings).
- At $1,543/mo this rent would consume 64% of the median local household income ($29k/yr) (locally 1702% of renters already pay >50% of income on rent) — very limited rent-growth headroom before tenants either downsize or default.
Forward outlook
- Local home prices are declining (-3.0%/yr); year-one equity from $691 of loan paydown is wiped out by about $3k of value loss. Plan a longer hold.
- Cuyahoga County population projected to shrink 8% by 2050 — rents likely to lag national; underwrite the cash flow, not the appreciation.
- At projected returns (-3.0% appreciation + 5.2% rent growth), your $28k cash investment doubles in ~8 years — after that, you're playing with house money.
Negotiation context
- It's been on market 261 days — a 12% lower offer ($88k) is reasonable based on typical stale-listing flexibility.
- 9 sale attempts since 5y ago with the ask held roughly flat each time — persistent listings suggest the price (not the market) is what's stuck; bring a comps-based counter.
- Current owner paid $22k; list at $100k implies a 344% gain — meaningful room to come down on a strong offer.
Risks & watch-outs
- Watch-outs: property tax is 4.2% of price; built in 1925 — expect roof / HVAC / electrical / plumbing capex.
Questions for the listing agent
- It's been on market 261 days. Have you received any prior offers? Is the seller open to a 12% concession, seller financing, or rate buy-down credit?
- Built in 1925 — when were the roof, HVAC, electrical panel, plumbing, and water heater last replaced?
- Property tax is high relative to price — has the assessment been appealed recently, and will the sale trigger a re-assessment?
- Why hasn't it sold? Are there any deal-killer items the seller is aware of (foundation, flood, title, zoning, code violations)?
- Is there a deadline driving the sale (1031 exchange, divorce, estate, relocation)? That informs how much negotiation room exists.
- Schools are A-rated — typically a magnet for longer-tenancy family renters. What's the average tenant stay here, and is there a school-zone premium baked into asking?
- What's the average days-on-market for RENTAL listings here right now (not sales)? A rising rental-DOM trend means longer vacancies and softer asking-rent achievability than the comps imply.
- What's the recent tenant-quality profile in this submarket — average credit score on applications, eviction rate, late-payment / NSF rate, and stable-employment percentage? A property-management company in the area should have these aggregated.
- How much new for-sale + rental construction is in the pipeline within 1–3 miles? Heavy new supply typically softens prices + rents 12–24 months out; constrained supply supports both.
Investment metrics
- 1% rule
- 1.54% ✓
- Cap rate
- 9.97%
- Cash-on-cash
- 13.15%
- DSCR
- 1.59
- GRM
- 5.4
CMA / ARV
- ARV (median comp)
- $133,027
- List price
- $99,900
- Delta
- -24.90%
- Verdict
- UNDERPRICED
- Comps
- 20 within 1.0 mi
Show comp detail 12 sales within ~0.75 mi
| Address | Dist | Beds/Ba | Sqft | Sold | Price | $/sf | Match |
|---|---|---|---|---|---|---|---|
| 945 Dresden Rd | 0.14mi | 3/1.0 | 1,344 (-2%) | 3mo | $85,000 | $63 | 87 |
| 965 Whitby Rd | 0.36mi | 3/1.0 | 1,355 (-2%) | 2mo | $120,000 | $89 | 78 |
| 1073 Woodview Rd | 0.51mi | 3/1.0 | 1,408 (+2%) | 1mo | $175,000 | $124 | 72 |
| 1004 Woodview Rd | 0.46mi | 3/1.0 | 1,309 (-5%) | 1mo | $91,000 | $70 | 69 |
| 2145 N Taylor Rd | 0.01mi | 3/2.5 | 1,579 (+14%) | 1mo | $272,900 | $173 | 68 |
| 3570 Randolph Rd | 0.74mi | 3/1.0 | 1,286 (-7%) | 1mo | $147,500 | $115 | 53 |
| 15991 Henley Rd | 0.41mi | 3/2.5 | 1,560 (+13%) | 2mo | $250,000 | $160 | 51 |
| 953 Whitby Rd | 0.37mi | 2/1.5 (-1) | 1,188 (-14%) | 3mo | $145,000 | $122 | 50 |
| 952 Elbon Rd | 0.55mi | 3/2.0 | 1,222 (-11%) | 2mo | $162,000 | $133 | 49 |
| 3454 Monticello Blvd | 0.55mi | 3/2.5 | 1,572 (+14%) | 1mo | $210,000 | $134 | 44 |
| 994 Yellowstone Ave | 0.73mi | 3/2.0 | 1,190 (-14%) | 2mo | $140,000 | $118 | 37 |
| 3513 Boynton Rd | 0.66mi | 3/3.0 | 1,178 (-15%) | 2mo | $268,900 | $228 | 35 |
Match score weights: distance 35% · size 25% · config 20% · recency 20%. Top-matched comps best support the ARV.
Projected returns pro-forma
-3.0% appreciation · 5.16% rent growth · sell at horizon
- IRR
- 6.2%
- Equity multiple
- 1.25×
- Total profit
- $6,916
- Equity at exit
- $14,895
- IRR
- 17.8%
- Equity multiple
- 2.66×
- Total profit
- $46,493
- Equity at exit
- $8,638
Cash invested: $27,972 (down + closing). Projections, not guarantees.
Landlord ↔ Tenant lean methodology
- Overall (STATE)
- 73 Landlord-Friendly
- State Ohio
- 73 Landlord-Friendly · R+6
- County
- — inherits STATE
- City
- — inherits STATE
ZIP-level market 44112
- Rents YoY
- 5.2%
- Active inventory
- 99
- Price-to-rent
- 5.4×
Monthly cashflow live
- Estimated rent
- $1,543 high interval (Pro) →
- Mortgage (P&I)
- −$524
- Tax from tax record
- −$347 /mo · $4,160/yr
- Insurance
- −$42
- HOA
- −$0
- Vacancy / Maint / Mgmt
- −$324
- Net cashflow
- $306
Break-even live
Sensitivity live
| Price | -10% $363 | -5% $335 | +0% $306 | +5% $278 | +10% $250 |
|---|---|---|---|---|---|
| Rent | -10% $185 | -5% $246 | +0% $306 | +5% $367 | +10% $428 |
| Rate | -1.0pp $357 | -0.5pp $332 | base $306 | +0.5pp $281 | +1.0pp $254 |
UW: 25.0% down · 7.5% · 30yr · 1.5% tax · 5.0% vac · 8.0% maint · 8.0% mgmt
Financing live
Cash to close
- Down payment
- $24,975
- Closing costs
- $2,997
- Reserves months
- —
- Total cash needed
- —
Loan-product check · same deal, 3 products live
Conventional
25% down · 7.5% · 30yr
- Down + closing
- —
- Monthly P&I
- —
- Monthly cashflow
- —
- DSCR
- —
- Eligible?
- —
Personal DTI + credit; lowest rate.
DSCR
20% down · 8.5% · 30yr
- Down + closing
- —
- Monthly P&I
- —
- Monthly cashflow
- —
- DSCR
- —
- Eligible?
- —
No personal income docs; deal must DSCR.
Hard money
10% down · 12.0% · 12mo
- Down + closing
- —
- Monthly P&I
- —
- Monthly cashflow
- —
- DSCR
- —
- Eligible?
- —
Short-term bridge; refi at stabilization.
Rent comps 40 comps
| Address | Beds | Baths | Sqft | Rent | $/sqft | DOM | Units | Dist |
|---|---|---|---|---|---|---|---|---|
| 910 Dresden Rd Cleveland, OH | 4.0 | 2.0 | 1839 | $1,800 | $0.98 | 17d | 1 | 0.15mi |
| 983 Greyton Rd Cleveland, OH | 3.0 | 2.0 | 1457 | $1,495 | $1.03 | 17d | 1 | 0.28mi |
| 886 Helmsdale Rd Cleveland Heights, OH | 2.0 | 1.0 | 1037 | $995 | $0.96 | 17d | 1 | 0.29mi |
| 3337 Sylvanhurst Rd Cleveland, OH | 3.0 | 1.0 | 1334 | $1,800 | $1.35 | 8d | 1 | 0.30mi |
| 915 Nela View Rd Cleveland, OH | 4.0 | 1.0 | 1300 | $2,600 | $2.00 | 17d | 1 | 0.30mi |
| 876 Eloise Dr Unit Upper Cleveland Heights, OH | 2.0 | 1.0 | 1233 | $1,200 | $0.97 | 17d | 1 | 0.31mi |
| 953 Whitby Rd Cleveland, OH | 3.0 | 2.0 | 1188 | $1,575 | $1.33 | 24d | 1 | 0.36mi |
| 3430 Winsford Rd Cleveland, OH | 4.0 | 1.5 | 1800 | $1,590 | $0.88 | 17d | 1 | 0.39mi |
| 967 Selwyn Rd Cleveland, OH | 3.0 | 1.5 | 1214 | $1,595 | $1.31 | 17d | 1 | 0.41mi |
| 963 Selwyn Rd Cleveland, OH | 4.0 | 1.0 | 1300 | $2,650 | $2.04 | 2d | 1 | 0.41mi |
| 3406 Henderson Rd Cleveland, OH | 4.0 | 1.5 | 1343 | $2,250 | $1.68 | 17d | 1 | 0.43mi |
| 1099 Woodview Rd Cleveland, OH | 4.0 | 1.0 | 1500 | $2,500 | $1.67 | 2d | 1 | 0.52mi |
| 16000 Terrace Rd Cleveland, OH | 1.0–3.0 | 1.0–2.0 | 1000 | $1,210 | $1.21 | 2d | 39 | 0.55mi |
| 1007 Elbon Rd Cleveland, OH | 3.0 | 1.0 | 1386 | $1,400 | $1.01 | 11d | 1 | 0.56mi |
| 1035 Elbon Rd Cleveland, OH | 4.0 | 1.5 | 1304 | $1,675 | $1.28 | 17d | 1 | 0.57mi |
| 2401 N Taylor Rd Cleveland, OH | 3.0 | 1.0 | 1347 | $1,325 | $0.98 | 8d | 1 | 0.62mi |
| 994 Yellowstone Rd Cleveland, OH | 3.0 | 2.0 | 1475 | $1,395 | $0.95 | 2d | 1 | 0.73mi |
| 15421 Plymouth Pl East Cleveland, OH | 2.0 | 1.0 | 950 | $972 | $1.02 | 44d | 1 | 0.74mi |
| 1726 Taylor Rd East Cleveland, OH | 2.0 | 1.0 | 900 | $972 | $1.08 | 44d | 1 | 0.75mi |
| 14312 Scioto Ave Cleveland, OH | 3.0 | 1.0 | 1090 | $1,300 | $1.19 | 5d | 1 | 0.97mi |
| 1286 E 152nd St Cleveland, OH | 2.0 | 1.0 | 1638 | $1,095 | $0.67 | 44d | 1 | 0.98mi |
| 14813 Alder Ave Cleveland, OH | 3.0 | 1.0 | 1188 | $1,150 | $0.97 | 24d | 1 | 0.99mi |
| 14200 Scioto Ave Cleveland, OH | 3.0 | 1.0 | 1256 | $1,350 | $1.07 | 17d | 1 | 1.03mi |
| 14205 Savannah Ave Cleveland, OH | 3.0 | 1.0 | 1160 | $1,350 | $1.16 | 17d | 1 | 1.06mi |
| 14009 Mayfair Ave Unit 2 East Cleveland, OH | 4.0 | 2.0 | 1144 | $1,390 | $1.22 | 44d | 1 | 1.07mi |
| 35 Severance Cir Cleveland Heights, OH | 1.0–2.0 | 1.0–2.0 | 832 | $1,570 | $1.89 | 2d | 26 | 1.08mi |
| 14005 Scioto Ave Cleveland, OH | 3.0 | 1.0 | 1056 | $1,570 | $1.49 | 17d | 1 | 1.10mi |
| 13900 Potomac Ave Cleveland, OH | 3.0 | 1.0 | 1172 | $1,355 | $1.16 | 24d | 1 | 1.16mi |
| 3808 Kirkwood Rd Cleveland, OH | 4.0 | 1.5 | 1740 | $2,150 | $1.24 | 15d | 1 | 1.17mi |
| 30 Severance Cir Cleveland Heights, OH | 1.0–2.0 | 1.0–2.0 | 762 | $1,700 | $2.23 | 3d | 18 | 1.23mi |
| 3810 Parkdale Rd Cleveland, OH | 3.0 | 1.5 | 1281 | $2,067 | $1.61 | 3d | 1 | 1.24mi |
| 14120 Superior Rd Cleveland, OH | 3.0 | 1.0 | 1390 | $1,400 | $1.01 | 44d | 1 | 1.27mi |
| 3755 Mayfield Rd Cleveland Heights, OH | 1.0–2.0 | 1.0 | 800 | $1,175 | $1.47 | 24d | 1 | 1.28mi |
| 3802 Princeton Blvd Cleveland, OH | 3.0 | 1.5 | 1656 | $2,275 | $1.37 | 2d | 1 | 1.29mi |
| 3917 Bluestone Rd Cleveland, OH | 4.0 | 1.5 | 1700 | $1,650 | $0.97 | 22d | 1 | 1.29mi |
| 14172 Superior Rd Unit 2 Cleveland Heights, OH | 2.0 | 1.0 | 1446 | $1,195 | $0.83 | 24d | 1 | 1.30mi |
| 14172 Superior Rd Unit 1 Cleveland Heights, OH | 3.0 | 1.0 | 1446 | $1,295 | $0.90 | 24d | 1 | 1.30mi |
| 1459 E 134th St Unit up East Cleveland, OH | 2.0 | 1.0 | 1150 | $850 | $0.74 | 11d | 1 | 1.34mi |
| 1605 Hillcrest Rd Cleveland, OH | 2.0 | 1.0 | 1180 | $1,245 | $1.06 | 17d | 1 | 1.34mi |
| 1545 Glenmont Rd Unit 1 East Cleveland, OH | 2.0 | 1.0 | 1428 | $800 | $0.56 | 24d | 1 | 1.35mi |
Listing history 39 events
-
2026-06-18days on market $99,900 Active 261 DOM
-
2026-06-17days on market $99,900 Active 260 DOM
-
2026-06-16days on market $99,900 Active 259 DOM
-
2026-06-15days on market $99,900 Active 258 DOM
-
2026-06-13days on market $99,900 Active 256 DOM
-
2026-06-13days on market $99,900 Active 255 DOM
-
2026-06-09days on market $99,900 Active 252 DOM
-
2026-06-08days on market $99,900 Active 251 DOM
-
2026-06-07days on market $99,900 Active 250 DOM
-
2026-06-05days on market $99,900 Active 247 DOM
-
2026-06-03days on market $99,900 Active 246 DOM
-
2026-06-02days on market $99,900 Active 245 DOM
-
2026-06-01days on market $99,900 Active 244 DOM
-
2026-05-31days on market $99,900 Active 243 DOM
-
2025-09-30$99,900 Active 338-char remark
Show marketing remark (338 chars)
Welcome INVESTORS and handy HOMEBUYERS!! Looking to complete smaller projects or hold as an addition to start a rental portfolio. Property has updated features, being sold in as-is in current condition. Buyer will assume any point of sale violations from the City of Cleveland Heights. No Wholesalers, No Blind Offers, and NO subject too.
-
2025-08-25historical
-
2025-07-31price $117,900
-
2025-05-05price $122,900
-
2025-03-05price $125,900
-
2024-12-12status Active
-
2024-11-28historical Contingent
-
2024-10-13historical $1,350
-
2024-09-25$119,900 Active
-
2024-09-05historical $1,350
-
2024-09-05$1,350
-
2023-07-26$1,600
-
2023-07-25historical $1,600
-
2023-07-21historical $1,600
-
2023-07-21$1,600
-
2023-07-13historical
-
2023-04-29price $140,000
-
2023-01-13$145,000 Active
-
2022-10-29historical
-
2022-09-25price $145,000
-
2022-09-15$155,000 Active
-
2021-05-28$107,000 Active
-
2021-05-26price $107,000
-
2021-05-25historical
-
1974-08-01soldstatus $22,500
ⓘ Source: listings_history table (triggers on properties + properties_extension) + one-shot
backfill from property_details.listing_events for pre-trigger history.
Tax reassessment forecast OH · Partial reset (capped growth)
- Current annual tax
- $4,160 · $347/mo
- Projected year-2 tax
- $4,160 · $347/mo
- Expected delta
- $0/yr ($0/mo · 0.0%)
ⓘ Screening estimate from a state-policy table — verify with the county assessor before closing.
Climate risk First Street
- Flood 1/10 Low FEMA zone X (unshaded) · 0% chance over 30 yrs
- Wildfire 1/10 Low
- Heat 3/10 Moderate 6 d/yr ≥95°F today · 15 d/yr by 30 yrs out
- Wind 1/10 Low
- Air quality 3/10 Moderate 3 unhealthy d/yr today · 5 by 30 yrs out
Nearby sold comps map
Loading sold comps map…
Walkable amenities ~0.75 mi
Loading nearby amenities…
Taxation est. · year 1
- Rental income
- $18,511
- − Mortgage interest
- −$5,596
- − Property taxes
- −$4,160
- − Insurance
- −$500
- − Repairs & maintenance
- −$1,481
- − Management
- −$1,481
- − Depreciation
- −$2,906
- Taxable income
- $2,388
- Est. tax owed @ 24.0%
- −$573
- After-tax cash flow
- $3,105/yr
For passive investors: Depreciation is non-cash, so a rental often shows a tax loss while cash-flowing — sheltering income. Rental losses are passive: they offset passive income freely, and up to $25,000/yr can offset ordinary (W-2) income if you actively participate and your MAGI is under $100k (phasing out to $0 by $150k); unused losses carry forward. On sale, claimed depreciation is recaptured at up to 25%, and gains may owe capital-gains tax (a 1031 exchange can defer both). Figures are a year-1 estimate at your 24.0% rate — not tax advice; consult a CPA.
Schools (NCES district)
- District
- East Cleveland City School District
- NCES district ID
- 3904390
- Math proficiency
- 4% ▼ -16.00%
- Reading proficiency
- 17% ▼ -13.00%
- Median HH income
- $22,726
- Composite
- 7.38/100
- National rank
- #9954
- State rank
- #652 of 656 in OH
Livability — Cleveland Heights
- Score
- 89/100
- State rank
- #12
- US rank
- #124
Category grades
Schools grade is shown separately in the Schools card above.
Census & demographics
- Census place
- Cleveland Heights, OH
- County
- Cuyahoga County · 1,090,369 people
- City population
- 32,312
- Metro
- Cleveland-Elyria, OH
- Population (ZIP)
- 17,848
- Household income
- $28,799
- Rent vs Own
- Severe rent burden
- 1702.0
Population outlook (Cuyahoga County) Hauer SSP2
- Today (2025)
- 1,244,621 people
- By 2030
- 1,230,093 · -1.2%
- By 2040
- 1,189,108 · -4.5%
- By 2050
- 1,145,706 · -7.9%
- By 2075
- 1,076,557 · -13.5%
- By 2100
- 978,987 · -21.3%
Race, ethnicity, and origin ACS 2023
- Neighborhood character
- Predominantly Black (89%)
- Race & ethnicity
- Black 89% White 7% Two or more races 2% Hispanic / Latino 1%
- Common ancestry
- Lithuanian 1%
- Foreign-born
- 4% · Canada
- Languages at home
- 93% English-only · French/Haitian/Cajun 3% Spanish 2% Russian/Polish/Slavic 1%
Political lean MEDSL · Cuyahoga
- 2024 margin
- Solid D (+31.5) · D 65.4% · R 33.9%
- 2008→2024 swing
- -7.4pp toward R · 2008: 38.9pp · 2024: 31.5pp
- All cycles
- 2024: D+31.5 2020: D+34.1 2016: D+35.0 2012: D+38.7 2008: D+38.9
Not yet ingested
- Civics
- —
Market trends
- HPI YoY
- ▼ -115.61%
- Current HPI
- 67.2162
- Rent YoY
- ▲ 5.16%
- Metro
- Cleveland-Elyria, OH
- State GDP YoY
- ▲ 1.98%
- F500 in state
- 48
Industry mix (Fortune 500 HQ in OH)
| Industry | F500 HQs | Revenue |
|---|---|---|
| Insurance | 3 | $145B |
|
||
| Industrial Machinery | 3 | $49B |
|
||
| Financial Services | 3 | $24B |
|
||
| Consumer Goods | 2 | $93B |
|
||
| Aerospace / Defense | 2 | $47B |
|
||
| Utilities | 2 | $33B |
|
||
Price history
+344.0% since first listed25 events — show timeline
- 2025-09-30 Listed $99,900 MLSNOW
- 2025-08-25 Listing Removed — MLSNOW
- 2025-07-31 Price Changed $117,900 MLSNOW
- 2025-05-05 Price Changed $122,900 MLSNOW
- 2025-03-05 Price Changed $125,900 MLSNOW
- 2024-12-12 Relisted — MLSNOW
- 2024-11-28 Contingent — MLSNOW
- 2024-10-13 Rental Removed $1,350 RENTALBEAST
- 2024-09-25 Listed $119,900 MLSNOW
- 2024-09-05 Rental Removed $1,350 RENTEC
- 2024-09-05 Listed for Rent $1,350 RENTALBEAST
- 2023-07-26 Listed for Rent $1,600 RENTEC
- 2023-07-25 Rental Removed $1,600 YESMLS
- 2023-07-21 Rental Removed $1,600 RENTEC
- 2023-07-21 Listed for Rent $1,600 YESMLS
- 2023-07-13 Listing Removed — MLSNOW
- 2023-04-29 Price Changed $140,000 MLSNOW
- 2023-01-13 Listed $145,000 MLSNOW
- 2022-10-29 Listing Removed — MLSNOW
- 2022-09-25 Price Changed $145,000 MLSNOW
- 2022-09-15 Listed $155,000 MLSNOW
- 2021-05-28 Listed $107,000 MLSNOW
- 2021-05-26 Price Changed $107,000 MLSNOW
- 2021-05-25 Coming Soon — MLSNOW
- 1974-08-01 Sold (Public Records) $22,500 Public Records
Property tax history
+9.6%/yrLatest (2025): $4,160 · +30.0% YoY. Source: county tax records.
Cash-flow waterfall
monthlySold comps — $/sqft
last 12 mo · ≤1 miLoading sold comps…