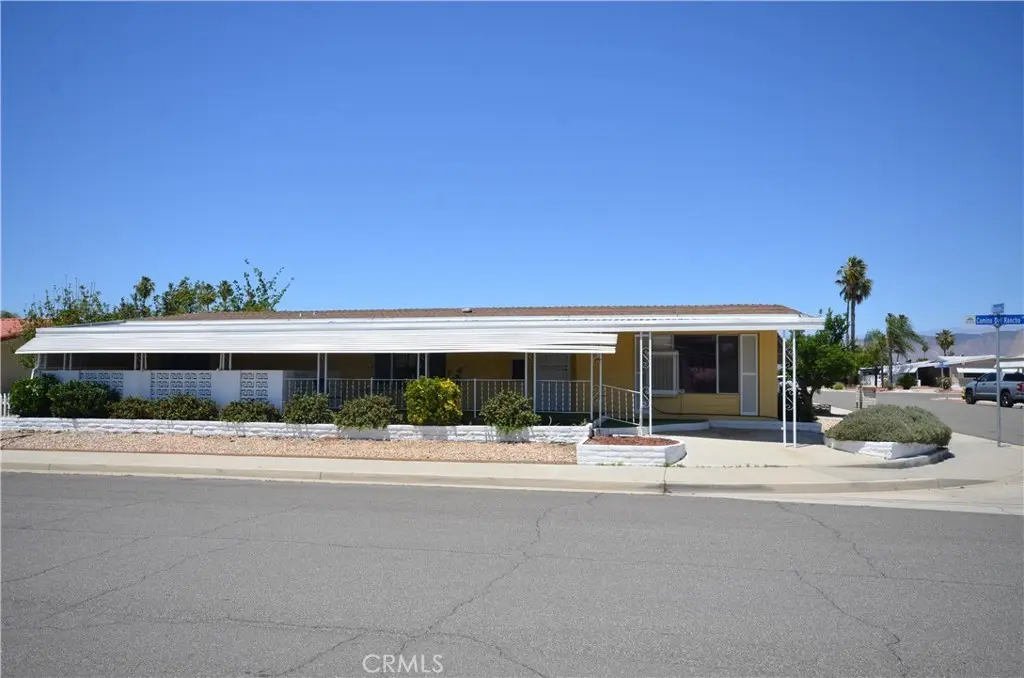
1081 San Gorgonio · Hemet, CA
Flood risk 1/10 · Minimal
- FEMA flood zone
- X (shaded)
- Chance of flooding over 30 yrs
- 0.0%
- Est. flood insurance / yr
- $507 – $1,088
Fire risk 6/10 · Moderate
- Est. fire insurance / yr
- $659 – $1,223
Heat risk 7/10 · Major
- Hot days now (above 104°F)
- 6 days/yr
- Hot days in 30 yrs
- 16 days/yr
Wind risk 1/10 · Minimal
- Chance of severe wind over 30 yrs
- —
Air-quality risk 6/10 · Moderate
- Unhealthy air days now
- 9 days/yr
- Unhealthy air days in 30 yrs
- 11 days/yr
Risk factors via First Street. Map © Google.
Why this score? — see what drove the D+ grade
The composite is a weighted blend of 9 inputs, each scored 0–100. Each bar is that input's sub-score; the figure is the points it added to the 100-point composite (weight × sub-score).
- Cash flow +23.2/30.0
- DSCR +7.5/10.0
- 1% rule +6.1/10.0
- Rent growth +2.9/5.0
- Livability +2.6/5.0
- Schools +2.5/10.0
- Condition / age +2.5/5.0
- ARV discount +0.7/15.0
- Appreciation +0.0/10.0
$180,000
🖨 Deal sheet 📄 Offer letter ✓ Due diligence
Listing remarks
Welcome to Sierra Dawn Estates, one of Hemet's most beloved 55+ communities! This charming 2 bed/2 bath double-wide offers a surprisingly spacious layout with a large open kitchen featuring abundant cabinetry, double wall oven, gas cooktop, recessed lighting, and a generous peninsula, perfect for easy living. The living area showcases beautiful wood-look laminate flooring, brand new carpet and a ceiling fan, with a bright slider overlooking the private backyard. Washer, dryer, and refrigerator included. Enjoy the enclosed garage/workshop addition, truly a rare find. Community amenities include pool, clubhouse, woodshop, and cable TV included in HOA. New blinds (2023), swamp cooler, and work
Key facts
- 4,792 sq ft lot
- Community pool
- Built 1975
Property features AI
Finance
- Other: Assessor's data used for lot and living area sources
- HOA & community: Part of an association (Sierra Dawn Estates); Monthly association fee ($185); Association amenities include: pool, spa, clubhouse, meeting room, gym/exercise room, sport court, other courts, banquet facilities, recreational/multipurpose room, dog park, common RV parking, cable TV; pet rules and pets permitted; Senior community
Exterior
- Utilities: Public sewer; District/public water
- Home design: Single-story property; Entry level: 1
- Construction: Year built source: public records
- Exterior features: Manufactured home; Corner lot; Patio-home style; Landscaped yard; Rectangular lot shape; Back yard; Park nearby; Association/community pool and spa
Interior
- Kitchen: Gas cooktop; Double oven; Appliances included
- Bedrooms: Primary bedroom on the main level; Two main-level bedrooms; All bedrooms on the ground floor
- Bathrooms: Two full bathrooms (both on the main level)
- Heating & cooling: Central furnace heating; Central gas cooling
- Interior features: One-level home with main-floor primary bedroom; Porch steps at the entry; No shared/common walls; Has a view
- Laundry & utility: Laundry area located in the kitchen; Has laundry
Neighborhood map
What this means for you Summary
Snapshot
- This is a 2-bed/2.0-bath manufactured listed at $180k.
Deal economics
- At list price, monthly cash flow is $326 ($4k/yr) — positive.
- The deal already cash-flows at list — no discount required.
- Meets the 1% rule at list price ($2k rent vs $180k).
- Recommended offer: $177k (1.5% below list) — sets the bar for market timing.
- Cap rate 8.5% vs local median 4.9% in Hemet — top-decile yield for the area; either an underpriced asset or a hidden risk that comps aren't pricing in. Stress-test before assuming the spread holds.
Location & tenants
- Location reads 51/100 on livability (#1,056 in CA) — a working-class tenant base; expect higher turnover. Strengths: housing A+; Watch: crime D+, schools F, amenities F.
- Hemet Unified (suburban): math 19% / reading 41% proficiency, ranked #360 of 517 in CA (top 70%) — families likely to look elsewhere, expect single-tenant / working-renter base with shorter leases; 66% free/reduced lunch — lower-income household profile, screen leases tightly.
- Market conditions: Rents rising (+1.8%/yr); 264 active listings in the ZIP; 36 comparable units currently listed for rent nearby; rentals at typical pace (median 19d on market — plan ~3-4 weeks tenant-placement turnaround); 9,195 units permitted in Riverside County in 2024 (1,512 in 5+ unit buildings).
- At $2,002/mo this rent would consume 49% of the median local household income ($49k/yr) (locally 2144% of renters already pay >50% of income on rent) — very limited rent-growth headroom before tenants either downsize or default.
Forward outlook
- Local home prices are declining (-3.0%/yr); year-one equity from $1k of loan paydown is wiped out by about $5k of value loss. Plan a longer hold.
- Riverside County population projected at +22% by 2050 — long-run rental-demand tailwind backs the buy-and-hold thesis.
Negotiation context
- It's been on market 17 days — a 2% lower offer ($177k) is reasonable based on typical stale-listing flexibility.
- 2 sale attempts with the ask held roughly flat each time — persistent listings suggest the price (not the market) is what's stuck; bring a comps-based counter.
- Current owner paid $70k; list at $180k implies a 157% gain — meaningful room to come down on a strong offer.
Risks & watch-outs
- Climate carrying-cost: major wildfire risk; extreme-heat days projected 6→16/yr by 2055 (HVAC capex compounding) — expect insurance premiums to compound above CPI over the hold.
Questions for the listing agent
- Built in 1975 — when were the roof, HVAC, electrical panel, plumbing, and water heater last replaced?
- What does the HOA fee cover, when was the last increase, and are there any pending special assessments or reserve-fund shortfalls?
- Is there a deadline driving the sale (1031 exchange, divorce, estate, relocation)? That informs how much negotiation room exists.
- Schools are F-rated, which usually means shorter tenancies and higher turnover. Who's the typical renter profile here, and what's been the actual vacancy rate?
- Crime grade is D in this area — have there been break-ins, vandalism, or insurance claims at this property in the last 3 years? What carrier currently insures it and at what premium?
- The area grade is low — what's the realistic commute time and amenity access for the typical tenant pool here? Any planned neighborhood developments (good or bad) we should know about?
- What's the average days-on-market for RENTAL listings here right now (not sales)? A rising rental-DOM trend means longer vacancies and softer asking-rent achievability than the comps imply.
- What's the recent tenant-quality profile in this submarket — average credit score on applications, eviction rate, late-payment / NSF rate, and stable-employment percentage? A property-management company in the area should have these aggregated.
- How much new for-sale + rental construction is in the pipeline within 1–3 miles? Heavy new supply typically softens prices + rents 12–24 months out; constrained supply supports both.
Investment metrics
- 1% rule
- 1.11% ✓
- Cap rate
- 8.47%
- Cash-on-cash
- 7.77%
- DSCR
- 1.35
- GRM
- 7.5
CMA / ARV
- ARV (median comp)
- $156,500
- List price
- $180,000
- Delta
- 15.02%
- Verdict
- OVERPRICED
- Comps
- 20 within 1.0 mi
Show comp detail 12 sales within ~0.75 mi
| Address | Dist | Beds/Ba | Sqft | Sold | Price | $/sf | Match |
|---|---|---|---|---|---|---|---|
| 1631 Bella Vis | 0.18mi | 2/2.0 | 1,440 (-2%) | 0mo | $147,115 | $102 | 88 |
| 1655 Vista Grande Dr | 0.24mi | 2/2.0 | 1,440 (-2%) | 1mo | $158,000 | $110 | 85 |
| 942 Santa Elena | 0.31mi | 2/1.5 | 1,503 (+3%) | 0mo | $144,000 | $96 | 79 |
| 1207 Sorrel Dr | 0.45mi | 2/2.0 | 1,464 (0%) | 1mo | $198,000 | $135 | 78 |
| 1279 Sorrel Dr | 0.45mi | 2/2.0 | 1,440 (-2%) | 0mo | $185,000 | $128 | 76 |
| 1288 Lodgepole | 0.47mi | 2/2.0 | 1,440 (-2%) | 1mo | $219,000 | $152 | 74 |
| 930 S Santa Victoria | 0.17mi | 3/2.0 (+1) | 1,356 (-7%) | 1mo | $140,000 | $103 | 74 |
| 1778 Burr Oak Way | 0.42mi | 3/2.0 (+1) | 1,440 (-2%) | 0mo | $190,000 | $132 | 72 |
| 725 W Thornton Ave #109 | 0.57mi | 2/2.0 | 1,440 (-2%) | 2mo | $23,900 | $17 | 69 |
| 575 S Lyon Ave #34 | 0.69mi | 2/2.0 | 1,440 (-2%) | 1mo | $62,900 | $44 | 64 |
| 601 Bermuda | 0.70mi | 3/2.0 (+1) | 1,440 (-2%) | 0mo | $300,000 | $208 | 59 |
| 1760 Santiago | 0.54mi | 2/2.0 | 1,248 (-15%) | 0mo | $118,000 | $95 | 50 |
Match score weights: distance 35% · size 25% · config 20% · recency 20%. Top-matched comps best support the ARV.
Projected returns pro-forma
-3.0% appreciation · 1.76% rent growth · sell at horizon
- IRR
- -5.9%
- Equity multiple
- 0.79×
- Total profit
- $-10,825
- Equity at exit
- $26,839
- IRR
- 2.2%
- Equity multiple
- 1.15×
- Total profit
- $7,597
- Equity at exit
- $15,563
Cash invested: $50,400 (down + closing). Projections, not guarantees.
Landlord ↔ Tenant lean methodology
- Overall (STATE)
- 18 Strongly Tenant-Friendly
- State California
- 18 Strongly Tenant-Friendly · D+13
- County
- — inherits STATE
- City
- — inherits STATE
ZIP-level market 92543
- Home prices YoY
- -26.7%
- Rents YoY
- 1.8%
- Active inventory
- 264
- Price-to-rent
- 7.5×
Monthly cashflow live
- Estimated rent
- $2,002 high interval (Pro) →
- Mortgage (P&I)
- −$944
- Tax from tax record
- −$52 /mo · $620/yr
- Insurance
- −$75
- HOA
- −$185
- Vacancy / Maint / Mgmt
- −$420
- Net cashflow
- $326
Break-even live
UW: 25.0% down · 7.5% · 30yr · 1.5% tax · 5.0% vac · 8.0% maint · 8.0% mgmt
Financing live
Cash to close
- Down payment
- $45,000
- Closing costs
- $5,400
- Reserves months
- —
- Total cash needed
- —
Loan-product check · same deal, 3 products live
Conventional
25% down · 7.5% · 30yr
- Down + closing
- —
- Monthly P&I
- —
- Monthly cashflow
- —
- DSCR
- —
- Eligible?
- —
Personal DTI + credit; lowest rate.
DSCR
20% down · 8.5% · 30yr
- Down + closing
- —
- Monthly P&I
- —
- Monthly cashflow
- —
- DSCR
- —
- Eligible?
- —
No personal income docs; deal must DSCR.
Hard money
10% down · 12.0% · 12mo
- Down + closing
- —
- Monthly P&I
- —
- Monthly cashflow
- —
- DSCR
- —
- Eligible?
- —
Short-term bridge; refi at stabilization.
Rent comps 36 comps
| Address | Beds | Baths | Sqft | Rent | $/sqft | DOM | Units | Dist |
|---|---|---|---|---|---|---|---|---|
| 120 Santa Lucia Dr Hemet, CA | 2.0 | 2.0 | 1197 | $1,600 | $1.34 | 43d | 1 | 0.31mi |
| 101 San Mateo Cir Hemet, CA | 2.0 | 2.0 | 1152 | $1,725 | $1.50 | 16d | 1 | 0.35mi |
| 1025 S Gilbert St Hemet, CA | 1.0–2.0 | 1.0–2.0 | 890 | $2,320 | $2.61 | 2d | 8 | 0.46mi |
| 1521 W Westmont Ave Hemet, CA | 2.0 | 2.0 | 1197 | $2,000 | $1.67 | 43d | 1 | 0.49mi |
| 1005 S Gilbert St Hemet, CA | 2.0 | 1.5 | 975 | $1,825 | $1.87 | 24d | 2 | 0.50mi |
| 876 W Whittier Ave Unit 878 Hemet, CA | 2.0 | 2.0 | 1127 | $2,150 | $1.91 | 24d | 1 | 0.55mi |
| 1241 Sandlewood Dr Hemet, CA | 2.0 | 1.5 | 1504 | $2,000 | $1.33 | 43d | 1 | 0.55mi |
| 1955 Silver Oak Way Hemet, CA | 3.0 | 2.0 | 1318 | $2,250 | $1.71 | 43d | 1 | 0.57mi |
| 611 S Palm Ave Unit K Hemet, CA | 2.0 | 2.0 | 1254 | $1,895 | $1.51 | 7d | 1 | 0.59mi |
| 735 S Gilbert St Hemet, CA | 3.0 | 2.0 | 1202 | $2,400 | $2.00 | 43d | 1 | 0.65mi |
| 1461 W Mayberry Ave Hemet, CA | 2.0 | 2.0 | 1044 | $1,750 | $1.68 | 43d | 1 | 0.70mi |
| 716 Robert Dr Hemet, CA | 3.0 | 2.0 | 1450 | $2,300 | $1.59 | 5d | 1 | 0.74mi |
| 471 Whitney Dr Hemet, CA | 2.0 | 2.0 | 1085 | $1,800 | $1.66 | 5d | 1 | 0.77mi |
| 1850 Amberwood Dr Hemet, CA | 2.0 | 2.0 | 1170 | $1,561 | $1.33 | 43d | 1 | 0.79mi |
| 471 S Simpson Ave Unit D Hemet, CA | 2.0 | 2.0 | 900 | $1,750 | $1.94 | 43d | 1 | 0.80mi |
| 683 Jonquil St Hemet, CA | 3.0 | 2.0 | 1150 | $2,448 | $2.13 | 24d | 1 | 0.87mi |
| 415 S Tahquitz Ave Hemet, CA | 3.0 | 2.0 | 1766 | $2,900 | $1.64 | 18d | 1 | 0.89mi |
| 424 W Mayberry Ave Unit 1 Hemet, CA | 1.0 | 1.0 | 1664 | $850 | $0.51 | 7d | 1 | 0.90mi |
| 390 Magnolia Cir Hemet, CA | 2.0 | 2.0 | 1038 | $2,400 | $2.31 | 4d | 1 | 0.96mi |
| 853 Douglas Ct Hemet, CA | 2.0 | 2.0 | 1148 | $1,850 | $1.61 | 4d | 1 | 0.97mi |
| 409 E Thornton Ave Hemet, CA | 2.0 | 1.0 | 970 | $1,912 | $1.97 | 2d | 2 | 0.98mi |
| 363 S Gilbert St Hemet, CA | 3.0 | 2.0 | 1200 | $1,900 | $1.58 | 4d | 1 | 0.99mi |
| 363 S Gilbert St Unit B Hemet, CA | 3.0 | 2.0 | 1200 | $1,900 | $1.58 | 14d | 1 | 0.99mi |
| 860 Douglas Ct Hemet, CA | 2.0 | 2.0 | 1114 | $1,850 | $1.66 | 18d | 1 | 1.00mi |
| 1354 Jasmine Way Hemet, CA | 2.0 | 2.0 | 1440 | $1,650 | $1.15 | 43d | 1 | 1.02mi |
| 2971 Pembroke Ave Hemet, CA | 3.0 | 2.0 | 1572 | $3,000 | $1.91 | 18d | 1 | 1.06mi |
| 2098 W Acacia Ave Hemet, CA | 1.0–3.0 | 1.0–2.0 | 895 | $2,035 | $2.27 | 1d | 1 | 1.09mi |
| 640 Vista del Monte Hemet, CA | 3.0 | 2.0 | 1480 | $2,650 | $1.79 | 43d | 1 | 1.12mi |
| 678 Monterey Pl Hemet, CA | 2.0 | 2.0 | 1047 | $1,995 | $1.91 | 43d | 1 | 1.13mi |
| 2403 W Acacia Ave Hemet, CA | 2.0 | 2.0 | 910 | $1,995 | $2.19 | 7d | 1 | 1.15mi |
| 2469 W Acacia Ave Hemet, CA | 2.0 | 2.0 | 910 | $1,750 | $1.92 | 24d | 1 | 1.16mi |
| 700 Johnston Ave Unit 708 Hemet, CA | 2.0 | 1.0 | 1000 | $1,600 | $1.60 | 7d | 1 | 1.19mi |
| 2971 Peach Tree St Hemet, CA | 3.0 | 2.0 | 1834 | $2,395 | $1.31 | 43d | 1 | 1.23mi |
| 1315 W Latham Ave Hemet, CA | 3.0 | 2.5 | 1340 | $2,550 | $1.90 | 43d | 1 | 1.28mi |
| 250 N Elk St Hemet, CA | 2.0 | 1.0 | 900 | $1,625 | $1.81 | 14d | 1 | 1.39mi |
| 3030 W Acacia Ave Hemet, CA | 1.0–3.0 | 1.0–2.0 | 892 | $1,895 | $2.12 | 1d | 10 | 1.44mi |
HOA detail
- Monthly dues
- $185 · $2,220/yr
- Likely covers
- gascablepool
Listing history 14 events
-
2026-06-18days on market $180,000 Active 17 DOM
-
2026-06-17days on market $180,000 Active 16 DOM
-
2026-06-16days on market $180,000 Active 15 DOM
-
2026-06-15days on market $180,000 Active 14 DOM
-
2026-06-09days on market $180,000 Active 11 DOM
-
2026-06-08days on market $180,000 Active 10 DOM
-
2026-06-07days on market $180,000 Active 9 DOM
-
2026-06-04days on market $180,000 Active 6 DOM
-
2026-06-03days on market $180,000 Active 5 DOM
-
2026-06-02days on market $180,000 Active 4 DOM
-
2026-06-01days on market $180,000 Active 3 DOM
-
2026-05-31days on market $180,000 Active 2 DOM
-
2026-05-12historical $180,000 871-char remark
-
2010-02-16soldstatus $70,000
ⓘ Source: listings_history table (triggers on properties + properties_extension) + one-shot
backfill from property_details.listing_events for pre-trigger history.
Tax reassessment forecast CA · Resets to sale price
- Current annual tax
- $620 · $52/mo
- Projected year-2 tax
- $1,368 · $114/mo
- Expected delta
- +$748/yr (+$62/mo · 120.6%)
ⓘ Screening estimate from a state-policy table — verify with the county assessor before closing.
Climate risk First Street
- Flood 1/10 Low FEMA zone X (shaded) · 0% chance over 30 yrs
- Wildfire 6/10 Major
- Heat 7/10 Severe 6 d/yr ≥104°F today · 16 d/yr by 30 yrs out
- Wind 1/10 Low
- Air quality 6/10 Major 9 unhealthy d/yr today · 11 by 30 yrs out
Nearby sold comps map
Loading sold comps map…
Walkable amenities ~0.75 mi
Loading nearby amenities…
Taxation est. · year 1
- Rental income
- $24,027
- − Mortgage interest
- −$10,083
- − Property taxes
- −$620
- − Insurance
- −$900
- − Repairs & maintenance
- −$1,922
- − Management
- −$1,922
- − HOA
- −$2,220
- − Depreciation
- −$5,236
- Taxable income
- $1,123
- Est. tax owed @ 24.0%
- −$270
- After-tax cash flow
- $3,644/yr
For passive investors: Depreciation is non-cash, so a rental often shows a tax loss while cash-flowing — sheltering income. Rental losses are passive: they offset passive income freely, and up to $25,000/yr can offset ordinary (W-2) income if you actively participate and your MAGI is under $100k (phasing out to $0 by $150k); unused losses carry forward. On sale, claimed depreciation is recaptured at up to 25%, and gains may owe capital-gains tax (a 1031 exchange can defer both). Figures are a year-1 estimate at your 24.0% rate — not tax advice; consult a CPA.
Schools (NCES district)
- District
- Hemet Unified
- NCES district ID
- 0616920
- Math proficiency
- 19% ▼ -3.00%
- Reading proficiency
- 41% ▲ 4.00%
- Median HH income
- $39,962
- Composite
- 25.16/100
- National rank
- #7517
- State rank
- #360 of 517 in CA
Livability — Hemet
- Score
- 51/100
- State rank
- #1056
- US rank
- #25208
Category grades
Schools grade is shown separately in the Schools card above.
Census & demographics
- Census place
- Hemet, CA
- County
- Riverside County · 2,287,001 people
- City population
- 137,670
- Metro
- Riverside-San Bernardino-Ontario, CA
- Population (ZIP)
- 39,937
- Household income
- $49,396
- Rent vs Own
- Severe rent burden
- 2144.0
Population outlook (Riverside County) Hauer SSP2
- Today (2025)
- 2,664,475 people
- By 2030
- 2,802,692 · +5.2%
- By 2040
- 3,050,904 · +14.5%
- By 2050
- 3,256,783 · +22.2%
- By 2075
- 3,655,058 · +37.2%
- By 2100
- 3,766,594 · +41.4%
Race, ethnicity, and origin ACS 2023
- Neighborhood character
- Diverse neighborhood (Simpson 0.61)
- Race & ethnicity
- Hispanic / Latino 54% White 30% Two or more races 18% Black 10% Native American 2% Asian 2%
- Hispanic origin (detail)
- Mexican 48% Puerto Rican 1%
- Common ancestry
- Slovak 1% Romanian 1% Portuguese 1%
- Foreign-born
- 21% · Canada
- Languages at home
- 59% English-only · Spanish 38% Arabic 1% Tagalog/Filipino 1%
Political lean MEDSL · Riverside
- 2024 margin
- Toss-up / Even · D 48.0% · R 49.3% · Other 2.6%
- 2008→2024 swing
- -3.6pp toward R · 2008: 2.3pp · 2024: -1.3pp
- All cycles
- 2024: R+1.3 2020: D+8.0 2016: D+4.3 2012: R+0.4 2008: D+2.3
Not yet ingested
- Civics
- —
Market trends
- HPI YoY
- ▼ -147.46%
- Current HPI
- 405.1277
- Rent YoY
- ▲ 1.76%
- Metro
- Riverside-San Bernardino-Ontario, CA
- State GDP YoY
- ▲ 3.21%
- F500 in state
- 116
Industry mix (Fortune 500 HQ in CA)
| Industry | F500 HQs | Revenue |
|---|---|---|
| Technology | 27 | $1,492B |
|
||
| Financial Services | 3 | $174B |
|
||
| Retail | 3 | $44B |
|
||
| Insurance | 3 | $26B |
|
||
| Media / Entertainment | 2 | $115B |
|
||
| Pharmaceuticals / Biotech | 2 | $62B |
|
||
Price history
+157.1% since first listed4 events — show timeline
- 2026-06-15 Relisted — CRMLS
- 2026-05-29 Listed $180,000 CRMLS
- 2026-05-12 Coming Soon $180,000 CRMLS
- 2010-02-16 Sold (Public Records) $70,000 Public Records
Property tax history
+0.4%/yrLatest (2025): $620 · +2.0% YoY. Source: county tax records.
Cash-flow waterfall
monthlySold comps — $/sqft
last 12 mo · ≤1 miLoading sold comps…