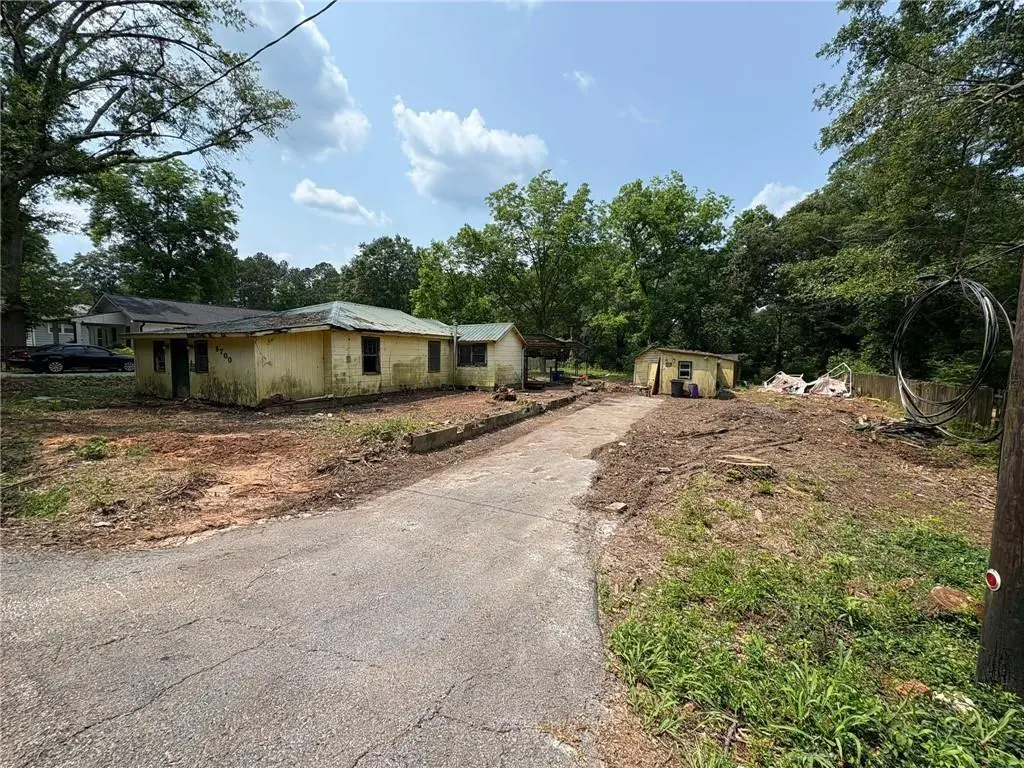
3700 Moore Rd · Austell, GA
Flood risk 1/10 · Minimal
- FEMA flood zone
- X (unshaded)
- Chance of flooding over 30 yrs
- 0.0%
- Est. flood insurance / yr
- $507 – $1,088
Fire risk 3/10 · Minor
- Est. fire insurance / yr
- $963 – $1,789
Heat risk 5/10 · Moderate
- Hot days now (above 103°F)
- 7 days/yr
- Hot days in 30 yrs
- 18 days/yr
Wind risk 4/10 · Minor
- Chance of severe wind over 30 yrs
- 21.0%
Air-quality risk 4/10 · Minor
- Unhealthy air days now
- 4 days/yr
- Unhealthy air days in 30 yrs
- 5 days/yr
Risk factors via First Street. Map © Google.
Why this score? — see what drove the B- grade
The composite is a weighted blend of 9 inputs, each scored 0–100. Each bar is that input's sub-score; the figure is the points it added to the 100-point composite (weight × sub-score).
- Cash flow +30.0/30.0
- 1% rule +10.0/10.0
- DSCR +10.0/10.0
- ARV discount +7.5/15.0
- Schools +3.8/10.0
- Livability +3.4/5.0
- Rent growth +2.8/5.0
- Condition / age +2.5/5.0
- Appreciation +0.0/10.0
$102,900
🖨 Deal sheet (PDF) 📄 Offer letter ✓ Due diligence
Listing remarks MLS
Investor Alert in Austell! Located at 3700 Moore Road (30106), this property is the ultimate blank canvas for your next high-yield project. Designed for flippers and visionary investors, it offers total creative freedom to renovate, customize, and maximize your ROI. Positioned in a high-demand, growing market, the home boasts unbeatable connectivity with quick access to I-20 and Thornton Road. Plus, future buyers or tenants will love being minutes away from local shopping, dining, and commercial hubs. The potential is massive-bring your contractor and claim this lucrative opportunity before someone else does! Property SOLD AS IS - please do your contingencies before sending an offer.
Key facts
- Quick access to i-20
- Minutes from dining
- 0.3 acre lot
Tags
Property features AI
Finance
- HOA & community: Association fees billed bi-monthly; Additional association fee billed annually
Exterior
- Utilities: Public water; Sewer: other; Electric: 110V and 220V; Other utilities
- Home design: One-story home; Fixer condition
- Construction: Cedar and wood siding exterior; Shingle roof; Raised foundation with brick/mortar
- Exterior features: Other exterior features; Asphalt road frontage on a city street
Interior
- Kitchen: Kitchen with other/custom features
- Bedrooms: Three main-level bedrooms; Primary bedroom located on the main level
- Flooring: Other flooring
- Bathrooms: One full bathroom; One main-level bathroom
- Heating & cooling: Other heating; Other cooling
- Interior features: No shared/common walls; Crawl space basement; Great room/dining area configuration
- Laundry & utility: Main-level laundry room; Laundry in a common area
Neighborhood map
What this means for you Summary
Snapshot
- This is a 3-bed/1.0-bath single-family listed at $103k.
Deal economics
- At list price, monthly cash flow is $1k ($13k/yr) — positive.
- The deal already cash-flows at list — no discount required.
- Meets the 1% rule at list price ($2k rent vs $103k).
- Recommended offer: $101k (1.5% below list) — sets the bar for market timing.
Location & tenants
- Location reads 67/100 on livability (#175 in GA) — a middle-class / working-renter tenant base. Strengths: cost of living A+, housing A+; Watch: employment D+, amenities F, commute F.
- Cobb County (suburban): math 39% / reading 45% proficiency, ranked #25 of 174 in GA (top 14%) — families likely to look elsewhere, expect single-tenant / working-renter base with shorter leases.
- Zoned schools: Hendricks Elementary School (math 19% / reading 27%, grade F, #797 of 1,228 statewide, top 65%, 502 students, 74% FRL); Cooper Middle School (math 28% / reading 38%, grade F, #213 of 470 statewide, top 47%, 982 students, 71% FRL); South Cobb High School (math 21% / reading 20%, grade F, #231 of 424 statewide, top 54%, 2,127 students, 67% FRL) — zoned schools average 71% FRL vs 39% district-wide (32 pts higher); higher-poverty schools than district average — tighter screening recommended.
- Zoned-school proficiency averages 26% at this address vs 42% district-wide (-16 pts) — the specific schools serving this property underperform the Cobb County average; the district grade overstates school quality for this exact location.
- Market conditions: Rents rising (+1.3%/yr); 187 active listings in the ZIP; 6 comparable units currently listed for rent nearby; rentals lingering (median 45d on market — plan ~5-8 weeks vacancy on turnover, expect pricing pressure); 67% of comp listings sitting > 30 days — soft ceiling on asking rent; 1,625 units permitted in Cobb County in 2024 (389 in 5+ unit buildings).
Forward outlook
- Local home prices are declining (-3.0%/yr); year-one equity from $711 of loan paydown is wiped out by about $3k of value loss. Plan a longer hold.
- Cobb County population projected at +33% by 2050 — long-run rental-demand tailwind backs the buy-and-hold thesis.
- At projected returns (-3.0% appreciation + 1.3% rent growth), your $29k cash investment doubles in ~3 years — after that, you're playing with house money.
Negotiation context
- It's been on market 30 days — a 2% lower offer ($101k) is reasonable based on typical stale-listing flexibility.
- 8 sale attempts with the ask held roughly flat each time — persistent listings suggest the price (not the market) is what's stuck; bring a comps-based counter.
- Current owner paid $47k; list at $103k implies a 121% gain — meaningful room to come down on a strong offer.
Risks & watch-outs
- Watch-outs: built in 1946 — expect roof / HVAC / electrical / plumbing capex.
- Climate carrying-cost: extreme-heat days projected 7→18/yr by 2055 (HVAC capex compounding) — expect insurance premiums to compound above CPI over the hold.
Questions for the listing agent
- Built in 1946 — when were the roof, HVAC, electrical panel, plumbing, and water heater last replaced?
- Is there a deadline driving the sale (1031 exchange, divorce, estate, relocation)? That informs how much negotiation room exists.
- Schools are D-rated, which usually means shorter tenancies and higher turnover. Who's the typical renter profile here, and what's been the actual vacancy rate?
- What's the average days-on-market for RENTAL listings here right now (not sales)? A rising rental-DOM trend means longer vacancies and softer asking-rent achievability than the comps imply.
- What's the recent tenant-quality profile in this submarket — average credit score on applications, eviction rate, late-payment / NSF rate, and stable-employment percentage? A property-management company in the area should have these aggregated.
- How much new for-sale + rental construction is in the pipeline within 1–3 miles? Heavy new supply typically softens prices + rents 12–24 months out; constrained supply supports both.
Investment metrics
- 1% rule
- 2.08% ✓
- Cap rate
- 18.99%
- Cash-on-cash
- 45.33%
- DSCR
- 3.02
- GRM
- 4.0
CMA / ARV
- ARV (on-the-fly)
- $209,664
- Comps found
- 3
Show comp detail 3 sales within ~0.75 mi
| Address | Dist | Beds/Ba | Sqft | Sold | Price | $/sf | Match |
|---|---|---|---|---|---|---|---|
| 3561 Clay Rd | 0.22mi | 3/1.0 | 1,140 (+13%) | 11mo | $237,000 | $208 | 59 |
| 4776 Ballew Dr | 0.51mi | 3/2.0 | 1,056 (+5%) | 20mo | $160,000 | $152 | 48 |
| 4738 Doss Cir | 0.59mi | 3/1.5 | 1,125 (+12%) | 22mo | $237,500 | $211 | 33 |
Match score weights: distance 35% · size 25% · config 20% · recency 20%. Top-matched comps best support the ARV.
Projected returns pro-forma
-3.0% appreciation · 1.3% rent growth · sell at horizon
- IRR
- 40.6%
- Equity multiple
- 2.70×
- Total profit
- $49,014
- Equity at exit
- $15,343
- IRR
- 46.1%
- Equity multiple
- 5.08×
- Total profit
- $117,521
- Equity at exit
- $8,897
Cash invested: $28,812 (down + closing). Projections, not guarantees.
Landlord ↔ Tenant lean methodology
- Overall (STATE)
- 90 Strongly Landlord-Friendly
- State Georgia
- 90 Strongly Landlord-Friendly · R+3
- County
- — inherits STATE
- City
- — inherits STATE
ZIP-level market 30106
- Home prices YoY
- -33.4%
- Rents YoY
- 1.3%
- Active inventory
- 187
- Price-to-rent
- 4.0×
Monthly cashflow live
- Estimated rent
- $2,143 high interval (Pro) →
- Mortgage (P&I)
- −$540
- Tax from tax record
- −$22 /mo · $260/yr
- Insurance
- −$43
- HOA
- −$0
- Vacancy / Maint / Mgmt
- −$450
- Net cashflow
- $1,088
Break-even live
Sensitivity live
| Price | -10% $1,147 | -5% $1,118 | +0% $1,088 | +5% $1,059 | +10% $1,030 |
|---|---|---|---|---|---|
| Rent | -10% $919 | -5% $1,004 | +0% $1,088 | +5% $1,173 | +10% $1,258 |
| Rate | -1.0pp $1,140 | -0.5pp $1,115 | base $1,088 | +0.5pp $1,062 | +1.0pp $1,035 |
UW: 25.0% down · 7.5% · 30yr · 1.5% tax · 5.0% vac · 8.0% maint · 8.0% mgmt
Financing live
Cash to close
- Down payment
- $25,725
- Closing costs
- $3,087
- Reserves months
- —
- Total cash needed
- —
Loan-product check · same deal, 3 products live
Conventional
25% down · 7.5% · 30yr
- Down + closing
- —
- Monthly P&I
- —
- Monthly cashflow
- —
- DSCR
- —
- Eligible?
- —
Personal DTI + credit; lowest rate.
DSCR
20% down · 8.5% · 30yr
- Down + closing
- —
- Monthly P&I
- —
- Monthly cashflow
- —
- DSCR
- —
- Eligible?
- —
No personal income docs; deal must DSCR.
Hard money
10% down · 12.0% · 12mo
- Down + closing
- —
- Monthly P&I
- —
- Monthly cashflow
- —
- DSCR
- —
- Eligible?
- —
Short-term bridge; refi at stabilization.
Rent comps 6 comps
| Address | Beds | Baths | Sqft | Rent | $/sqft | DOM | Units | Dist |
|---|---|---|---|---|---|---|---|---|
| 4361 Wesley Pl Austell, GA | 4.0 | 2.5 | 1396 | $2,130 | $1.53 | 45d | 1 | 0.57mi |
| 5058 Austell Powder Springs Rd Austell, GA | 2.0 | 1.0 | 1234 | $2,000 | $1.62 | 6d | 1 | 0.80mi |
| 3645 Sharon Dr Powder Springs, GA | 3.0 | 2.0 | 1334 | $2,250 | $1.69 | 45d | 1 | 1.03mi |
| 5038 Hyacinth Ln Austell, GA | 3.0 | 2.0 | 1425 | $2,025 | $1.42 | 0d | 1 | 1.12mi |
| 4170 Mistymorn Way Powder Springs, GA | 3.0 | 3.0 | 1180 | $2,049 | $1.74 | 45d | 1 | 1.14mi |
| 4037 Compton Cir Powder Springs, GA | 3.0 | 2.0 | 1395 | $1,895 | $1.36 | 45d | 1 | 1.39mi |
Listing history 39 events
-
2026-06-21days on market $102,900 Active 30 DOM
-
2026-06-18days on market $102,900 Active 27 DOM
-
2026-06-17days on market $102,900 Active 26 DOM
-
2026-06-16days on market $102,900 Active 25 DOM
-
2026-06-15days on market $102,900 Active 24 DOM
-
2026-06-13days on market $102,900 Active 22 DOM
-
2026-06-13days on market $102,900 Active 21 DOM
-
2026-06-09days on market $102,900 Active 18 DOM
-
2026-06-08days on market $102,900 Active 17 DOM
-
2026-06-07days on market $102,900 Active 16 DOM
-
2026-06-04days on market $102,900 Active 13 DOM
-
2026-06-03days on market $102,900 Active 12 DOM
-
2026-06-02days on market $102,900 Active 11 DOM
-
2026-06-01days on market $102,900 Active 10 DOM
-
2026-05-31days on market $102,900 Active 9 DOM
-
2026-05-20historical
-
2026-05-20historical
-
2026-04-28price $102,900
-
2026-04-28price $102,900
-
2026-02-19price $108,000
-
2026-02-19price $108,000
-
2026-01-03$118,000 Active
-
2026-01-03$118,000 New
-
2025-12-29historical
-
2025-12-29historical
-
2025-11-26status Active
-
2025-11-26status Back On Market
-
2025-11-05status Under Contract
-
2025-11-05status Pending
-
2025-10-16price $118,000
-
2025-10-16price $118,000
-
2025-06-26price $128,000
-
2025-06-26price $128,000
-
2025-06-03$133,000 Active
-
2025-06-03$133,000 New
-
2025-05-02soldstatus $46,520 Sold
-
2025-05-02soldstatus $46,520
-
2025-04-09status Under Contract
-
2025-04-01$73,000 New
ⓘ Source: listings_history table (triggers on properties + properties_extension) + one-shot
backfill from property_details.listing_events for pre-trigger history.
Tax reassessment forecast GA · Resets to sale price
- Current annual tax
- $260 · $22/mo
- Projected year-2 tax
- $947 · $79/mo
- Expected delta
- +$686/yr (+$57/mo · 263.4%)
ⓘ Screening estimate from a state-policy table — verify with the county assessor before closing.
Climate risk First Street
- Flood 1/10 Low FEMA zone X (unshaded) · 0% chance over 30 yrs
- Wildfire 3/10 Moderate
- Heat 5/10 Major 7 d/yr ≥103°F today · 18 d/yr by 30 yrs out
- Wind 4/10 Moderate 21% chance of damaging wind over 30 yrs
- Air quality 4/10 Moderate 4 unhealthy d/yr today · 5 by 30 yrs out
Nearby sold comps map
Loading sold comps map…
Walkable amenities ~0.75 mi
Loading nearby amenities…
Taxation est. · year 1
- Rental income
- $25,712
- − Mortgage interest
- −$5,764
- − Property taxes
- −$260
- − Insurance
- −$514
- − Repairs & maintenance
- −$2,057
- − Management
- −$2,057
- − Depreciation
- −$2,993
- Taxable income
- $12,065
- Est. tax owed @ 24.0%
- −$2,896
- After-tax cash flow
- $10,166/yr
For passive investors: Depreciation is non-cash, so a rental often shows a tax loss while cash-flowing — sheltering income. Rental losses are passive: they offset passive income freely, and up to $25,000/yr can offset ordinary (W-2) income if you actively participate and your MAGI is under $100k (phasing out to $0 by $150k); unused losses carry forward. On sale, claimed depreciation is recaptured at up to 25%, and gains may owe capital-gains tax (a 1031 exchange can defer both). Figures are a year-1 estimate at your 24.0% rate — not tax advice; consult a CPA.
Schools (NCES district)
- District
- Cobb County
- NCES district ID
- 1301290
- Math proficiency
- 39% ▼ -15.00%
- Reading proficiency
- 45% ▼ -10.00%
- Median HH income
- $68,845
- Composite
- 37.93/100
- National rank
- #4308
- State rank
- #25 of 174 in GA
Livability — Austell
- Score
- 67/100
- State rank
- #175
- US rank
- #11059
Category grades
Schools grade is shown separately in the Schools card above.
Census & demographics
- County
- Cobb County · 777,758 people
- City population
- 49,719
- Metro
- Atlanta-Sandy Springs-Alpharetta, GA
- Population (ZIP)
- 23,107
- Household income
- $68,881
- Rent vs Own
- Severe rent burden
- 907.0
Population outlook (Cobb County) Hauer SSP2
- Today (2025)
- 868,385 people
- By 2030
- 929,614 · +7.1%
- By 2040
- 1,047,533 · +20.6%
- By 2050
- 1,155,537 · +33.1%
- By 2075
- 1,405,030 · +61.8%
- By 2100
- 1,555,058 · +79.1%
Race, ethnicity, and origin ACS 2023
- Neighborhood character
- Diverse neighborhood (Simpson 0.62)
- Race & ethnicity
- Black 54% White 22% Hispanic / Latino 20% Two or more races 8% Asian 1%
- Hispanic origin (detail)
- Mexican 9% Puerto Rican 6%
- Common ancestry
- Italian 2% Hispanic 1% Romanian 1%
- Foreign-born
- 14% · Canada, Jamaica, Vietnam
- Languages at home
- 79% English-only · Spanish 16% Other Indo-European 1% French/Haitian/Cajun 1%
Political lean MEDSL · Cobb
- 2024 margin
- D (+14.9) · D 56.9% · R 42.0% · Other 1.1%
- 2008→2024 swing
- +24.3pp toward D · 2008: -9.4pp · 2024: 14.9pp
- All cycles
- 2024: D+14.9 2020: D+14.3 2016: D+2.1 2012: R+12.6 2008: R+9.4
Not yet ingested
- Civics
- —
Market trends
- HPI YoY
- ▼ -128.55%
- Current HPI
- 256.6988
- Rent YoY
- ▲ 1.30%
- Metro
- Atlanta-Sandy Springs-Alpharetta, GA
- State GDP YoY
- ▲ 2.66%
- F500 in state
- 28
Industry mix (Fortune 500 HQ in GA)
| Industry | F500 HQs | Revenue |
|---|---|---|
| Paper / Packaging | 2 | $29B |
|
||
| Retail | 1 | $160B |
|
||
| Transportation / Logistics | 1 | $91B |
|
||
| Airlines | 1 | $62B |
|
||
| Consumer Goods | 1 | $47B |
|
||
| Utilities | 1 | $25B |
|
||
Price history
+41.0% since first listed22 events — show timeline
- 2026-05-22 Listed $102,900 FMLS
- 2026-05-22 Listed $102,900 GAMLS
- 2026-05-20 Listing Removed — GAMLS
- 2026-04-28 Price Changed $102,900 GAMLS
- 2026-02-19 Price Changed $108,000 GAMLS
- 2026-01-03 Listed $118,000 GAMLS
- 2025-12-29 Listing Removed — GAMLS
- 2025-12-29 Listing Removed — FMLS
- 2025-11-26 Relisted — FMLS
- 2025-11-26 Relisted — GAMLS
- 2025-11-05 Pending — GAMLS
- 2025-11-05 Pending — FMLS
- 2025-10-16 Price Changed $118,000 GAMLS
- 2025-10-16 Price Changed $118,000 FMLS
- 2025-06-26 Price Changed $128,000 GAMLS
- 2025-06-26 Price Changed $128,000 FMLS
- 2025-06-03 Listed $133,000 GAMLS
- 2025-06-03 Listed $133,000 FMLS
- 2025-05-02 Sold (Public Records) $46,520 Public Records
- 2025-05-02 Sold (MLS) $46,520 GAMLS
- 2025-04-09 Pending — GAMLS
- 2025-04-01 Listed $73,000 GAMLS
Property tax history
-1.5%/yrLatest (2025): $260 · -0.4% YoY. Source: county tax records.
Cash-flow waterfall
monthlySold comps — $/sqft
last 12 mo · ≤1 miLoading sold comps…