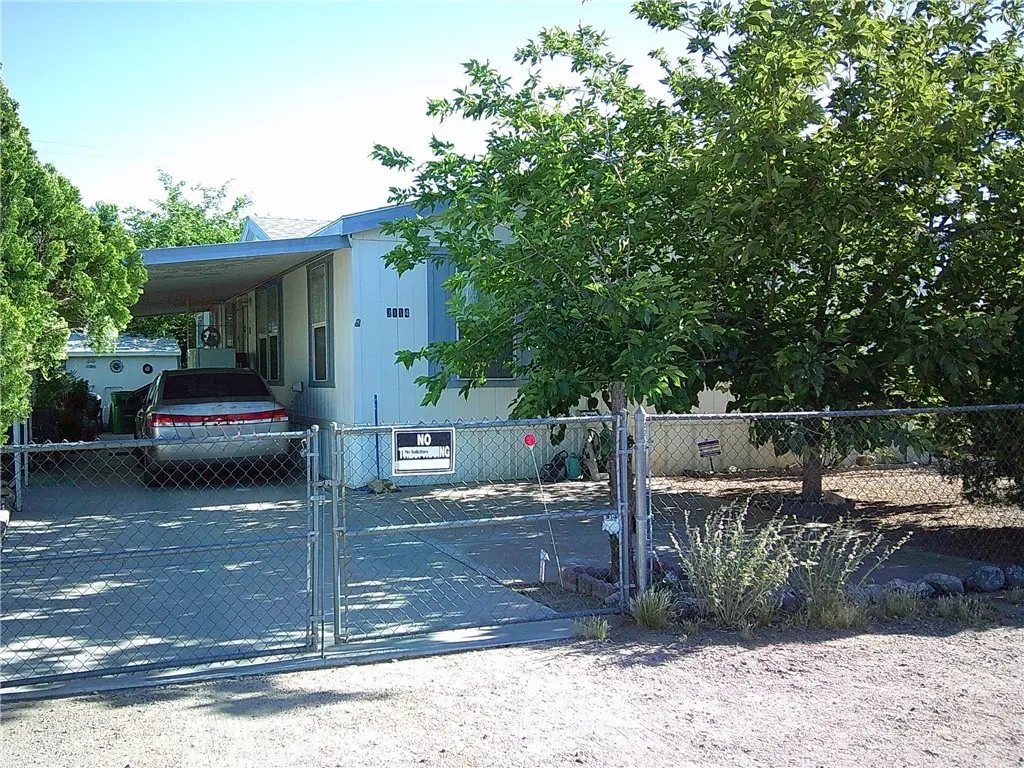
3114 E Northfield Ave · New Kingman-Butler, AZ
Flood risk 6/10 · Moderate
- FEMA flood zone
- X (unshaded)
- Chance of flooding over 30 yrs
- 0.71%
- Est. flood insurance / yr
- $507 – $1,088
Fire risk 7/10 · Major
- Est. fire insurance / yr
- $610 – $1,132
Heat risk 6/10 · Moderate
- Hot days now (above 100°F)
- 7 days/yr
- Hot days in 30 yrs
- 17 days/yr
Wind risk 1/10 · Minimal
- Chance of severe wind over 30 yrs
- —
Air-quality risk 1/10 · Minimal
- Unhealthy air days now
- 0 days/yr
- Unhealthy air days in 30 yrs
- 0 days/yr
Risk factors via First Street. Map © Google.
Why this score? — see what drove the C+ grade
The composite is a weighted blend of 9 inputs, each scored 0–100. Each bar is that input's sub-score; the figure is the points it added to the 100-point composite (weight × sub-score).
- Cash flow +27.7/30.0
- DSCR +9.8/10.0
- ARV discount +8.8/15.0
- 1% rule +6.4/10.0
- Rent growth +2.6/5.0
- Livability +2.5/5.0
- Condition / age +2.5/5.0
- Schools +1.8/10.0
- Appreciation +0.0/10.0
$147,999
🖨 Deal sheet (PDF) 📄 Offer letter ✓ Due diligence
Listing remarks
Priced to sell! This well-maintained 3-bedroom, 2-bath home offers comfort, space, and charm throughout. Step into a large living room that flows seamlessly into a dedicated dining area perfect for both everyday living and entertaining. The spacious kitchen features ample counter space, a pantry, and a cozy breakfast nook. The home also includes a convenient laundry room and a screened-in back porch with windows on all sides an inviting spot to enjoy fresh air in a protected setting. All three bedrooms are generously sized, and both bathrooms offer a combination shower and tub, while the primary suite stands out with a garden tub, private windows, His & Her sinks and a separate walk-i
Key facts
- 6,000 sq ft lot
- 2 parking spots
- Built 1999
Property features AI
Exterior
- Parking: Carport (2 spaces)
- Utilities: Public water; Septic tank sewer; Electricity available; Natural gas available
- Home design: Manufactured double-wide home; Residential property; R1 single-family residential zoning
- Construction: Shingle roof
- Exterior features: Chain link fencing in front and back yards; Shingle roof; No pool
Interior
- Kitchen: Electric range/oven; Dishwasher; Garbage disposal; Refrigerator; Laminate countertops
- Bedrooms: Total rooms: 7
- Flooring: Laminate counters noted (flooring type not specified)
- Bathrooms: 2 full bathrooms
- Heating & cooling: Central heating (electric); Central air conditioning (electric); Ceiling fans
- Interior features: Ceiling fans; Laminate counters; Open floor plan; Walk-in closets; Accessible full bathroom
- Laundry & utility: Washer and dryer included; Water heater
Neighborhood map
What this means for you Summary
Snapshot
- This is a 3-bed/2.0-bath land listed at $148k.
Deal economics
- At list price, monthly cash flow is $448 ($5k/yr) — positive.
- The deal already cash-flows at list — no discount required.
- Meets the 1% rule at list price ($2k rent vs $148k).
- Recommended offer: $144k (3.0% below list) — sets the bar for market timing.
- Cap rate 9.9% vs local median 4.3% in New Kingman-Butler — top-decile yield for the area; either an underpriced asset or a hidden risk that comps aren't pricing in. Stress-test before assuming the spread holds.
Location & tenants
- Location reads: area grade C — affects rentability + tenant quality, not the cash-flow math above.
- Kingman Unified School District (79598) (town): math 19% / reading 24% proficiency, ranked #179 of 249 in AZ (top 72%) — low school quality limits family demand, transient renter base, plan for 1-2y turnover.
- Market conditions: Rents flat; 647 active listings in the ZIP; 6 comparable units currently listed for rent nearby; rentals lingering (median 45d on market — plan ~5-8 weeks vacancy on turnover, expect pricing pressure); 83% of comp listings sitting > 30 days — soft ceiling on asking rent; 2,543 units permitted in Mohave County in 2024 (33 in 5+ unit buildings).
- This rent runs 40% of the median local income ($51k/yr) — at the standard rent-burdened threshold; future hikes will face affordability resistance.
Forward outlook
- Local home prices are declining (-3.0%/yr); year-one equity from $1k of loan paydown is wiped out by about $4k of value loss. Plan a longer hold.
- Mohave County population projected to shrink 6% by 2050 — rents likely to lag national; underwrite the cash flow, not the appreciation.
Negotiation context
- It's been on market 41 days — a 3% lower offer ($144k) is reasonable based on typical stale-listing flexibility.
- Current owner paid $69k; list at $148k implies a 114% gain — meaningful room to come down on a strong offer.
Risks & watch-outs
- Climate carrying-cost: major flood risk; major wildfire risk; extreme-heat days projected 7→17/yr by 2055 (HVAC capex compounding) — expect insurance premiums to compound above CPI over the hold.
Questions for the listing agent
- It's been on market 41 days. Have you received any prior offers? Is the seller open to a 3% concession, seller financing, or rate buy-down credit?
- Is there a deadline driving the sale (1031 exchange, divorce, estate, relocation)? That informs how much negotiation room exists.
- What's the average days-on-market for RENTAL listings here right now (not sales)? A rising rental-DOM trend means longer vacancies and softer asking-rent achievability than the comps imply.
- What's the recent tenant-quality profile in this submarket — average credit score on applications, eviction rate, late-payment / NSF rate, and stable-employment percentage? A property-management company in the area should have these aggregated.
- How much new for-sale + rental construction is in the pipeline within 1–3 miles? Heavy new supply typically softens prices + rents 12–24 months out; constrained supply supports both.
Investment metrics
- 1% rule
- 1.14% ✓
- Cap rate
- 9.92%
- Cash-on-cash
- 12.97%
- DSCR
- 1.58
- GRM
- 7.3
CMA / ARV
- ARV (median comp)
- $152,240
- List price
- $147,999
- Delta
- -2.79%
- Verdict
- FAIR
- Comps
- 20 within 1.0 mi
Projected returns pro-forma
-3.0% appreciation · 0.33% rent growth · sell at horizon
- IRR
- 0.0%
- Equity multiple
- 1.00×
- Total profit
- $75
- Equity at exit
- $22,067
- IRR
- 7.0%
- Equity multiple
- 1.47×
- Total profit
- $19,400
- Equity at exit
- $12,796
Cash invested: $41,440 (down + closing). Projections, not guarantees.
Landlord ↔ Tenant lean methodology
- Overall (STATE)
- 87 Strongly Landlord-Friendly
- State Arizona
- 87 Strongly Landlord-Friendly · R+3
- County
- — inherits STATE
- City
- — inherits STATE
ZIP-level market 86409
- Rents YoY
- 0.3%
- Active inventory
- 647
- Price-to-rent
- 7.3×
Monthly cashflow live
- Estimated rent
- $1,685 high interval (Pro) →
- Mortgage (P&I)
- −$776
- Tax from tax record
- −$46 /mo · $549/yr
- Insurance
- −$62
- HOA
- −$0
- Vacancy / Maint / Mgmt
- −$354
- Net cashflow
- $448
Break-even live
Sensitivity live
| Price | -10% $532 | -5% $490 | +0% $448 | +5% $406 | +10% $364 |
|---|---|---|---|---|---|
| Rent | -10% $315 | -5% $381 | +0% $448 | +5% $514 | +10% $581 |
| Rate | -1.0pp $522 | -0.5pp $486 | base $448 | +0.5pp $410 | +1.0pp $371 |
UW: 25.0% down · 7.5% · 30yr · 1.5% tax · 5.0% vac · 8.0% maint · 8.0% mgmt
Financing live
Cash to close
- Down payment
- $37,000
- Closing costs
- $4,440
- Reserves months
- —
- Total cash needed
- —
Loan-product check · same deal, 3 products live
Conventional
25% down · 7.5% · 30yr
- Down + closing
- —
- Monthly P&I
- —
- Monthly cashflow
- —
- DSCR
- —
- Eligible?
- —
Personal DTI + credit; lowest rate.
DSCR
20% down · 8.5% · 30yr
- Down + closing
- —
- Monthly P&I
- —
- Monthly cashflow
- —
- DSCR
- —
- Eligible?
- —
No personal income docs; deal must DSCR.
Hard money
10% down · 12.0% · 12mo
- Down + closing
- —
- Monthly P&I
- —
- Monthly cashflow
- —
- DSCR
- —
- Eligible?
- —
Short-term bridge; refi at stabilization.
Rent comps 6 comps
| Address | Beds | Baths | Sqft | Rent | $/sqft | DOM | Units | Dist |
|---|---|---|---|---|---|---|---|---|
| 2995 E Ames Ave Kingman, AZ | 3.0 | 2.0 | 1221 | $1,250 | $1.02 | 45d | 1 | 0.67mi |
| 2381 E Butler Ave Kingman, AZ | 2.0 | 2.0 | 1152 | $1,200 | $1.04 | 45d | 1 | 0.80mi |
| 3356 E El Tovar Ave Kingman, AZ | 3.0 | 2.0 | 1356 | $1,975 | $1.46 | 45d | 1 | 0.83mi |
| 3597 E Koval Dr Kingman, AZ | 4.0 | 3.0 | 1811 | $2,200 | $1.21 | 45d | 1 | 1.16mi |
| 2658 E Punta Vista Kingman, AZ | 3.0 | 2.0 | 1205 | $1,700 | $1.41 | 45d | 1 | 1.16mi |
| 3665 E Koval Dr Kingman, AZ | 3.0 | 2.0 | 1400 | $1,665 | $1.19 | 14d | 1 | 1.26mi |
Listing history 15 events
-
2026-06-13status $147,999 Pending 41 DOM
-
2026-06-10days on market $147,999 Active 41 DOM
-
2026-06-09days on market $147,999 Active 40 DOM
-
2026-06-08days on market $147,999 Active 39 DOM
-
2026-06-07days on market $147,999 Active 38 DOM
-
2026-06-05days on market $147,999 Active 35 DOM
-
2026-06-03days on market $147,999 Active 34 DOM
-
2026-06-02days on market $147,999 Active 33 DOM
-
2026-06-01days on market $147,999 Active 32 DOM
-
2026-05-31days on market $147,999 Active 31 DOM
-
2026-05-30days on market $147,999 Active 30 DOM
-
2026-05-14price $147,999 1332-char remark
-
2026-04-30$165,000 Active 1332-char remark
-
2004-05-03soldstatus $69,000
-
1997-05-21soldstatus $31,000
ⓘ Source: listings_history table (triggers on properties + properties_extension) + one-shot
backfill from property_details.listing_events for pre-trigger history.
Tax reassessment forecast AZ · Resets to sale price
- Current annual tax
- $549 · $46/mo
- Projected year-2 tax
- $977 · $81/mo
- Expected delta
- +$428/yr (+$36/mo · 77.9%)
ⓘ Screening estimate from a state-policy table — verify with the county assessor before closing.
Climate risk First Street
- Flood 6/10 Major FEMA zone X (unshaded) · 71% chance over 30 yrs
- Wildfire 7/10 Severe
- Heat 6/10 Major 7 d/yr ≥100°F today · 17 d/yr by 30 yrs out
- Wind 1/10 Low
- Air quality 1/10 Low 0 unhealthy d/yr today · 0 by 30 yrs out
Nearby sold comps map
Loading sold comps map…
Walkable amenities ~0.75 mi
Loading nearby amenities…
Taxation est. · year 1
- Rental income
- $20,225
- − Mortgage interest
- −$8,290
- − Property taxes
- −$549
- − Insurance
- −$740
- − Repairs & maintenance
- −$1,618
- − Management
- −$1,618
- − Depreciation
- −$4,305
- Taxable income
- $3,104
- Est. tax owed @ 24.0%
- −$745
- After-tax cash flow
- $4,630/yr
For passive investors: Depreciation is non-cash, so a rental often shows a tax loss while cash-flowing — sheltering income. Rental losses are passive: they offset passive income freely, and up to $25,000/yr can offset ordinary (W-2) income if you actively participate and your MAGI is under $100k (phasing out to $0 by $150k); unused losses carry forward. On sale, claimed depreciation is recaptured at up to 25%, and gains may owe capital-gains tax (a 1031 exchange can defer both). Figures are a year-1 estimate at your 24.0% rate — not tax advice; consult a CPA.
Schools (NCES district)
- District
- Kingman Unified School District (79598)
- NCES district ID
- 0400295
- Math proficiency
- 19% ▼ -11.00%
- Reading proficiency
- 24% ▼ -9.00%
- Median HH income
- $36,760
- Composite
- 17.87/100
- National rank
- #9002
- State rank
- #179 of 249 in AZ
Livability — New Kingman-Butler
No livability data for this city. (Only ~50 U.S. cities are tracked.)
Census & demographics
- Census place
- New Kingman-Butler, AZ
- County
- Mohave County · 181,906 people
- Metro
- Lake Havasu City-Kingman, AZ
- Population (ZIP)
- 30,365
- Household income
- $50,852
- Rent vs Own
- Severe rent burden
- 688.0
Population outlook (Mohave County) Hauer SSP2
- Today (2025)
- 209,184 people
- By 2030
- 209,674 · +0.2%
- By 2040
- 205,897 · -1.6%
- By 2050
- 196,810 · -5.9%
- By 2075
- 169,454 · -19.0%
- By 2100
- 136,630 · -34.7%
Race, ethnicity, and origin ACS 2023
- Neighborhood character
- Predominantly White (76%)
- Race & ethnicity
- White 76% Hispanic / Latino 16% Two or more races 10% Native American 1%
- Hispanic origin (detail)
- Mexican 12%
- Common ancestry
- Lithuanian 3% Slovak 2% Portuguese 2%
- Foreign-born
- 6% · Canada
- Languages at home
- 92% English-only · Spanish 7%
Political lean MEDSL · Mohave
- 2024 margin
- Solid R (+55.8) · D 21.8% · R 77.6%
- 2008→2024 swing
- -22.9pp toward R · 2008: -32.9pp · 2024: -55.8pp
- All cycles
- 2024: R+55.8 2020: R+51.3 2016: R+51.5 2012: R+42.6 2008: R+32.9
Not yet ingested
- Civics
- —
Market trends
- HPI YoY
- ▼ -158.90%
- Current HPI
- 280.1884
- Rent YoY
- ▲ 0.33%
- Metro
- Lake Havasu City-Kingman, AZ
- State GDP YoY
- ▲ 4.54%
- F500 in state
- 20
Industry mix (Fortune 500 HQ in AZ)
| Industry | F500 HQs | Revenue |
|---|---|---|
| Technology | 2 | $13B |
|
||
| Mining / Metals | 1 | $23B |
|
||
| Environmental Services | 1 | $16B |
|
||
| Metals / Steel | 1 | $14B |
|
||
| Technology Distribution | 1 | $9B |
|
||
| Homebuilding | 1 | $8B |
|
||
Price history
+377.4% since first listed5 events — show timeline
- 2026-06-11 Pending — WARDEX
- 2026-05-14 Price Changed $147,999 WARDEX
- 2026-04-30 Listed $165,000 WARDEX
- 2004-05-03 Sold (Public Records) $69,000 Public Records
- 1997-05-21 Sold (Public Records) $31,000 Public Records
Property tax history
+3.0%/yrLatest (2025): $549 · +1.6% YoY. Source: county tax records.
Cash-flow waterfall
monthlySold comps — $/sqft
last 12 mo · ≤1 miLoading sold comps…