607 Roosevelt Ave · Greenville, NC
Flood risk 1/10 · Minimal
- FEMA flood zone
- X (unshaded)
- Chance of flooding over 30 yrs
- 0.0%
- Est. flood insurance / yr
- $507 – $1,088
Fire risk 3/10 · Minor
- Est. fire insurance / yr
- $906 – $1,684
Heat risk 8/10 · Major
- Hot days now (above 107°F)
- 7 days/yr
- Hot days in 30 yrs
- 17 days/yr
Wind risk 8/10 · Major
- Chance of severe wind over 30 yrs
- 80.0%
Air-quality risk 3/10 · Minor
- Unhealthy air days now
- 3 days/yr
- Unhealthy air days in 30 yrs
- 3 days/yr
Risk factors via First Street. Map © Google.
Why this score? — see what drove the D- grade
The composite is a weighted blend of 9 inputs, each scored 0–100. Each bar is that input's sub-score; the figure is the points it added to the 100-point composite (weight × sub-score).
- Cash flow +11.2/30.0
- ARV discount +7.5/15.0
- Rent growth +3.9/5.0
- Livability +3.9/5.0
- Schools +3.6/10.0
- DSCR +3.3/10.0
- 1% rule +2.8/10.0
- Condition / age +2.5/5.0
- Appreciation +0.0/10.0
$159,900
🖨 Deal sheet 📄 Offer letter ✓ Due diligence
Listing remarks MLS
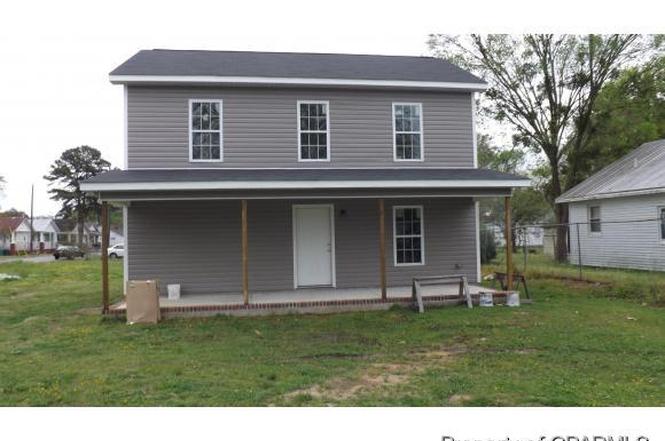
New Construction minutes Vidant Medical Center & ECU. 3 bdrms/2 baths, Living Room, Kitchen, Office and Covered Back porch & Front porch. Walk In Closets in all bedrooms.
Key facts
- 6,534 sq ft lot
- Built 2012
- Listed 174 days
Property features AI
Exterior
- Parking: Unpaved parking
- Utilities: Public water; Sewer connected; Water connected; Electric service
- Home design: Single-family residence; Two levels; Entry level: 1
- Construction: Vinyl siding and frame construction; Combination foundation; Shingle roof; Built as a residential single-family home
- Exterior features: Covered porch; Porch; Has a view; No additional exterior features listed
Interior
- Kitchen: Refrigerator; Range
- Bathrooms: 2 full bathrooms
- Heating & cooling: Central air conditioning; Electric forced-air heating
- Interior features: Refrigerator; Range; Electric water heater; Has central air conditioning; Electric forced-air heating; No basement; Total of 6 rooms
- Laundry & utility: Washer hookup in kitchen
Neighborhood map
What this means for you Summary
Snapshot
- This is a 3-bed/2.0-bath single-family listed at $160k.
Deal economics
- At list price, monthly cash flow is $-62 ($-739/yr) — negative.
- To cash-flow at today's rent, offer at most $149k (6.8% below list).
- To meet the 1% rule (rent ≥ 1% of price), the offer needs to be $125k (21.6% below list).
- Recommended offer: $125k (21.6% below list) — sets the bar for 1% rule.
- Cap rate 5.8% vs local median 3.8% in Greenville — top-decile yield for the area; either an underpriced asset or a hidden risk that comps aren't pricing in. Stress-test before assuming the spread holds.
Location & tenants
- Location reads 77/100 on livability (#30 in NC, #2,977 nationally) — a middle-class / working-renter tenant base. Strengths: commute A+, cost of living A+, health & safety A+; Watch: crime F, employment F.
- Pitt County Schools (rural): math 41% / reading 44% proficiency, ranked #100 of 178 in NC (top 56%) — families likely to look elsewhere, expect single-tenant / working-renter base with shorter leases.
- Zoned schools: Elmhurst Elementary (math 27% / reading 37%, grade F, #908 of 1,410 statewide, top 67%, 460 students, 58% FRL); C M Eppes Middle (math 24% / reading 32%, grade F, #360 of 475 statewide, top 77%, 626 students, 99% FRL); Junius H Rose High (math 52% / reading 61%, grade C, #261 of 535 statewide, top 49%, 1,525 students, 50% FRL).
- Market conditions: Rents rising fast (+5.4%/yr); 350 active listings in the ZIP; 19 comparable units currently listed for rent nearby; rentals at typical pace (median 21d on market — plan ~3-4 weeks tenant-placement turnaround); 1,300 units permitted in Pitt County in 2024 (204 in 5+ unit buildings).
- This rent runs 31% of the median local income ($49k/yr) — at the standard rent-burdened threshold; future hikes will face affordability resistance.
Forward outlook
- Local home prices are declining (-3.0%/yr); year-one equity from $1k of loan paydown is wiped out by about $5k of value loss. Plan a longer hold.
- Pitt County population projected at +22% by 2050 — long-run rental-demand tailwind backs the buy-and-hold thesis.
Negotiation context
- It's been on market 175 days — a 12% lower offer ($141k) is reasonable based on typical stale-listing flexibility.
- 5 sale attempts since 14y ago; this cycle's ask has dropped $40k (20%) from the opening price — seller is motivated, your offer sets the floor, not the list.
- Current owner paid $87k; list at $160k implies a 83% gain — meaningful room to come down on a strong offer.
Risks & watch-outs
- Climate carrying-cost: severe wind risk, 80% chance of damaging wind over 30y; extreme-heat days projected 7→17/yr by 2055 (HVAC capex compounding) — expect insurance premiums to compound above CPI over the hold.
Questions for the listing agent
- What do current leases actually rent for vs. the listed asking? Can we see a recent rent roll and the last 12 months of T-12 income?
- It's been on market 175 days. Have you received any prior offers? Is the seller open to a 22% concession, seller financing, or rate buy-down credit?
- Why hasn't it sold? Are there any deal-killer items the seller is aware of (foundation, flood, title, zoning, code violations)?
- Is there a deadline driving the sale (1031 exchange, divorce, estate, relocation)? That informs how much negotiation room exists.
- Crime grade is F in this area — have there been break-ins, vandalism, or insurance claims at this property in the last 3 years? What carrier currently insures it and at what premium?
- The area grade is low — what's the realistic commute time and amenity access for the typical tenant pool here? Any planned neighborhood developments (good or bad) we should know about?
- What's the average days-on-market for RENTAL listings here right now (not sales)? A rising rental-DOM trend means longer vacancies and softer asking-rent achievability than the comps imply.
- What's the recent tenant-quality profile in this submarket — average credit score on applications, eviction rate, late-payment / NSF rate, and stable-employment percentage? A property-management company in the area should have these aggregated.
- How much new for-sale + rental construction is in the pipeline within 1–3 miles? Heavy new supply typically softens prices + rents 12–24 months out; constrained supply supports both.
Investment metrics
- 1% rule
- 0.78% ✗
- Cap rate
- 5.83%
- Cash-on-cash
- -1.65%
- DSCR
- 0.93
- GRM
- 10.6
CMA / ARV
- ARV (on-the-fly)
- $70,800
- Comps found
- 12
Show comp detail 12 sales within ~0.75 mi
| Address | Dist | Beds/Ba | Sqft | Sold | Price | $/sf | Match |
|---|---|---|---|---|---|---|---|
| 1004 Ward St | 0.18mi | 2/1.0 (-1) | 1,235 (+3%) | 1mo | $115,000 | $93 | 77 |
| 1207 Davenport St | 0.29mi | 3/2.0 | 1,116 (-7%) | 3mo | $189,000 | $169 | 73 |
| 909 Douglas Ave | 0.05mi | 3/2.5 | 1,354 (+13%) | 5mo | $219,000 | $162 | 70 |
| 202 Vance St | 0.33mi | 3/1.0 | 1,164 (-3%) | 7mo | $58,000 | $50 | 70 |
| 1206 W 3rd St | 0.36mi | 3/1.0 | 1,253 (+4%) | 4mo | $49,000 | $39 | 69 |
| 517 Mckinley Ave | 0.08mi | 2/1.0 (-1) | 1,056 (-12%) | 2mo | $62,000 | $59 | 66 |
| 1409 W 6th St | 0.31mi | 3/2.0 | 1,064 (-11%) | 3mo | $100,000 | $94 | 64 |
| 1213 Davenport St | 0.31mi | 2/2.0 (-1) | 1,055 (-12%) | 2mo | $50,000 | $47 | 59 |
| 1602 Myrtle St | 0.44mi | 3/1.0 | 1,334 (+11%) | 7mo | $43,000 | $32 | 51 |
| 307 Clairmont Cir | 0.67mi | 4/1.0 (+1) | 1,162 (-3%) | 9mo | $165,000 | $142 | 47 |
| 1310 W Third St | 0.39mi | 2/1.0 (-1) | 1,048 (-13%) | 8mo | $27,500 | $26 | 45 |
| 1519 Broad St | 0.59mi | 3/1.0 | 1,332 (+11%) | 9mo | $23,000 | $17 | 43 |
Match score weights: distance 35% · size 25% · config 20% · recency 20%. Top-matched comps best support the ARV.
Projected returns pro-forma
-3.0% appreciation · 5.44% rent growth · sell at horizon
- IRR
- -16.5%
- Equity multiple
- 0.40×
- Total profit
- $-26,692
- Equity at exit
- $23,842
- IRR
- -4.5%
- Equity multiple
- 0.67×
- Total profit
- $-14,740
- Equity at exit
- $13,825
Cash invested: $44,772 (down + closing). Projections, not guarantees.
Landlord ↔ Tenant lean methodology
- Overall (STATE)
- 85 Strongly Landlord-Friendly
- State North Carolina
- 85 Strongly Landlord-Friendly · R+3
- County
- — inherits STATE
- City
- — inherits STATE
ZIP-level market 27834
- Rents YoY
- 5.4%
- Active inventory
- 350
- Price-to-rent
- 10.6×
Monthly cashflow live
- Estimated rent
- $1,254 high interval (Pro) →
- Mortgage (P&I)
- −$839
- Tax from tax record
- −$147 /mo · $1,768/yr
- Insurance
- −$67
- HOA
- −$0
- Vacancy / Maint / Mgmt
- −$263
- Net cashflow
- $-62
Break-even live
UW: 25.0% down · 7.5% · 30yr · 1.5% tax · 5.0% vac · 8.0% maint · 8.0% mgmt
Financing live
Cash to close
- Down payment
- $39,975
- Closing costs
- $4,797
- Reserves months
- —
- Total cash needed
- —
Loan-product check · same deal, 3 products live
Conventional
25% down · 7.5% · 30yr
- Down + closing
- —
- Monthly P&I
- —
- Monthly cashflow
- —
- DSCR
- —
- Eligible?
- —
Personal DTI + credit; lowest rate.
DSCR
20% down · 8.5% · 30yr
- Down + closing
- —
- Monthly P&I
- —
- Monthly cashflow
- —
- DSCR
- —
- Eligible?
- —
No personal income docs; deal must DSCR.
Hard money
10% down · 12.0% · 12mo
- Down + closing
- —
- Monthly P&I
- —
- Monthly cashflow
- —
- DSCR
- —
- Eligible?
- —
Short-term bridge; refi at stabilization.
Rent comps 19 comps
| Address | Beds | Baths | Sqft | Rent | $/sqft | DOM | Units | Dist |
|---|---|---|---|---|---|---|---|---|
| 504 Davenport St Unit A Greenville, NC | 2.0 | 1.0 | 900 | $895 | $0.99 | 13d | 1 | 0.25mi |
| 1304 Myrtle St Greenville, NC | 3.0 | 1.0 | 978 | $1,375 | $1.41 | 21d | 1 | 0.28mi |
| 206 Hudson St Greenville, NC | 2.0 | 1.0 | 1150 | $900 | $0.78 | 21d | 1 | 0.43mi |
| 1612 Lincoln Dr Greenville, NC | 3.0 | 1.0 | 972 | $900 | $0.93 | 13d | 1 | 0.45mi |
| 1001 Park Ave Greenville, NC | 3.0 | 1.0 | 1296 | $1,150 | $0.89 | 21d | 1 | 0.45mi |
| 550 Pitt-Greene Connector Greenville, NC | 4.0 | 1.0–4.0 | 1012 | $1,288 | $1.27 | 13d | 25 | 0.45mi |
| 400 Arbor St Greenville, NC | 2.0 | 1.0 | 860 | $1,850 | $2.15 | 21d | 1 | 0.59mi |
| 300 Higgs St Unit 300-B Greenville, NC | 2.0 | 1.0 | 756 | $900 | $1.19 | 21d | 1 | 0.60mi |
| 1902 Myrtle St Unit 1902-A Greenville, NC | 2.0 | 1.0 | 848 | $850 | $1.00 | 21d | 1 | 0.64mi |
| 600 Howell St Apt E Greenville, NC | 2.0 | 1.0 | 1050 | $815 | $0.78 | 21d | 1 | 0.81mi |
| 1710 Garland St Greenville, NC | 2.0 | 1.0 | 884 | $1,195 | $1.35 | 21d | 1 | 0.85mi |
| 709 Johnston St Unit Y Greenville, NC | 2.0 | 1.0 | 900 | $950 | $1.06 | 21d | 1 | 1.05mi |
| 701 Treybrooke Cir Greenville, NC | 1.0–2.0 | 1.5–2.0 | 1070 | $1,650 | $1.54 | 13d | 18 | 1.14mi |
| 2207 Wandsworth Dr Greenville, NC | 1.0–2.0 | 1.0 | 650 | $900 | $1.38 | 13d | 5 | 1.31mi |
| 111 Lakeview Ter Greenville, NC | 2.0–3.0 | 1.0–2.0 | 750 | $1,200 | $1.60 | 13d | 7 | 1.35mi |
| 115 Stancill Dr Unit B Greenville, NC | 3.0 | 1.0 | 1090 | $1,500 | $1.38 | 21d | 1 | 1.38mi |
| 301 Maple St Greenville, NC | 3.0 | 2.0 | 1230 | $1,800 | $1.46 | 21d | 1 | 1.42mi |
| 114 N Meade St Unit B Greenville, NC | 3.0 | 1.5 | 931 | $1,350 | $1.45 | 21d | 1 | 1.45mi |
| 1604 W Arlington Blvd Greenville, NC | 1.0–2.0 | 1.0 | 624 | $1,125 | $1.80 | 13d | 11 | 1.46mi |
Listing history 25 events
-
2026-06-15days on market $159,900 Active 175 DOM
-
2026-06-13days on market $159,900 Active 172 DOM
-
2026-06-10days on market $159,900 Active 170 DOM
-
2026-06-09days on market $159,900 Active 169 DOM
-
2026-06-08days on market $159,900 Active 168 DOM
-
2026-06-07days on market $159,900 Active 167 DOM
-
2026-06-05days on market $159,900 Active 164 DOM
-
2026-06-03days on market $159,900 Active 163 DOM
-
2026-06-03price $159,900 Active 162 DOM
-
2026-06-02days on market $169,900 Active 162 DOM
-
2026-06-01days on market $169,900 Active 161 DOM
-
2026-05-31days on market $169,900 Active 160 DOM
-
2026-05-30days on market $169,900 Active 159 DOM
-
2026-05-18price $169,900
-
2026-04-17price $179,900
-
2025-12-22$199,900 Active
-
2015-06-16soldstatus $87,200 182-char remark
Show marketing remark (182 chars)
New Construction minutes Vidant Medical Center & ECU. 3 bdrms/2 baths, Living Room, Kitchen, Office and Covered Back porch & Front porch. Walk In Closets in all bedrooms.
-
2015-06-16soldstatus $87,500
Show marketing remark (182 chars)
New Construction minutes Vidant Medical Center & ECU. 3 bdrms/2 baths, Living Room, Kitchen, Office and Covered Back porch & Front porch. Walk In Closets in all bedrooms.
-
2015-04-13$85,000 182-char remark
Show marketing remark (182 chars)
New Construction minutes Vidant Medical Center & ECU. 3 bdrms/2 baths, Living Room, Kitchen, Office and Covered Back porch & Front porch. Walk In Closets in all bedrooms.
-
2014-04-03soldstatus $23,000 176-char remark
Show marketing remark (176 chars)
New Construction near Vidant Medical Center & ECU. 3 bdrms/ 2 baths, Living Rm, Kitchen, office and Covered front & rear porch. Construction unfinished! Selling AS IS!!
-
2014-03-07$23,000 176-char remark
Show marketing remark (176 chars)
New Construction near Vidant Medical Center & ECU. 3 bdrms/ 2 baths, Living Rm, Kitchen, office and Covered front & rear porch. Construction unfinished! Selling AS IS!!
-
2013-04-30historical
-
2012-04-16historical
-
2012-03-23$3,680
-
2012-03-07$89,900
ⓘ Source: listings_history table (triggers on properties + properties_extension) + one-shot
backfill from property_details.listing_events for pre-trigger history.
Tax reassessment forecast NC · Resets to sale price
- Current annual tax
- $1,768 · $147/mo
- Projected year-2 tax
- $1,768 · $147/mo
- Expected delta
- $0/yr ($0/mo · 0.0%)
ⓘ Screening estimate from a state-policy table — verify with the county assessor before closing.
Climate risk First Street
- Flood 1/10 Low FEMA zone X (unshaded) · 0% chance over 30 yrs
- Wildfire 3/10 Moderate
- Heat 8/10 Severe 7 d/yr ≥107°F today · 17 d/yr by 30 yrs out
- Wind 8/10 Severe 80% chance of damaging wind over 30 yrs
- Air quality 3/10 Moderate 3 unhealthy d/yr today · 3 by 30 yrs out
Nearby sold comps map
Loading sold comps map…
Walkable amenities ~0.75 mi
Loading nearby amenities…
Taxation est. · year 1
- Rental income
- $15,052
- − Mortgage interest
- −$8,957
- − Property taxes
- −$1,768
- − Insurance
- −$800
- − Repairs & maintenance
- −$1,204
- − Management
- −$1,204
- − Depreciation
- −$4,652
- Taxable loss
- −$3,533
- Est. tax savings @ 24.0%
- +$848
- After-tax cash flow
- $109/yr
For passive investors: Depreciation is non-cash, so a rental often shows a tax loss while cash-flowing — sheltering income. Rental losses are passive: they offset passive income freely, and up to $25,000/yr can offset ordinary (W-2) income if you actively participate and your MAGI is under $100k (phasing out to $0 by $150k); unused losses carry forward. On sale, claimed depreciation is recaptured at up to 25%, and gains may owe capital-gains tax (a 1031 exchange can defer both). Figures are a year-1 estimate at your 24.0% rate — not tax advice; consult a CPA.
Schools (NCES district)
- District
- Pitt County Schools
- NCES district ID
- 3700012
- Math proficiency
- 41% ▬ 0.00%
- Reading proficiency
- 44% ▲ 2.00%
- Median HH income
- $40,631
- Composite
- 35.67/100
- National rank
- #4877
- State rank
- #100 of 178 in NC
Livability — Greenville
- Score
- 77/100
- State rank
- #30
- US rank
- #2977
Category grades
Schools grade is shown separately in the Schools card above.
Census & demographics
- Census place
- Greenville, NC
- County
- Pitt County · 142,592 people
- City population
- 115,121
- Metro
- Greenville, NC
- Population (ZIP)
- 56,347
- Household income
- $48,935
- Rent vs Own
- Severe rent burden
- 3319.0
Population outlook (Pitt County) Hauer SSP2
- Today (2025)
- 194,585 people
- By 2030
- 203,756 · +4.7%
- By 2040
- 220,807 · +13.5%
- By 2050
- 236,614 · +21.6%
- By 2075
- 275,940 · +41.8%
- By 2100
- 300,058 · +54.2%
Race, ethnicity, and origin ACS 2023
- Neighborhood character
- Diverse neighborhood (Simpson 0.59)
- Race & ethnicity
- Black 54% White 33% Hispanic / Latino 8% Two or more races 3% Asian 2%
- Hispanic origin (detail)
- Mexican 7%
- Common ancestry
- Lithuanian 1% Slovak 1% Romanian 1%
- Foreign-born
- 7% · Canada, China
- Languages at home
- 91% English-only · Spanish 6% Other Asian/Pacific 1%
Political lean MEDSL · Pitt
- 2024 margin
- Lean D (+6.0) · D 52.5% · R 46.5% · Other 1.1%
- 2008→2024 swing
- -2.8pp toward R · 2008: 8.8pp · 2024: 6.0pp
- All cycles
- 2024: D+6.0 2020: D+9.4 2016: D+7.4 2012: D+6.7 2008: D+8.8
Not yet ingested
- Civics
- —
Market trends
- HPI YoY
- ▼ -187.99%
- Current HPI
- 190.6869
- Rent YoY
- ▲ 5.44%
- Metro
- Greenville, NC
- State GDP YoY
- ▲ 3.28%
- F500 in state
- 26
Industry mix (Fortune 500 HQ in NC)
| Industry | F500 HQs | Revenue |
|---|---|---|
| Financial Services | 2 | $213B |
|
||
| Retail | 2 | $95B |
|
||
| Industrial Conglomerate | 1 | $38B |
|
||
| Metals / Steel | 1 | $35B |
|
||
| Utilities | 1 | $30B |
|
||
| Industrial Machinery | 1 | $19B |
|
||
Price history
+89.0% since first listed12 events — show timeline
- 2026-05-18 Price Changed $169,900 Hive MLS
- 2026-04-17 Price Changed $179,900 Hive MLS
- 2025-12-22 Listed $199,900 Hive MLS
- 2015-06-16 Sold (Public Records) $87,500 Public Records
- 2015-06-16 Sold (MLS) $87,200 Hive MLS
- 2015-04-13 Listed $85,000 Hive MLS
- 2014-04-03 Sold (MLS) $23,000 Hive MLS
- 2014-03-07 Listed $23,000 Hive MLS
- 2013-04-30 Listing Removed — Hive MLS
- 2012-04-16 Listing Removed — Hive MLS
- 2012-03-23 Listed $3,680 Hive MLS
- 2012-03-07 Listed $89,900 Hive MLS
Property tax history
+5.6%/yrLatest (2025): $1,768 · +0.7% YoY. Source: county tax records.
Cash-flow waterfall
monthlySold comps — $/sqft
last 12 mo · ≤1 miLoading sold comps…