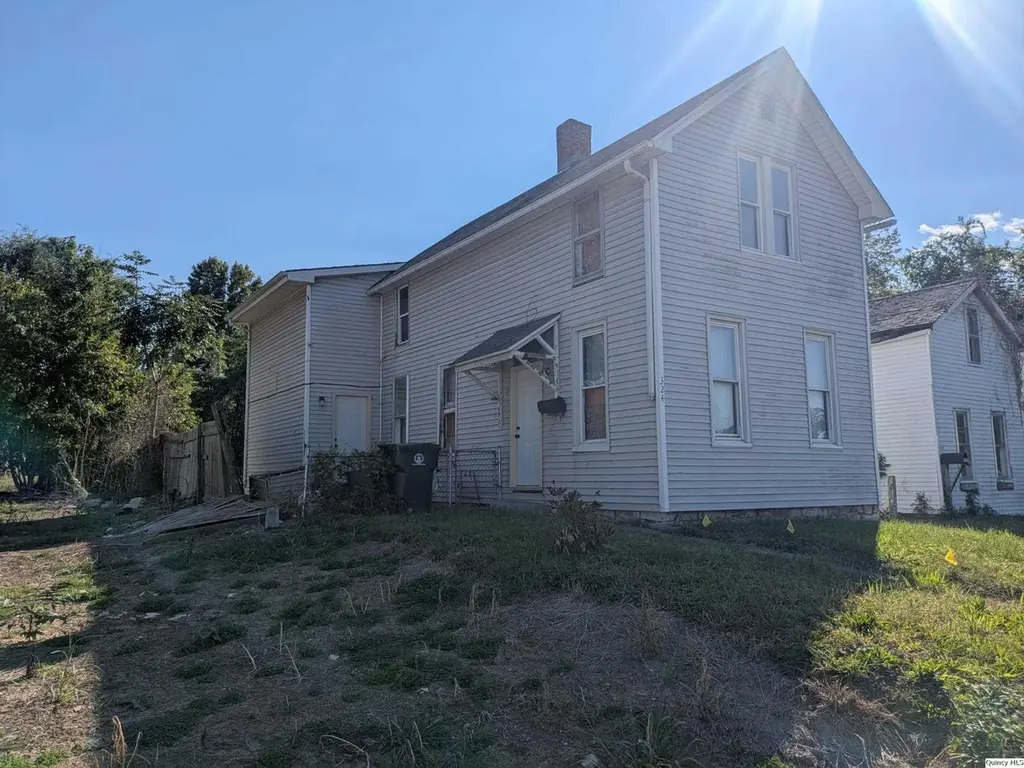
324 Lind St · Quincy, IL
Flood risk 1/10 · Minimal
- FEMA flood zone
- X (unshaded)
- Chance of flooding over 30 yrs
- 0.0%
- Est. flood insurance / yr
- $473 – $860
Fire risk 1/10 · Minimal
- Est. fire insurance / yr
- $804 – $1,492
Heat risk 4/10 · Minor
- Hot days now (above 106°F)
- 7 days/yr
- Hot days in 30 yrs
- 17 days/yr
Wind risk 2/10 · Minimal
- Chance of severe wind over 30 yrs
- —
Air-quality risk 2/10 · Minimal
- Unhealthy air days now
- 1 days/yr
- Unhealthy air days in 30 yrs
- 1 days/yr
Risk factors via First Street. Map © Google.
Why this score? — see what drove the B+ grade
The composite is a weighted blend of 9 inputs, each scored 0–100. Each bar is that input's sub-score; the figure is the points it added to the 100-point composite (weight × sub-score).
- Cash flow +30.0/30.0
- ARV discount +15.0/15.0
- 1% rule +10.0/10.0
- DSCR +10.0/10.0
- Rent growth +5.0/5.0
- Livability +3.4/5.0
- Condition / age +2.5/5.0
- Schools +2.2/10.0
- Appreciation +0.0/10.0
$45,000
🖨 Deal sheet (PDF) 📄 Offer letter ✓ Due diligence
Listing remarks
This property is a great investment opportunity! It features 2 bedrooms, with the possibility for a 3rd, and 1.5 bathrooms. The spacious lot offers alley access and a massive 2 car garage and shop space. Heat, AC, & water heater are not in working order and will need to be replaced. Being sold AS-IS.
Key facts
- 9,148 sq ft lot
- Garage
- Listed 283 days
Neighborhood map
What this means for you Summary
Snapshot
- This is a 2-bed/1.5-bath single-family listed at $45k.
Deal economics
- At list price, monthly cash flow is $977 ($12k/yr) — positive.
- The deal already cash-flows at list — no discount required.
- Meets the 1% rule at list price ($2k rent vs $45k).
- Recommended offer: $40k (12.0% below list) — sets the bar for market timing.
- Cap rate 32.3% vs local median 4.3% in Quincy — top-decile yield for the area; either an underpriced asset or a hidden risk that comps aren't pricing in. Stress-test before assuming the spread holds.
Location & tenants
- Location reads 67/100 on livability (#506 in IL) — a middle-class / working-renter tenant base. Strengths: cost of living A+, housing A+; Watch: crime D, employment D, amenities D-.
- Quincy SD 172 (town): math 24% / reading 27% proficiency, ranked #328 of 620 in IL (top 53%) — low school quality limits family demand, transient renter base, plan for 1-2y turnover.
- Zoned schools: Dr. Abby Fox Rooney Elem Sch (math 25% / reading 25%, grade F, #842 of 2,056 statewide, top 41%, 496 students, 0% FRL); Quincy Jr High School (math 25% / reading 30%, grade F, #295 of 665 statewide, top 45%, 1,348 students, 0% FRL); Quincy Sr High School (math 21% / reading 28%, grade F, #256 of 693 statewide, top 44%, 1,924 students, 0% FRL) — zoned schools average 0% FRL vs 48% district-wide (48 pts lower); this property's tenant base skews higher-income than the district average.
- Market conditions: Rents rising fast (+10.8%/yr); 180 active listings in the ZIP; 3 comparable units currently listed for rent nearby; rentals lingering (median 45d on market — plan ~5-8 weeks vacancy on turnover, expect pricing pressure); 100% of comp listings sitting > 30 days — soft ceiling on asking rent; 68 units permitted in Adams County in 2024 (0 in 5+ unit buildings).
- This rent runs 38% of the median local income ($52k/yr) — at the standard rent-burdened threshold; future hikes will face affordability resistance.
Forward outlook
- Local home prices are declining (-3.0%/yr); year-one equity from $311 of loan paydown is wiped out by about $1k of value loss. Plan a longer hold.
- Adams County population projected at -14% by 2050 — secular population decline; favor cash flow + early exit over multi-decade hold.
- At projected returns (-3.0% appreciation + 8.0% rent growth), your $13k cash investment doubles in ~2 years — after that, you're playing with house money.
Negotiation context
- It's been on market 284 days — a 12% lower offer ($40k) is reasonable based on typical stale-listing flexibility.
- 5 sale attempts with the ask held roughly flat each time — persistent listings suggest the price (not the market) is what's stuck; bring a comps-based counter.
Questions for the listing agent
- It's been on market 284 days. Have you received any prior offers? Is the seller open to a 12% concession, seller financing, or rate buy-down credit?
- Why hasn't it sold? Are there any deal-killer items the seller is aware of (foundation, flood, title, zoning, code violations)?
- Is there a deadline driving the sale (1031 exchange, divorce, estate, relocation)? That informs how much negotiation room exists.
- Schools are D-rated, which usually means shorter tenancies and higher turnover. Who's the typical renter profile here, and what's been the actual vacancy rate?
- Crime grade is D in this area — have there been break-ins, vandalism, or insurance claims at this property in the last 3 years? What carrier currently insures it and at what premium?
- What's the average days-on-market for RENTAL listings here right now (not sales)? A rising rental-DOM trend means longer vacancies and softer asking-rent achievability than the comps imply.
- What's the recent tenant-quality profile in this submarket — average credit score on applications, eviction rate, late-payment / NSF rate, and stable-employment percentage? A property-management company in the area should have these aggregated.
- How much new for-sale + rental construction is in the pipeline within 1–3 miles? Heavy new supply typically softens prices + rents 12–24 months out; constrained supply supports both.
Investment metrics
- 1% rule
- 3.66% ✓
- Cap rate
- 32.35%
- Cash-on-cash
- 93.05%
- DSCR
- 5.14
- GRM
- 2.3
CMA / ARV
- ARV (median comp)
- $59,319
- List price
- $45,000
- Delta
- -24.14%
- Verdict
- UNDERPRICED
- Comps
- 20 within 1.0 mi
Show comp detail 12 sales within ~0.75 mi
| Address | Dist | Beds/Ba | Sqft | Sold | Price | $/sf | Match |
|---|---|---|---|---|---|---|---|
| 525 Chestnut St | 0.21mi | 2/1.0 | 1,357 (0%) | 9mo | $25,000 | $18 | 80 |
| 313 Lind St | 0.04mi | 2/1.0 | 1,420 (+5%) | 10mo | $49,500 | $35 | 80 |
| 530 Lind St | 0.18mi | 3/1.0 (+1) | 1,277 (-6%) | 3mo | $29,000 | $23 | 72 |
| 1223 N 5 | 0.34mi | 3/2.0 (+1) | 1,376 (+1%) | 15mo | $135,500 | $98 | 62 |
| 315 Maple St | 0.55mi | 3/1.0 (+1) | 1,422 (+5%) | 7mo | $91,000 | $64 | 53 |
| 702 Spring St | 0.47mi | 3/1.5 (+1) | 1,245 (-8%) | 14mo | $12,000 | $10 | 48 |
| 1314 N 10th St | 0.69mi | 3/1.5 (+1) | 1,505 (+11%) | 1mo | $72,000 | $48 | 44 |
| 623 N 8th | 0.42mi | 3/1.5 (+1) | 1,519 (+12%) | 14mo | $35,000 | $23 | 44 |
| 1525 N 7th St | 0.65mi | 2/1.0 | 1,160 (-14%) | 3mo | $136,000 | $117 | 41 |
| 1422 N 3rd | 0.48mi | 3/1.0 (+1) | 1,163 (-14%) | 10mo | $95,000 | $82 | 38 |
| 1318 N 10th St | 0.70mi | 2/2.5 | 1,180 (-13%) | 6mo | $92,500 | $78 | 36 |
| 1228 N 11th St | 0.74mi | 2/1.0 | 1,200 (-12%) | 16mo | $65,000 | $54 | 31 |
Match score weights: distance 35% · size 25% · config 20% · recency 20%. Top-matched comps best support the ARV.
Projected returns pro-forma
-3.0% appreciation · 8.0% rent growth · sell at horizon
- IRR
- 99.5%
- Equity multiple
- 6.05×
- Total profit
- $63,669
- Equity at exit
- $6,710
- IRR
- —
- Equity multiple
- 14.91×
- Total profit
- $175,312
- Equity at exit
- $3,891
Cash invested: $12,600 (down + closing). Projections, not guarantees.
Landlord ↔ Tenant lean methodology
- Overall (STATE)
- 43 Moderately Tenant-Leaning
- State Illinois
- 43 Moderately Tenant-Leaning · D+7
- County
- — inherits STATE
- City
- — inherits STATE
ZIP-level market 62301
- Rents YoY
- 10.8%
- Active inventory
- 180
- Price-to-rent
- 2.3×
Monthly cashflow live
- Estimated rent
- $1,647 medium interval (Pro) →
- Mortgage (P&I)
- −$236
- Tax from tax record
- −$69 /mo · $832/yr
- Insurance
- −$19
- HOA
- −$0
- Vacancy / Maint / Mgmt
- −$346
- Net cashflow
- $977
Break-even live
Sensitivity live
| Price | -10% $1,002 | -5% $990 | +0% $977 | +5% $964 | +10% $952 |
|---|---|---|---|---|---|
| Rent | -10% $847 | -5% $912 | +0% $977 | +5% $1,042 | +10% $1,107 |
| Rate | -1.0pp $1,000 | -0.5pp $988 | base $977 | +0.5pp $965 | +1.0pp $953 |
UW: 25.0% down · 7.5% · 30yr · 1.5% tax · 5.0% vac · 8.0% maint · 8.0% mgmt
Financing live
Cash to close
- Down payment
- $11,250
- Closing costs
- $1,350
- Reserves months
- —
- Total cash needed
- —
Loan-product check · same deal, 3 products live
Conventional
25% down · 7.5% · 30yr
- Down + closing
- —
- Monthly P&I
- —
- Monthly cashflow
- —
- DSCR
- —
- Eligible?
- —
Personal DTI + credit; lowest rate.
DSCR
20% down · 8.5% · 30yr
- Down + closing
- —
- Monthly P&I
- —
- Monthly cashflow
- —
- DSCR
- —
- Eligible?
- —
No personal income docs; deal must DSCR.
Hard money
10% down · 12.0% · 12mo
- Down + closing
- —
- Monthly P&I
- —
- Monthly cashflow
- —
- DSCR
- —
- Eligible?
- —
Short-term bridge; refi at stabilization.
Rent comps 3 comps
| Address | Beds | Baths | Sqft | Rent | $/sqft | DOM | Units | Dist |
|---|---|---|---|---|---|---|---|---|
| 116 N 3rd St Quincy, IL | 1.0–4.0 | 1.0–2.0 | 1950 | $3,067 | $1.57 | 45d | 12 | 0.65mi |
| 500 Maine St Quincy, IL | 1.0 | 1.0 | 937 | $700 | $0.75 | 45d | 1 | 0.74mi |
| 201 S 8th St Quincy, IL | 2.0 | 2.5 | 1785 | $1,800 | $1.01 | 45d | 1 | 0.89mi |
Listing history 25 events
-
2026-06-19days on market $45,000 Active 284 DOM
-
2026-06-18days on market $45,000 Active 283 DOM
-
2026-06-17days on market $45,000 Active 282 DOM
-
2026-06-16days on market $45,000 Active 281 DOM
-
2026-06-15days on market $45,000 Active 280 DOM
-
2026-06-14days on market $45,000 Active 278 DOM
-
2026-06-12days on market $45,000 Active 277 DOM
-
2026-06-09days on market $45,000 Active 274 DOM
-
2026-06-08days on market $45,000 Active 273 DOM
-
2026-06-07days on market $45,000 Active 272 DOM
-
2026-06-03days on market $45,000 Active 268 DOM
-
2026-06-02days on market $45,000 Active 267 DOM
-
2026-06-01days on market $45,000 Active 266 DOM
-
2026-05-31days on market $45,000 Active 265 DOM
-
2026-05-30days on market $45,000 Active 264 DOM
-
2026-02-11historical
-
2026-01-20historical
-
2026-01-16status Active
-
2026-01-14historical
-
2026-01-08status Active
-
2026-01-06historical
-
2026-01-05historical
-
2025-09-08$45,000 Active
-
2025-09-08Active
-
2025-09-08Active
ⓘ Source: listings_history table (triggers on properties + properties_extension) + one-shot
backfill from property_details.listing_events for pre-trigger history.
Tax reassessment forecast IL · Partial reset (capped growth)
- Current annual tax
- $832 · $69/mo
- Projected year-2 tax
- $927 · $77/mo
- Expected delta
- +$95/yr (+$8/mo · 11.4%)
ⓘ Screening estimate from a state-policy table — verify with the county assessor before closing.
Climate risk First Street
- Flood 1/10 Low FEMA zone X (unshaded) · 0% chance over 30 yrs
- Wildfire 1/10 Low
- Heat 4/10 Moderate 7 d/yr ≥106°F today · 17 d/yr by 30 yrs out
- Wind 2/10 Low
- Air quality 2/10 Low 1 unhealthy d/yr today · 1 by 30 yrs out
Nearby sold comps map
Loading sold comps map…
Walkable amenities ~0.75 mi
Loading nearby amenities…
Taxation est. · year 1
- Rental income
- $19,763
- − Mortgage interest
- −$2,521
- − Property taxes
- −$832
- − Insurance
- −$225
- − Repairs & maintenance
- −$1,581
- − Management
- −$1,581
- − Depreciation
- −$1,309
- Taxable income
- $11,714
- Est. tax owed @ 24.0%
- −$2,811
- After-tax cash flow
- $8,912/yr
For passive investors: Depreciation is non-cash, so a rental often shows a tax loss while cash-flowing — sheltering income. Rental losses are passive: they offset passive income freely, and up to $25,000/yr can offset ordinary (W-2) income if you actively participate and your MAGI is under $100k (phasing out to $0 by $150k); unused losses carry forward. On sale, claimed depreciation is recaptured at up to 25%, and gains may owe capital-gains tax (a 1031 exchange can defer both). Figures are a year-1 estimate at your 24.0% rate — not tax advice; consult a CPA.
Schools (NCES district)
- District
- Quincy SD 172
- NCES district ID
- 1733000
- Math proficiency
- 24% ▬ 0.00%
- Reading proficiency
- 27% ▬ 0.00%
- Median HH income
- $44,132
- Composite
- 21.91/100
- National rank
- #8229
- State rank
- #328 of 620 in IL
Livability — Quincy
- Score
- 67/100
- State rank
- #506
- US rank
- #10458
Category grades
Schools grade is shown separately in the Schools card above.
Census & demographics
- Census place
- Quincy, IL
- County
- Adams County · 30,746 people
- City population
- 30,746
- Metro
- Quincy, IL-MO
- Population (ZIP)
- 30,746
- Household income
- $52,055
- Rent vs Own
- Severe rent burden
- 1238.0
Population outlook (Adams County) Hauer SSP2
- Today (2025)
- 65,795 people
- By 2030
- 64,436 · -2.1%
- By 2040
- 61,007 · -7.3%
- By 2050
- 56,851 · -13.6%
- By 2075
- 46,424 · -29.4%
- By 2100
- 34,305 · -47.9%
Race, ethnicity, and origin ACS 2023
- Neighborhood character
- Predominantly White (84%)
- Race & ethnicity
- White 84% Two or more races 7% Black 6% Hispanic / Latino 3% Asian 1%
- Common ancestry
- Slovak 2% Iranian 1% Lithuanian 1%
- Foreign-born
- 2% · Canada
- Languages at home
- 96% English-only · Spanish 2%
Political lean MEDSL · Adams
- 2024 margin
- Solid R (+47.4) · D 25.6% · R 73.0% · Other 1.5%
- 2008→2024 swing
- -25.0pp toward R · 2008: -22.4pp · 2024: -47.4pp
- All cycles
- 2024: R+47.4 2020: R+46.5 2016: R+47.5 2012: R+35.2 2008: R+22.4
Not yet ingested
- Civics
- —
Market trends
- HPI YoY
- ▼ -121.44%
- Current HPI
- 131.7344
- Rent YoY
- ▲ 10.78%
- Metro
- Quincy, IL-MO
- State GDP YoY
- ▲ 1.59%
- F500 in state
- 60
Industry mix (Fortune 500 HQ in IL)
| Industry | F500 HQs | Revenue |
|---|---|---|
| Insurance | 4 | $201B |
|
||
| Consumer Goods | 4 | $87B |
|
||
| Industrial Machinery | 3 | $64B |
|
||
| Healthcare | 2 | $55B |
|
||
| Retail / Pharmacy | 1 | $148B |
|
||
| Agriculture / Food | 1 | $86B |
|
||
Price history
10 events — show timeline
- 2026-02-11 Listing Removed — MRED as Distributed by MLS Grid
- 2026-01-20 Listing Removed — MRED as Distributed by MLS Grid
- 2026-01-16 Relisted — MRED as Distributed by MLS Grid
- 2026-01-14 Listing Removed — MRED as Distributed by MLS Grid
- 2026-01-08 Relisted — MRED as Distributed by MLS Grid
- 2026-01-06 Listing Removed — RMLSA as Distributed by MLS Grid
- 2026-01-05 Listing Removed — MRED as Distributed by MLS Grid
- 2025-09-08 Listed $45,000 Quincy AOR
- 2025-09-08 Listed — RMLSA as Distributed by MLS Grid
- 2025-09-08 Listed — MRED as Distributed by MLS Grid
Property tax history
+0.8%/yrLatest (2023): $832 · +9.4% YoY. Source: county tax records.
Cash-flow waterfall
monthlySold comps — $/sqft
last 12 mo · ≤1 miLoading sold comps…