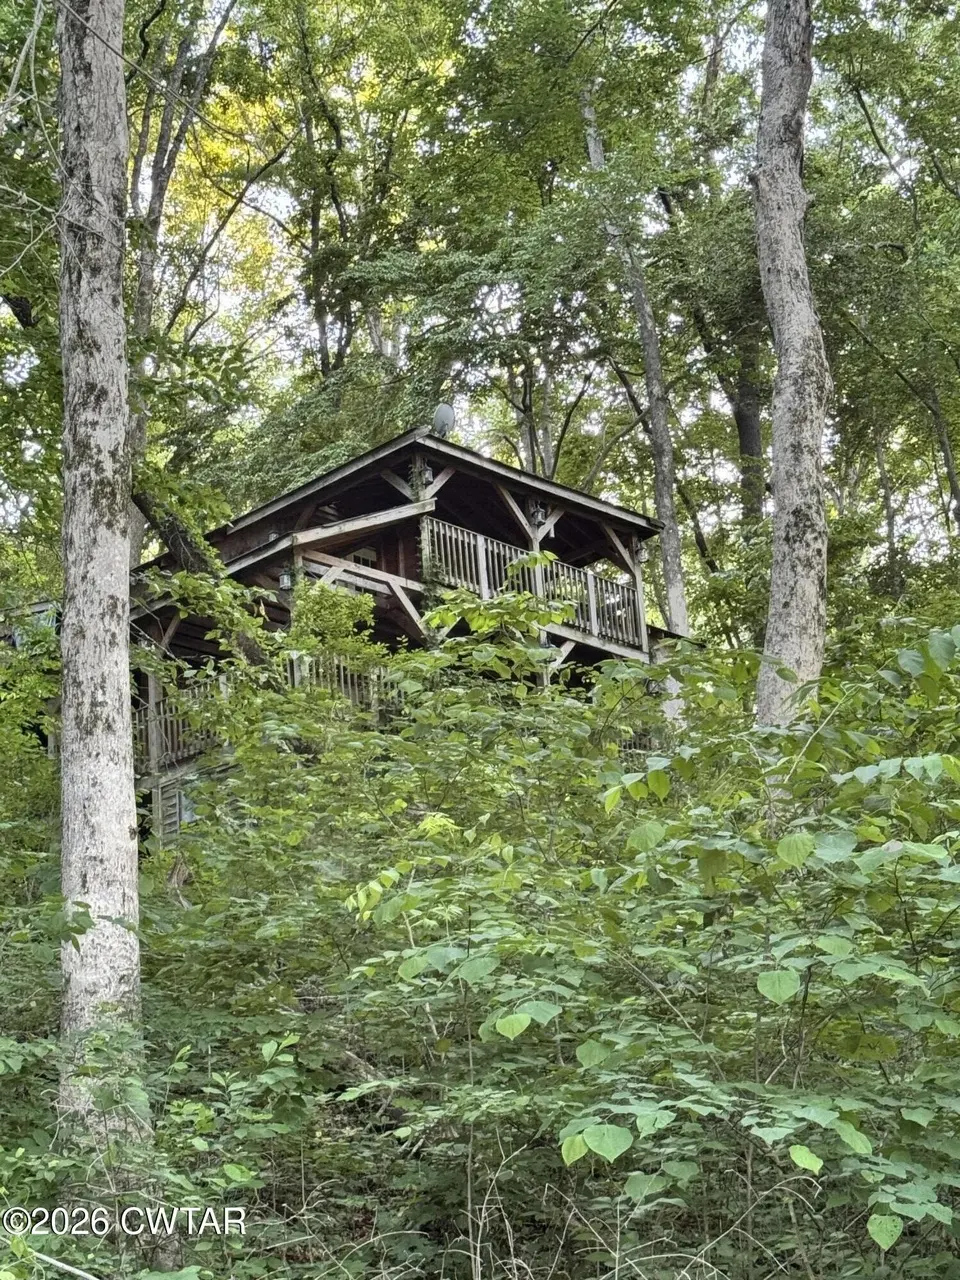
159 Brasher Dr · Decaturville, TN
Flood risk 1/10 · Minimal
- FEMA flood zone
- AE
- Chance of flooding over 30 yrs
- 0.0%
- Est. flood insurance / yr
- $1,737 – $8,500
Fire risk 1/10 · Minimal
- Est. fire insurance / yr
- $949 – $1,763
Heat risk 5/10 · Moderate
- Hot days now (above 108°F)
- 7 days/yr
- Hot days in 30 yrs
- 20 days/yr
Wind risk 4/10 · Minor
- Chance of severe wind over 30 yrs
- 22.0%
Air-quality risk 1/10 · Minimal
- Unhealthy air days now
- 0 days/yr
- Unhealthy air days in 30 yrs
- 0 days/yr
Risk factors via First Street. Map © Google.
Why this score? — see what drove the B+ grade
The composite is a weighted blend of 9 inputs, each scored 0–100. Each bar is that input's sub-score; the figure is the points it added to the 100-point composite (weight × sub-score).
- Cash flow +30.0/30.0
- DSCR +10.0/10.0
- Appreciation +10.0/10.0
- 1% rule +8.7/10.0
- ARV discount +7.5/15.0
- Schools +3.2/10.0
- Livability +2.8/5.0
- Rent growth +2.5/5.0
- Condition / age +2.5/5.0
$59,000
🖨 Deal sheet (PDF) 📄 Offer letter ✓ Due diligence
Listing remarks
RIVER Property. Can be purchased individually or as part of a package. with 75 Elkins and 91 Hank Lochte. All information deemed accurate but is not warranted by the seller, company or REALTOR. This document is to be used for reference only and is not a valid part of the listing agreement between the buyer and seller. Square footage to be determined by appraiser.
Key facts
- 0.3 acre lot
- 2 parking spots
- Built 2002
Property features AI
Finance
- Other: Directions: Take Hwy 412 East through Parsons. At Perryville, go right on Hwy 100, right on Lost Creek Boatdock Rd, left on Elkins Rd. The property is on the corner of Elkins and Brasher Dr.
Exterior
- Parking: 2 parking spaces total; Has a carport with 1 carport space
- Home design: Single-family residence; One story
- Exterior features: Asphalt road frontage on a county road; Publicly maintained road
Interior
- Bedrooms: 1 bedroom on the main level
- Bathrooms: 1 full bathroom (main level)
- Heating & cooling: No air conditioning listed
- Interior features: Multi/split levels; 3 total rooms
Neighborhood map
What this means for you Summary
Snapshot
- This is a 2-bed/1.0-bath single-family listed at $59k.
Deal economics
- At list price, monthly cash flow is $-136 ($-2k/yr) — negative.
- To cash-flow at today's rent, offer at most $35k (40.7% below list).
- Meets the 1% rule at list price ($808 rent vs $59k).
- Recommended offer: $35k (40.7% below list) — sets the bar for cash-flow.
Location & tenants
- Location reads 55/100 on livability (#358 in TN) — a working-class tenant base; expect higher turnover. Strengths: cost of living A+, housing A+; Watch: health & safety C-, crime F, amenities F.
- Decatur County (rural): math 45% / reading 33% proficiency, ranked #19 of 139 in TN (top 14%) — families likely to look elsewhere, expect single-tenant / working-renter base with shorter leases.
- Zoned schools: Parsons Elementary (math 52% / reading 47%, grade D, #119 of 952 statewide, top 14%, 376 students, 0% FRL); Decatur County Middle School (math 48% / reading 28%, grade F, #51 of 333 statewide, top 16%, 426 students, 0% FRL); Riverside High School (math 27% / reading 27%, grade F, #104 of 332 statewide, top 33%, 460 students, 0% FRL) — zoned schools average 0% FRL vs 50% district-wide (50 pts lower); this property's tenant base skews higher-income than the district average.
- Market conditions: 76 active listings in the ZIP; 10 units permitted in Decatur County in 2024 (0 in 5+ unit buildings).
Forward outlook
- In year one you build about $6k of equity ($408 loan paydown + $6k appreciation (10.0% local appreciation)).
- Decatur County population projected at -16% by 2050 — secular population decline; favor cash flow + early exit over multi-decade hold.
- By year 6, paydown + projected appreciation supports a ~$37k cash-out refi (75% LTV) — recoverable capital for the next deal without selling this one.
Negotiation context
- It's been on market 26 days — a 2% lower offer ($58k) is reasonable based on typical stale-listing flexibility.
Risks & watch-outs
- Watch-outs: flood insurance adds $427/mo.
- Climate carrying-cost: in FEMA flood zone AE (mandatory federal flood insurance); extreme-heat days projected 7→20/yr by 2055 (HVAC capex compounding) — expect insurance premiums to compound above CPI over the hold.
Questions for the listing agent
- What do current leases actually rent for vs. the listed asking? Can we see a recent rent roll and the last 12 months of T-12 income?
- What's the actual annual flood-insurance premium (NFIP or private), and is the property in a SFHA with mandatory coverage?
- Is there a deadline driving the sale (1031 exchange, divorce, estate, relocation)? That informs how much negotiation room exists.
- Schools are F-rated, which usually means shorter tenancies and higher turnover. Who's the typical renter profile here, and what's been the actual vacancy rate?
- Crime grade is F in this area — have there been break-ins, vandalism, or insurance claims at this property in the last 3 years? What carrier currently insures it and at what premium?
- What's the average days-on-market for RENTAL listings here right now (not sales)? A rising rental-DOM trend means longer vacancies and softer asking-rent achievability than the comps imply.
- What's the recent tenant-quality profile in this submarket — average credit score on applications, eviction rate, late-payment / NSF rate, and stable-employment percentage? A property-management company in the area should have these aggregated.
- How much new for-sale + rental construction is in the pipeline within 1–3 miles? Heavy new supply typically softens prices + rents 12–24 months out; constrained supply supports both.
Investment metrics
- 1% rule
- 1.37% ✓
- Cap rate
- 12.20%
- Cash-on-cash
- 21.11%
- DSCR
- 1.94
- GRM
- 6.1
CMA / ARV
No comps found within radius.
Projected returns pro-forma
10.0% appreciation · 3.0% rent growth · sell at horizon
- IRR
- 17.5%
- Equity multiple
- 2.44×
- Total profit
- $23,713
- Equity at exit
- $53,152
- IRR
- 16.6%
- Equity multiple
- 5.67×
- Total profit
- $77,110
- Equity at exit
- $114,624
Cash invested: $16,520 (down + closing). Projections, not guarantees.
Landlord ↔ Tenant lean methodology
- Overall (STATE)
- 87 Strongly Landlord-Friendly
- State Tennessee
- 87 Strongly Landlord-Friendly · R+13
- County
- — inherits STATE
- City
- — inherits STATE
ZIP-level market 38329
- Home prices YoY
- 7.5%
- Active inventory
- 76
- Price-to-rent
- 6.1×
Monthly cashflow live
- Estimated rent
- $808 medium interval (Pro) →
- Mortgage (P&I)
- −$309
- Tax from tax record
- −$14 /mo · $162/yr
- Insurance
- −$25
- Flood insurance flood zone
- −$427 /mo · $5,118/yr
- HOA
- −$0
- Vacancy / Maint / Mgmt
- −$170
- Net cashflow
- $-136
Break-even live
Sensitivity live
| Price | -10% $-103 | -5% $-119 | +0% $-136 | +5% $-153 | +10% $-169 |
|---|---|---|---|---|---|
| Rent | -10% $-200 | -5% $-168 | +0% $-136 | +5% $-104 | +10% $-72 |
| Rate | -1.0pp $-106 | -0.5pp $-121 | base $-136 | +0.5pp $-151 | +1.0pp $-167 |
UW: 25.0% down · 7.5% · 30yr · 1.5% tax · 5.0% vac · 8.0% maint · 8.0% mgmt
Financing live
Cash to close
- Down payment
- $14,750
- Closing costs
- $1,770
- Reserves months
- —
- Total cash needed
- —
Loan-product check · same deal, 3 products live
Conventional
25% down · 7.5% · 30yr
- Down + closing
- —
- Monthly P&I
- —
- Monthly cashflow
- —
- DSCR
- —
- Eligible?
- —
Personal DTI + credit; lowest rate.
DSCR
20% down · 8.5% · 30yr
- Down + closing
- —
- Monthly P&I
- —
- Monthly cashflow
- —
- DSCR
- —
- Eligible?
- —
No personal income docs; deal must DSCR.
Hard money
10% down · 12.0% · 12mo
- Down + closing
- —
- Monthly P&I
- —
- Monthly cashflow
- —
- DSCR
- —
- Eligible?
- —
Short-term bridge; refi at stabilization.
Listing history 17 events
-
2026-06-21days on market $59,000 Active 26 DOM
-
2026-06-21days on market $59,000 Active 25 DOM
-
2026-06-18days on market $59,000 Active 23 DOM
-
2026-06-17days on market $59,000 Active 22 DOM
-
2026-06-16days on market $59,000 Active 21 DOM
-
2026-06-15days on market $59,000 Active 20 DOM
-
2026-06-13days on market $59,000 Active 18 DOM
-
2026-06-12days on market $59,000 Active 17 DOM
-
2026-06-09days on market $59,000 Active 14 DOM
-
2026-06-08days on market $59,000 Active 13 DOM
-
2026-06-08days on market $59,000 Active 12 DOM
-
2026-06-07days on market $59,000 Active 11 DOM
-
2026-06-03days on market $59,000 Active 8 DOM
-
2026-06-02days on market $59,000 Active 7 DOM
-
2026-06-01days on market $59,000 Active 6 DOM
-
2026-05-31days on market $59,000 Active 5 DOM
-
2026-05-26$59,000 Active
ⓘ Source: listings_history table (triggers on properties + properties_extension) + one-shot
backfill from property_details.listing_events for pre-trigger history.
Tax reassessment forecast TN · Resets to sale price
- Current annual tax
- $162 · $14/mo
- Projected year-2 tax
- $419 · $35/mo
- Expected delta
- +$257/yr (+$21/mo · 158.6%)
ⓘ Screening estimate from a state-policy table — verify with the county assessor before closing.
Climate risk First Street
- Flood 1/10 Low FEMA zone AE · 0% chance over 30 yrs
- Wildfire 1/10 Low
- Heat 5/10 Major 7 d/yr ≥108°F today · 20 d/yr by 30 yrs out
- Wind 4/10 Moderate 22% chance of damaging wind over 30 yrs
- Air quality 1/10 Low 0 unhealthy d/yr today · 0 by 30 yrs out
Nearby sold comps map
Loading sold comps map…
Walkable amenities ~0.75 mi
Loading nearby amenities…
Taxation est. · year 1
- Rental income
- $9,693
- − Mortgage interest
- −$3,305
- − Property taxes
- −$162
- − Insurance
- −$5,414
- − Repairs & maintenance
- −$775
- − Management
- −$775
- − Depreciation
- −$1,716
- Taxable loss
- −$2,455
- Est. tax savings @ 24.0%
- +$589
- After-tax cash flow
- $-1,042/yr
For passive investors: Depreciation is non-cash, so a rental often shows a tax loss while cash-flowing — sheltering income. Rental losses are passive: they offset passive income freely, and up to $25,000/yr can offset ordinary (W-2) income if you actively participate and your MAGI is under $100k (phasing out to $0 by $150k); unused losses carry forward. On sale, claimed depreciation is recaptured at up to 25%, and gains may owe capital-gains tax (a 1031 exchange can defer both). Figures are a year-1 estimate at your 24.0% rate — not tax advice; consult a CPA.
Schools (NCES district)
- District
- Decatur County
- NCES district ID
- 4700960
- Math proficiency
- 45% ▼ -5.00%
- Reading proficiency
- 33% ▬ 0.00%
- Median HH income
- $34,877
- Composite
- 32.28/100
- National rank
- #5756
- State rank
- #19 of 139 in TN
Livability — Decaturville
- Score
- 55/100
- State rank
- #358
- US rank
- #23418
Category grades
Schools grade is shown separately in the Schools card above.
Census & demographics
- Population (ZIP)
- 3,258
Population outlook (Decatur County) Hauer SSP2
- Today (2025)
- 11,311 people
- By 2030
- 10,995 · -2.8%
- By 2040
- 10,268 · -9.2%
- By 2050
- 9,512 · -15.9%
- By 2075
- 7,988 · -29.4%
- By 2100
- 6,639 · -41.3%
Race, ethnicity, and origin ACS 2023
- Neighborhood character
- Predominantly White (91%)
- Race & ethnicity
- White 91% Hispanic / Latino 5% Two or more races 5% Black 2%
- Hispanic origin (detail)
- Mexican 2%
- Common ancestry
- Italian 2% Lithuanian 2% Portuguese 1%
- Foreign-born
- 1% · Canada
- Languages at home
- 98% English-only · Spanish 2%
Political lean MEDSL · Decatur
- 2024 margin
- Solid R (+69.1) · D 15.0% · R 84.1%
- 2008→2024 swing
- -36.9pp toward R · 2008: -32.2pp · 2024: -69.1pp
- All cycles
- 2024: R+69.1 2020: R+63.4 2016: R+58.7 2012: R+37.0 2008: R+32.2
Not yet ingested
- Civics
- —
Market trends
- HPI YoY
- ▲ 18.33%
- Current HPI
- 261.5988
- Rent YoY
- —
- Metro
- —
- State GDP YoY
- ▲ 2.78%
- F500 in state
- 22
Industry mix (Fortune 500 HQ in TN)
| Industry | F500 HQs | Revenue |
|---|---|---|
| Healthcare | 3 | $91B |
|
||
| Retail | 3 | $72B |
|
||
| Transportation / Logistics | 1 | $88B |
|
||
| Paper / Packaging | 1 | $19B |
|
||
| Insurance | 1 | $13B |
|
||
| Energy | 1 | $12B |
|
||
Price history
1 event — show timeline
- 2026-05-26 Listed $59,000 CWTAR
Property tax history
-1.5%/yrLatest (2025): $162 · +149.2% YoY. Source: county tax records.
Cash-flow waterfall
monthlySold comps — $/sqft
last 12 mo · ≤1 miLoading sold comps…