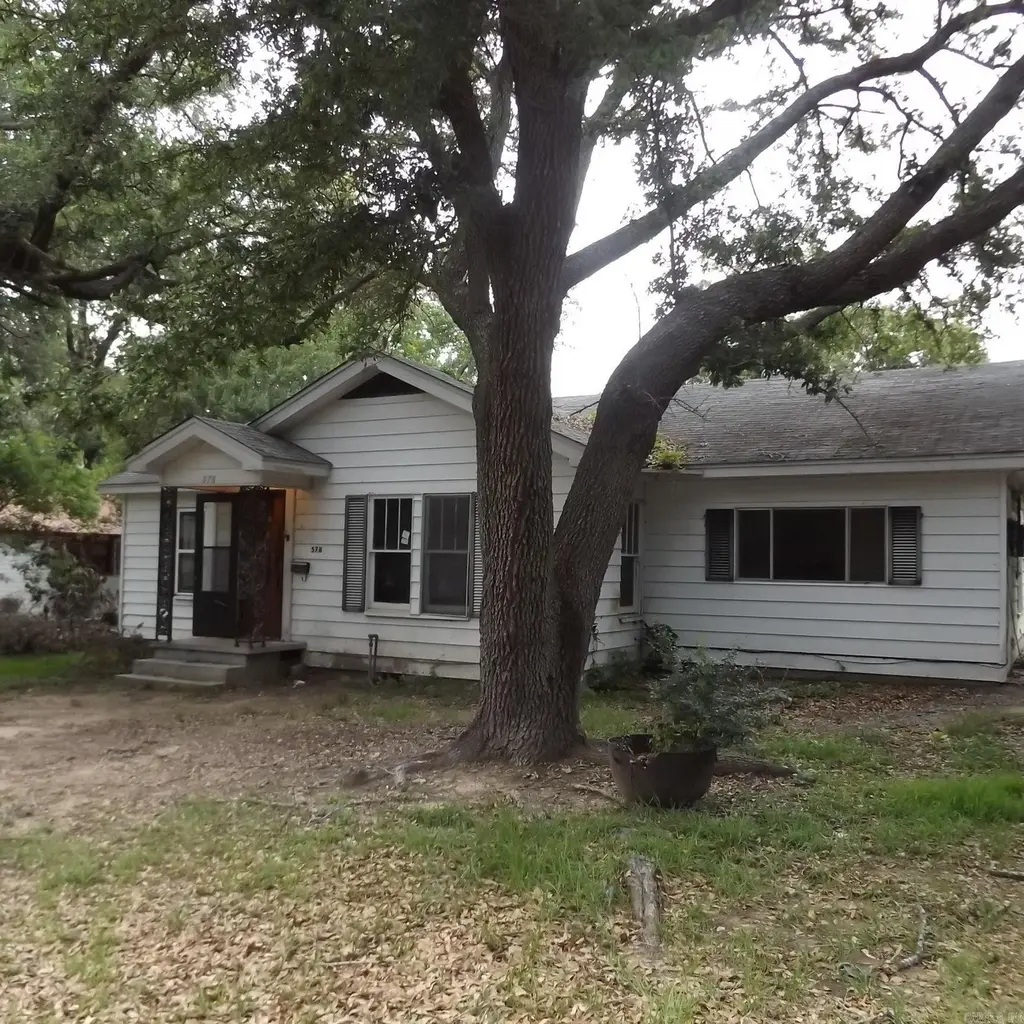
578 Jenkins St · Camden, AR
Flood risk No data
- FEMA flood zone
- —
- Chance of flooding over 30 yrs
- —
- Est. flood insurance / yr
- —
Fire risk No data
- Est. fire insurance / yr
- —
Heat risk No data
- Hot days now (above threshold)
- —
- Hot days in 30 yrs
- —
Wind risk No data
- Chance of severe wind over 30 yrs
- —
Air-quality risk No data
- Unhealthy air days now
- —
- Unhealthy air days in 30 yrs
- —
Risk factors via First Street. Map © Google.
Why this score? — see what drove the D grade
The composite is a weighted blend of 9 inputs, each scored 0–100. Each bar is that input's sub-score; the figure is the points it added to the 100-point composite (weight × sub-score).
- Cash flow +15.0/30.0
- ARV discount +7.5/15.0
- 1% rule +5.0/10.0
- DSCR +5.0/10.0
- Livability +2.9/5.0
- Rent growth +2.5/5.0
- Condition / age +2.5/5.0
- Schools +0.9/10.0
- Appreciation +0.0/10.0
$24,000
🖨 Deal sheet (PDF) 📄 Offer letter ✓ Due diligence
Listing remarks MLS
Very solid built 3 bedroom 1.5 bath home waiting for its new family to call it home. 1 car garage and a nice spacious yard for the kids or 4 legged mates to play! Lot size, year built, and square footage taken from courthouse records.
Key facts
- 0.32 acre lot
- Parking
- Built 1945
Property features AI
Finance
- Other: Lot size approximately 0.32 acres
Exterior
- Parking: Carport for 1 car
- Utilities: Public sewer; Public water; Municipal electric (Entergy); Natural gas
- Home design: Single-family property
- Construction: Wood construction; Piers foundation; Composition roof
- Exterior features: Wood exterior; Composition roof; Paved road access; Sloped lot; Located inside city limits
Interior
- Kitchen: Free-standing stove; Microwave; Refrigerator stays
- Flooring: Carpet; Vinyl
- Bathrooms: 1 full bathroom; 1 half bathroom
- Heating & cooling: Gas space heater
- Interior features: Carpet and vinyl flooring; Free-standing stove, microwave, and refrigerator (stays)
Neighborhood map
What this means for you Summary
Snapshot
- This is a 3-bed/1.5-bath single-family listed at $24k.
Deal economics
- At list price, monthly cash flow is $907 ($11k/yr) — positive.
- The deal already cash-flows at list — no discount required.
- Meets the 1% rule at list price ($1k rent vs $24k).
- Recommended offer: $24k (1.5% below list) — sets the bar for market timing.
- Cap rate 51.7% vs local median 4.9% in Camden — top-decile yield for the area; either an underpriced asset or a hidden risk that comps aren't pricing in. Stress-test before assuming the spread holds.
Location & tenants
- Location reads 57/100 on livability (#364 in AR) — a working-class tenant base; expect higher turnover. Strengths: cost of living A+, housing A+, health & safety A+; Watch: schools F, crime F, amenities F.
- Camden Fairview School District (town): math 9% / reading 15% proficiency, ranked #229 of 238 in AR (top 96%) — low school quality limits family demand, transient renter base, plan for 1-2y turnover; 68% free/reduced lunch — lower-income household profile, screen leases tightly.
- Market conditions: 131 active listings in the ZIP; 18 units permitted in Ouachita County in 2024 (0 in 5+ unit buildings).
Forward outlook
- Local home prices are declining (-3.0%/yr); year-one equity from $166 of loan paydown is wiped out by about $720 of value loss. Plan a longer hold.
- Ouachita County population projected at -33% by 2050 — secular population decline; favor cash flow + early exit over multi-decade hold.
- At projected returns (-3.0% appreciation + 3.0% rent growth), your $7k cash investment doubles in ~1 year — after that, you're playing with house money.
Negotiation context
- It's been on market 21 days — a 2% lower offer ($24k) is reasonable based on typical stale-listing flexibility.
- 2 sale attempts since 4y ago with the ask held roughly flat each time — persistent listings suggest the price (not the market) is what's stuck; bring a comps-based counter.
Risks & watch-outs
- Watch-outs: built in 1945 — expect roof / HVAC / electrical / plumbing capex.
Questions for the listing agent
- Built in 1945 — when were the roof, HVAC, electrical panel, plumbing, and water heater last replaced?
- Is there a deadline driving the sale (1031 exchange, divorce, estate, relocation)? That informs how much negotiation room exists.
- Schools are F-rated, which usually means shorter tenancies and higher turnover. Who's the typical renter profile here, and what's been the actual vacancy rate?
- Crime grade is F in this area — have there been break-ins, vandalism, or insurance claims at this property in the last 3 years? What carrier currently insures it and at what premium?
- The area grade is low — what's the realistic commute time and amenity access for the typical tenant pool here? Any planned neighborhood developments (good or bad) we should know about?
- What's the average days-on-market for RENTAL listings here right now (not sales)? A rising rental-DOM trend means longer vacancies and softer asking-rent achievability than the comps imply.
- What's the recent tenant-quality profile in this submarket — average credit score on applications, eviction rate, late-payment / NSF rate, and stable-employment percentage? A property-management company in the area should have these aggregated.
- How much new for-sale + rental construction is in the pipeline within 1–3 miles? Heavy new supply typically softens prices + rents 12–24 months out; constrained supply supports both.
Investment metrics
- 1% rule
- 5.63% ✓
- Cap rate
- 51.65%
- Cash-on-cash
- 161.99%
- DSCR
- 8.21
- GRM
- 1.5
CMA / ARV
- ARV (on-the-fly)
- $145,410
- Comps found
- 12
Show comp detail 12 sales within ~0.75 mi
| Address | Dist | Beds/Ba | Sqft | Sold | Price | $/sf | Match |
|---|---|---|---|---|---|---|---|
| 2526 Williams St | 0.07mi | 2/2.0 (-1) | 1,232 (-6%) | 7mo | $110,000 | $89 | 74 |
| 2585 Warren Ave | 0.25mi | 3/1.0 | 1,344 (+3%) | 14mo | $163,000 | $121 | 70 |
| 719 Waco St | 0.27mi | 3/2.0 | 1,422 (+8%) | 1mo | $158,500 | $111 | 70 |
| 547 Pierce St | 0.35mi | 3/2.0 | 1,247 (-5%) | 11mo | $150,000 | $120 | 64 |
| 802 Waco St | 0.37mi | 2/2.0 (-1) | 1,200 (-8%) | 1mo | $166,800 | $139 | 61 |
| 538 Pierce St | 0.38mi | 3/2.0 | 1,475 (+13%) | 1mo | $42,000 | $28 | 59 |
| 1084 Caddo | 0.70mi | 3/2.0 | 1,320 (+1%) | 7mo | $139,000 | $105 | 59 |
| 2240 Avon Ave | 0.31mi | 3/2.0 | 1,494 (+14%) | 3mo | $139,900 | $94 | 57 |
| 2323 Dover St | 0.26mi | 2/1.0 (-1) | 1,120 (-14%) | 5mo | $5,000 | $4 | 53 |
| 2750 Mimosa Ave | 0.52mi | 3/2.0 | 1,496 (+14%) | 2mo | $175,000 | $117 | 48 |
| 1081 Caddo St | 0.71mi | 3/2.0 | 1,427 (+9%) | 5mo | $185,000 | $130 | 46 |
| 610 North St | 0.51mi | 3/2.0 | 1,461 (+12%) | 16mo | $100,000 | $68 | 42 |
Match score weights: distance 35% · size 25% · config 20% · recency 20%. Top-matched comps best support the ARV.
Projected returns pro-forma
-3.0% appreciation · 3.0% rent growth · sell at horizon
- IRR
- —
- Equity multiple
- 9.02×
- Total profit
- $53,905
- Equity at exit
- $3,578
- IRR
- —
- Equity multiple
- 19.07×
- Total profit
- $121,406
- Equity at exit
- $2,075
Cash invested: $6,720 (down + closing). Projections, not guarantees.
Landlord ↔ Tenant lean methodology
- Overall (STATE)
- 92 Strongly Landlord-Friendly
- State Arkansas
- 92 Strongly Landlord-Friendly · R+14
- County
- — inherits STATE
- City
- — inherits STATE
ZIP-level market 71701
- Home prices YoY
- -20.5%
- Active inventory
- 131
- Price-to-rent
- 1.5×
Monthly cashflow live
- Estimated rent
- $1,351 medium interval (Pro) →
- Mortgage (P&I)
- −$126
- Tax from tax record
- −$24 /mo · $289/yr
- Insurance
- −$10
- HOA
- −$0
- Vacancy / Maint / Mgmt
- −$284
- Net cashflow
- $907
Break-even live
Sensitivity live
| Price | -10% $921 | -5% $914 | +0% $907 | +5% $900 | +10% $894 |
|---|---|---|---|---|---|
| Rent | -10% $800 | -5% $854 | +0% $907 | +5% $961 | +10% $1,014 |
| Rate | -1.0pp $919 | -0.5pp $913 | base $907 | +0.5pp $901 | +1.0pp $895 |
UW: 25.0% down · 7.5% · 30yr · 1.5% tax · 5.0% vac · 8.0% maint · 8.0% mgmt
Financing live
Cash to close
- Down payment
- $6,000
- Closing costs
- $720
- Reserves months
- —
- Total cash needed
- —
Loan-product check · same deal, 3 products live
Conventional
25% down · 7.5% · 30yr
- Down + closing
- —
- Monthly P&I
- —
- Monthly cashflow
- —
- DSCR
- —
- Eligible?
- —
Personal DTI + credit; lowest rate.
DSCR
20% down · 8.5% · 30yr
- Down + closing
- —
- Monthly P&I
- —
- Monthly cashflow
- —
- DSCR
- —
- Eligible?
- —
No personal income docs; deal must DSCR.
Hard money
10% down · 12.0% · 12mo
- Down + closing
- —
- Monthly P&I
- —
- Monthly cashflow
- —
- DSCR
- —
- Eligible?
- —
Short-term bridge; refi at stabilization.
Listing history 19 events
-
2026-06-17status $24,000 Under Contract 21 DOM
-
2026-06-16days on market $24,000 Active 21 DOM
-
2026-06-15days on market $24,000 Active 20 DOM
-
2026-06-14days on market $24,000 Active 18 DOM
-
2026-06-12days on market $24,000 Active 17 DOM
-
2026-06-09days on market $24,000 Active 14 DOM
-
2026-06-08days on market $24,000 Active 13 DOM
-
2026-06-07days on market $24,000 Active 12 DOM
-
2026-06-05days on market $24,000 Active 10 DOM
-
2026-06-04days on market $24,000 Active 8 DOM
-
2026-06-02statusdays on market $24,000 Active 7 DOM
-
2026-06-01days on market $24,000 New Listing 6 DOM
-
2026-05-31days on market $24,000 New Listing 5 DOM
-
2026-05-31days on market $24,000 New Listing 4 DOM
-
2026-05-24$24,000 New Listing
-
2023-10-02soldstatus $65,000
-
2023-09-28soldstatus $65,000 Sold 236-char remark
Show marketing remark (236 chars)
Very solid built 3 bedroom 1.5 bath home waiting for its new family to call it home. 1 car garage and a nice spacious yard for the kids or 4 legged mates to play! Lot size, year built, and square footage taken from courthouse records.
-
2023-08-09status Under Contract 236-char remark
Show marketing remark (236 chars)
Very solid built 3 bedroom 1.5 bath home waiting for its new family to call it home. 1 car garage and a nice spacious yard for the kids or 4 legged mates to play! Lot size, year built, and square footage taken from courthouse records.
-
2022-08-22$68,000 New Listing 236-char remark
Show marketing remark (236 chars)
Very solid built 3 bedroom 1.5 bath home waiting for its new family to call it home. 1 car garage and a nice spacious yard for the kids or 4 legged mates to play! Lot size, year built, and square footage taken from courthouse records.
ⓘ Source: listings_history table (triggers on properties + properties_extension) + one-shot
backfill from property_details.listing_events for pre-trigger history.
Tax reassessment forecast AR · Resets to sale price
- Current annual tax
- $289 · $24/mo
- Projected year-2 tax
- $289 · $24/mo
- Expected delta
- $0/yr ($0/mo · 0.0%)
ⓘ Screening estimate from a state-policy table — verify with the county assessor before closing.
Nearby sold comps map
Loading sold comps map…
Walkable amenities ~0.75 mi
Loading nearby amenities…
Taxation est. · year 1
- Rental income
- $16,209
- − Mortgage interest
- −$1,344
- − Property taxes
- −$289
- − Insurance
- −$120
- − Repairs & maintenance
- −$1,297
- − Management
- −$1,297
- − Depreciation
- −$698
- Taxable income
- $11,164
- Est. tax owed @ 24.0%
- −$2,679
- After-tax cash flow
- $8,207/yr
For passive investors: Depreciation is non-cash, so a rental often shows a tax loss while cash-flowing — sheltering income. Rental losses are passive: they offset passive income freely, and up to $25,000/yr can offset ordinary (W-2) income if you actively participate and your MAGI is under $100k (phasing out to $0 by $150k); unused losses carry forward. On sale, claimed depreciation is recaptured at up to 25%, and gains may owe capital-gains tax (a 1031 exchange can defer both). Figures are a year-1 estimate at your 24.0% rate — not tax advice; consult a CPA.
Schools (NCES district)
- District
- Camden Fairview School District
- NCES district ID
- 0506060
- Math proficiency
- 9% ▼ -16.00%
- Reading proficiency
- 15% ▼ -12.00%
- Median HH income
- $30,854
- Composite
- 9.43/100
- National rank
- #9853
- State rank
- #229 of 238 in AR
Livability — Camden
- Score
- 57/100
- State rank
- #364
- US rank
- #22245
Category grades
Schools grade is shown separately in the Schools card above.
Census & demographics
- Census place
- Camden, AR
- City population
- 17,883
- Population (ZIP)
- 17,883
Population outlook (Ouachita County) Hauer SSP2
- Today (2025)
- 21,485 people
- By 2030
- 19,947 · -7.2%
- By 2040
- 16,990 · -20.9%
- By 2050
- 14,431 · -32.8%
- By 2075
- 10,003 · -53.4%
- By 2100
- 7,418 · -65.5%
Race, ethnicity, and origin ACS 2023
- Neighborhood character
- Diverse neighborhood (Simpson 0.56)
- Race & ethnicity
- White 53% Black 39% Hispanic / Latino 5% Two or more races 4%
- Hispanic origin (detail)
- Mexican 4%
- Common ancestry
- Slovak 2% Iranian 1% Lithuanian 1%
- Foreign-born
- 1% · Canada
- Languages at home
- 97% English-only · Spanish 3%
Political lean MEDSL · Ouachita
- 2024 margin
- R (+19.1) · D 39.5% · R 58.6% · Other 1.8%
- 2008→2024 swing
- -8.2pp toward R · 2008: -10.9pp · 2024: -19.1pp
- All cycles
- 2024: R+19.1 2020: R+13.5 2016: R+10.4 2012: R+8.6 2008: R+10.9
Not yet ingested
- Civics
- —
Market trends
- HPI YoY
- ▼ -44.10%
- Current HPI
- 171.0106
- Rent YoY
- —
- Metro
- —
- State GDP YoY
- ▲ 3.80%
- F500 in state
- 10
Industry mix (Fortune 500 HQ in AR)
| Industry | F500 HQs | Revenue |
|---|---|---|
| Retail | 1 | $681B |
|
||
| Food / Agriculture | 1 | $53B |
|
||
| Retail / Energy | 1 | $22B |
|
||
| Transportation / Logistics | 1 | $12B |
|
||
| Energy | 1 | $4B |
|
||
Price history
-64.7% since first listed5 events — show timeline
- 2026-05-24 Listed $24,000 CARMLS
- 2023-10-02 Sold (Public Records) $65,000 Public Records
- 2023-09-28 Sold (MLS) $65,000 CARMLS
- 2023-08-09 Pending — CARMLS
- 2022-08-22 Listed $68,000 CARMLS
Property tax history
-0.8%/yrLatest (2025): $289 · +10.0% YoY. Source: county tax records.
Cash-flow waterfall
monthlySold comps — $/sqft
last 12 mo · ≤1 miLoading sold comps…