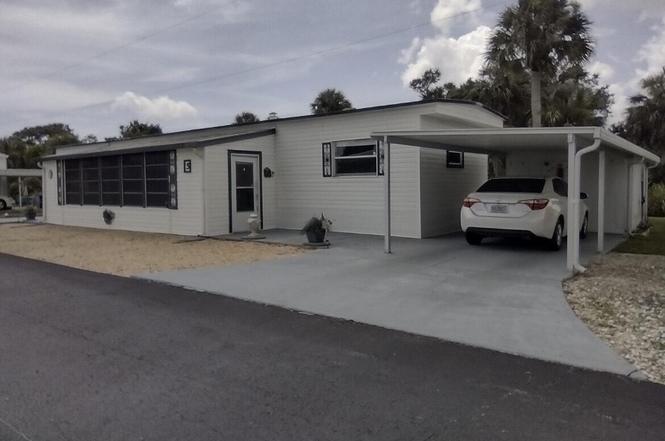
13827 S Indian River Dr #5 · Jensen Beach, FL
Flood risk 6/10 · Moderate
- FEMA flood zone
- X (unshaded)
- Chance of flooding over 30 yrs
- 0.59%
- Est. flood insurance / yr
- $507 – $1,088
Fire risk 3/10 · Minor
- Est. fire insurance / yr
- $947 – $1,759
Heat risk 10/10 · Severe
- Hot days now (above 106°F)
- 7 days/yr
- Hot days in 30 yrs
- 21 days/yr
Wind risk 10/10 · Severe
- Chance of severe wind over 30 yrs
- 99.0%
Air-quality risk 2/10 · Minimal
- Unhealthy air days now
- 1 days/yr
- Unhealthy air days in 30 yrs
- 2 days/yr
Risk factors via First Street. Map © Google.
Why this score? — see what drove the B grade
The composite is a weighted blend of 9 inputs, each scored 0–100. Each bar is that input's sub-score; the figure is the points it added to the 100-point composite (weight × sub-score).
- Cash flow +30.0/30.0
- 1% rule +10.0/10.0
- DSCR +10.0/10.0
- ARV discount +9.0/15.0
- Schools +3.7/10.0
- Livability +3.5/5.0
- Rent growth +2.8/5.0
- Condition / age +2.5/5.0
- Appreciation +0.0/10.0
$129,000
🖨 Deal sheet 📄 Offer letter ✓ Due diligence
Listing remarks MLS
2007 2/2 Jacobsen double wide manufactured home with 1152 sqft. under air with new a/c and LG washer & dryer. Tile throughout, hurrican shutters, storage shed. 55+ park, 1/69th share, HOA fee of just $125/mo. includes water, sewer, & garbage.
Key facts
- Walk-in closet
- Indian river drive
- Ensuite bathroom
Tags
Property features AI
Finance
- Financial info: Pets allowed with possible restrictions, breed/number limits may apply
- HOA & community: Has association; Monthly HOA fee; Association amenities include boating, beach access, private beach pavilion, clubhouse, community room, billiard room, bocce ball, jogging path, storage; HOA covers water, sewer, trash and common areas; Senior community
Exterior
- Parking: Attached carport; Carport; RV access/parking
- Utilities: Well water; Three-phase electric; Cable available; Water service available
- Home design: Condominium; Single-story; Northeast facing; Resale property; Modular construction with vinyl siding
- Construction: Vinyl siding; Modular construction; 1 story
- Exterior features: Not waterfront
Interior
- Kitchen: Electric range; Microwave; Refrigerator
- Bedrooms: 1 bedroom on the main level
- Flooring: Laminate flooring
- Bathrooms: 1 full bathroom (main level)
- Heating & cooling: Central heating; Central air conditioning
- Interior features: Walk-in closet(s); Unfurnished
Neighborhood map
What this means for you Summary
Snapshot
- This is a 1-bed/1.0-bath manufactured listed at $129k.
Deal economics
- At list price, monthly cash flow is $540 ($6k/yr) — positive.
- The deal already cash-flows at list — no discount required.
- Meets the 1% rule at list price ($2k rent vs $129k).
- Recommended offer: $114k (12.0% below list) — sets the bar for market timing.
- Cap rate 11.3% vs local median 4.1% in Jensen Beach — top-decile yield for the area; either an underpriced asset or a hidden risk that comps aren't pricing in. Stress-test before assuming the spread holds.
Location & tenants
- Location reads 70/100 on livability (#432 in FL) — a middle-class / working-renter tenant base. Strengths: crime A+, housing A+, cost of living B+; Watch: amenities F, commute F, health & safety D-.
- St. Lucie (urban): math 40% / reading 48% proficiency, ranked #51 of 73 in FL (top 70%) — families likely to look elsewhere, expect single-tenant / working-renter base with shorter leases.
- Market conditions: Rents rising (+1.0%/yr); 536 active listings in the ZIP; 4 comparable units currently listed for rent nearby; rentals at typical pace (median 24d on market — plan ~3-4 weeks tenant-placement turnaround); 4,868 units permitted in St. Lucie County in 2024 (268 in 5+ unit buildings).
- This rent runs 36% of the median local income ($70k/yr) — at the standard rent-burdened threshold; future hikes will face affordability resistance.
Forward outlook
- Local home prices are declining (-3.0%/yr); year-one equity from $892 of loan paydown is wiped out by about $4k of value loss. Plan a longer hold.
- St. Lucie County population projected at +20% by 2050 — long-run rental-demand tailwind backs the buy-and-hold thesis.
- At projected returns (-3.0% appreciation + 1.0% rent growth), your $36k cash investment doubles in ~9 years — after that, you're playing with house money.
Negotiation context
- It's been on market 325 days — a 12% lower offer ($114k) is reasonable based on typical stale-listing flexibility.
- 2 sale attempts since 13y ago; this cycle's ask has dropped $46k (26%) from the opening price — seller is motivated, your offer sets the floor, not the list.
- Current owner paid $35k; list at $129k implies a 269% gain — meaningful room to come down on a strong offer.
Risks & watch-outs
- Climate carrying-cost: major flood risk; severe wind risk, 99% chance of damaging wind over 30y; extreme-heat days projected 7→21/yr by 2055 (HVAC capex compounding) — expect insurance premiums to compound above CPI over the hold.
Questions for the listing agent
- It's been on market 325 days. Have you received any prior offers? Is the seller open to a 12% concession, seller financing, or rate buy-down credit?
- What does the HOA fee cover, when was the last increase, and are there any pending special assessments or reserve-fund shortfalls?
- Why hasn't it sold? Are there any deal-killer items the seller is aware of (foundation, flood, title, zoning, code violations)?
- Is there a deadline driving the sale (1031 exchange, divorce, estate, relocation)? That informs how much negotiation room exists.
- Schools are B-rated — typically a magnet for longer-tenancy family renters. What's the average tenant stay here, and is there a school-zone premium baked into asking?
- What's the average days-on-market for RENTAL listings here right now (not sales)? A rising rental-DOM trend means longer vacancies and softer asking-rent achievability than the comps imply.
- What's the recent tenant-quality profile in this submarket — average credit score on applications, eviction rate, late-payment / NSF rate, and stable-employment percentage? A property-management company in the area should have these aggregated.
- How much new for-sale + rental construction is in the pipeline within 1–3 miles? Heavy new supply typically softens prices + rents 12–24 months out; constrained supply supports both.
Investment metrics
- 1% rule
- 1.65% ✓
- Cap rate
- 11.31%
- Cash-on-cash
- 17.92%
- DSCR
- 1.80
- GRM
- 5.0
CMA / ARV
- ARV (on-the-fly)
- $133,560
- Comps found
- 3
Show comp detail 3 sales within ~0.75 mi
| Address | Dist | Beds/Ba | Sqft | Sold | Price | $/sf | Match |
|---|---|---|---|---|---|---|---|
| 4728 NE Blue Heron Ln | 0.22mi | 2/1.0 (+1) | 810 (-4%) | 24mo | $135,000 | $167 | 59 |
| 4775 NE Blue Heron Ln | 0.30mi | 2/2.0 (+1) | 849 (+1%) | 22mo | $135,000 | $159 | 57 |
| 4759 NE Blue Heron Ln | 0.27mi | 2/2.0 (+1) | 909 (+8%) | 10mo | $125,000 | $138 | 56 |
Match score weights: distance 35% · size 25% · config 20% · recency 20%. Top-matched comps best support the ARV.
Projected returns pro-forma
-3.0% appreciation · 1.0% rent growth · sell at horizon
- IRR
- 6.9%
- Equity multiple
- 1.26×
- Total profit
- $9,437
- Equity at exit
- $19,234
- IRR
- 14.1%
- Equity multiple
- 2.01×
- Total profit
- $36,634
- Equity at exit
- $11,154
Cash invested: $36,120 (down + closing). Projections, not guarantees.
Landlord ↔ Tenant lean methodology
- Overall (STATE)
- 87 Strongly Landlord-Friendly
- State Florida
- 87 Strongly Landlord-Friendly · R+3
- County
- — inherits STATE
- City
- — inherits STATE
ZIP-level market 34957
- Rents YoY
- 1.0%
- Active inventory
- 536
- Price-to-rent
- 5.0×
Monthly cashflow live
- Estimated rent
- $2,134 medium interval (Pro) →
- Mortgage (P&I)
- −$676
- Tax est. 1.5%
- −$161 /mo · $1,935/yr
- Insurance
- −$54
- HOA
- −$255
- Vacancy / Maint / Mgmt
- −$448
- Net cashflow
- $540
Break-even live
UW: 25.0% down · 7.5% · 30yr · 1.5% tax · 5.0% vac · 8.0% maint · 8.0% mgmt
Financing live
Cash to close
- Down payment
- $32,250
- Closing costs
- $3,870
- Reserves months
- —
- Total cash needed
- —
Loan-product check · same deal, 3 products live
Conventional
25% down · 7.5% · 30yr
- Down + closing
- —
- Monthly P&I
- —
- Monthly cashflow
- —
- DSCR
- —
- Eligible?
- —
Personal DTI + credit; lowest rate.
DSCR
20% down · 8.5% · 30yr
- Down + closing
- —
- Monthly P&I
- —
- Monthly cashflow
- —
- DSCR
- —
- Eligible?
- —
No personal income docs; deal must DSCR.
Hard money
10% down · 12.0% · 12mo
- Down + closing
- —
- Monthly P&I
- —
- Monthly cashflow
- —
- DSCR
- —
- Eligible?
- —
Short-term bridge; refi at stabilization.
Rent comps 4 comps
| Address | Beds | Baths | Sqft | Rent | $/sqft | DOM | Units | Dist |
|---|---|---|---|---|---|---|---|---|
| 4220 NE Indian River Dr #2 Jensen Beach, FL | 2.0 | 1.5 | 900 | $2,200 | $2.44 | 23d | 1 | 0.77mi |
| 4220 NE Indian River Dr #5 Jensen Beach, FL | 1.0 | 1.0 | 560 | $1,800 | $3.21 | 23d | 1 | 0.77mi |
| 3663 NE Barbara Dr Jensen Beach, FL | 2.0 | 1.0 | 991 | $2,450 | $2.47 | 23d | 1 | 1.09mi |
| 1161 Nettles Blvd Unit 1546132P Jensen Beach, FL | 2.0 | 2.0 | 710 | $4,838 | $6.81 | 14d | 1 | 1.48mi |
HOA detail
- Monthly dues
- $255 · $3,060/yr
- Likely covers
- watersewertrash
Listing history 25 events
-
2026-06-18days on market $129,000 Active 325 DOM
-
2026-06-17days on market $129,000 Active 324 DOM
-
2026-06-16days on market $129,000 Active 323 DOM
-
2026-06-15days on market $129,000 Active 322 DOM
-
2026-06-14days on market $129,000 Active 320 DOM
-
2026-06-13days on market $129,000 Active 319 DOM
-
2026-06-10days on market $129,000 Active 317 DOM
-
2026-06-09days on market $129,000 Active 316 DOM
-
2026-06-08days on market $129,000 Active 315 DOM
-
2026-06-07days on market $129,000 Active 314 DOM
-
2026-06-05days on market $129,000 Active 311 DOM
-
2026-06-03days on market $129,000 Active 310 DOM
-
2026-06-02days on market $129,000 Active 309 DOM
-
2026-06-01days on market $129,000 Active 308 DOM
-
2026-05-31days on market $129,000 Active 307 DOM
-
2026-05-30days on market $129,000 Active 306 DOM
-
2026-05-08price $129,000
-
2026-04-09price $149,000
-
2026-01-27price $159,000
-
2025-10-10price $165,000
-
2025-07-28$175,000 Active
-
2014-09-25historical 253-char remark
Show marketing remark (253 chars)
2007 2/2 Jacobsen double wide manufactured home with 1152 sqft. under air with new a/c and LG washer & dryer. Tile throughout, hurrican shutters, storage shed. 55+ park, 1/69th share, HOA fee of just $125/mo. includes water, sewer, & garbage.
-
2013-03-27$110,000 253-char remark
Show marketing remark (253 chars)
2007 2/2 Jacobsen double wide manufactured home with 1152 sqft. under air with new a/c and LG washer & dryer. Tile throughout, hurrican shutters, storage shed. 55+ park, 1/69th share, HOA fee of just $125/mo. includes water, sewer, & garbage.
-
1995-10-19soldstatus $35,000
-
1995-01-10soldstatus $35,000
ⓘ Source: listings_history table (triggers on properties + properties_extension) + one-shot
backfill from property_details.listing_events for pre-trigger history.
Climate risk First Street
- Flood 6/10 Major FEMA zone X (unshaded) · 59% chance over 30 yrs
- Wildfire 3/10 Moderate
- Heat 10/10 Extreme 7 d/yr ≥106°F today · 21 d/yr by 30 yrs out
- Wind 10/10 Extreme 99% chance of damaging wind over 30 yrs
- Air quality 2/10 Low 1 unhealthy d/yr today · 2 by 30 yrs out
Nearby sold comps map
Loading sold comps map…
Walkable amenities ~0.75 mi
Loading nearby amenities…
Taxation est. · year 1
- Rental income
- $25,610
- − Mortgage interest
- −$7,226
- − Property taxes
- −$1,935
- − Insurance
- −$645
- − Repairs & maintenance
- −$2,049
- − Management
- −$2,049
- − HOA
- −$3,060
- − Depreciation
- −$3,753
- Taxable income
- $4,894
- Est. tax owed @ 24.0%
- −$1,175
- After-tax cash flow
- $5,300/yr
For passive investors: Depreciation is non-cash, so a rental often shows a tax loss while cash-flowing — sheltering income. Rental losses are passive: they offset passive income freely, and up to $25,000/yr can offset ordinary (W-2) income if you actively participate and your MAGI is under $100k (phasing out to $0 by $150k); unused losses carry forward. On sale, claimed depreciation is recaptured at up to 25%, and gains may owe capital-gains tax (a 1031 exchange can defer both). Figures are a year-1 estimate at your 24.0% rate — not tax advice; consult a CPA.
Schools (NCES district)
- District
- St. Lucie
- NCES district ID
- 1201770
- Math proficiency
- 40% ▼ -11.00%
- Reading proficiency
- 48% ▼ -4.00%
- Median HH income
- $44,737
- Composite
- 37.28/100
- National rank
- #4449
- State rank
- #51 of 73 in FL
Livability — Jensen Beach
- Score
- 70/100
- State rank
- #432
- US rank
- #7719
Category grades
Schools grade is shown separately in the Schools card above.
Census & demographics
- County
- Martin County · 165,223 people
- City population
- 23,462
- Metro
- Port St. Lucie, FL
- Population (ZIP)
- 23,462
- Household income
- $70,403
- Rent vs Own
- Severe rent burden
- 946.0
Population outlook (St. Lucie County) Hauer SSP2
- Today (2025)
- 338,016 people
- By 2030
- 355,687 · +5.2%
- By 2040
- 385,521 · +14.1%
- By 2050
- 406,106 · +20.1%
- By 2075
- 441,054 · +30.5%
- By 2100
- 436,885 · +29.2%
Race, ethnicity, and origin ACS 2023
- Neighborhood character
- Predominantly White (85%)
- Race & ethnicity
- White 85% Hispanic / Latino 7% Two or more races 6% Asian 2% Black 2%
- Hispanic origin (detail)
- Mexican 1% Puerto Rican 2% Cuban 1%
- Common ancestry
- Romanian 4% Slovak 3% Lithuanian 3%
- Foreign-born
- 10% · Canada, Jamaica
- Languages at home
- 90% English-only · Spanish 5% Other Indo-European 2% Tagalog/Filipino 1%
Political lean MEDSL · St. Lucie
- 2024 margin
- Lean R (+9.1) · D 45.1% · R 54.2%
- 2008→2024 swing
- -21.2pp toward R · 2008: 12.1pp · 2024: -9.1pp
- All cycles
- 2024: R+9.1 2020: R+1.6 2016: R+2.5 2012: D+7.9 2008: D+12.1
Not yet ingested
- Civics
- —
Market trends
- HPI YoY
- ▼ -319.66%
- Current HPI
- 340.0172
- Rent YoY
- ▲ 1.00%
- Metro
- Port St. Lucie, FL
- State GDP YoY
- ▲ 3.28%
- F500 in state
- 36
Industry mix (Fortune 500 HQ in FL)
| Industry | F500 HQs | Revenue |
|---|---|---|
| Industrial Technology | 2 | $29B |
|
||
| Insurance | 2 | $17B |
|
||
| Retail | 1 | $60B |
|
||
| Technology Distribution | 1 | $58B |
|
||
| Homebuilding | 1 | $35B |
|
||
| Technology Manufacturing | 1 | $35B |
|
||
Price history
+268.6% since first listed9 events — show timeline
- 2026-05-08 Price Changed $129,000 Beaches MLS
- 2026-04-09 Price Changed $149,000 Beaches MLS
- 2026-01-27 Price Changed $159,000 Beaches MLS
- 2025-10-10 Price Changed $165,000 Beaches MLS
- 2025-07-28 Listed $175,000 Beaches MLS
- 2014-09-25 Listing Removed — Beaches MLS
- 2013-03-27 Listed $110,000 Beaches MLS
- 1995-10-19 Sold (Public Records) $35,000 Public Records
- 1995-01-10 Sold (Public Records) $35,000 Public Records
Property tax history
-7.4%/yrLatest (2025): $211 · +7.1% YoY. Source: county tax records.
Cash-flow waterfall
monthlySold comps — $/sqft
last 12 mo · ≤1 miLoading sold comps…