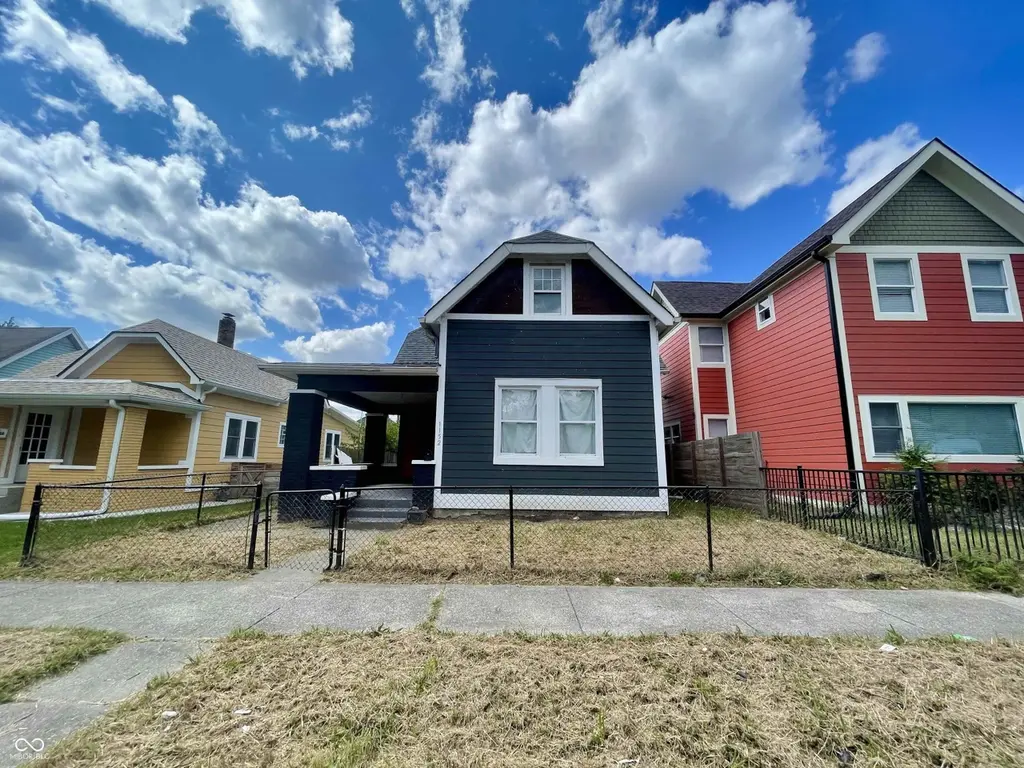
1152 Churchman Ave · Indianapolis city (balance), IN
Flood risk 1/10 · Minimal
- FEMA flood zone
- X (unshaded)
- Chance of flooding over 30 yrs
- 0.0%
- Est. flood insurance / yr
- $473 – $860
Fire risk 1/10 · Minimal
- Est. fire insurance / yr
- $717 – $1,331
Heat risk 4/10 · Minor
- Hot days now (above 101°F)
- 7 days/yr
- Hot days in 30 yrs
- 19 days/yr
Wind risk 2/10 · Minimal
- Chance of severe wind over 30 yrs
- 0.0%
Air-quality risk 4/10 · Minor
- Unhealthy air days now
- 5 days/yr
- Unhealthy air days in 30 yrs
- 7 days/yr
Risk factors via First Street. Map © Google.
Why this score? — see what drove the C+ grade
The composite is a weighted blend of 9 inputs, each scored 0–100. Each bar is that input's sub-score; the figure is the points it added to the 100-point composite (weight × sub-score).
- Cash flow +24.3/30.0
- ARV discount +15.0/15.0
- DSCR +7.8/10.0
- 1% rule +6.9/10.0
- Rent growth +3.2/5.0
- Livability +2.5/5.0
- Condition / age +2.5/5.0
- Schools +1.4/10.0
- Appreciation +0.0/10.0
$189,900
🖨 Deal sheet (PDF) 📄 Offer letter ✓ Due diligence
Listing remarks MLS
This property offers the perfect opportunity for a savvy buyer looking to renovate and add value, or an investor looking to fix-and-flip, add to a rental portfolio, or a long-term hold property. This property features solid bones and a layout with great potential, this home is ready for your vision and updates. Located in a growing area of Indianapolis with nearby amenities. Don't miss your chance to bring this property back to life and maximize its potential!
Key facts
- 4,800 sq ft lot
- 2 garage spots
- Built 1925
Neighborhood map
What this means for you Summary
Snapshot
- This is a 4-bed/2.0-bath single-family listed at $190k.
Deal economics
- At list price, monthly cash flow is $383 ($5k/yr) — positive.
- The deal already cash-flows at list — no discount required.
- Meets the 1% rule at list price ($2k rent vs $190k).
- Recommended offer: $167k (12.0% below list) — sets the bar for market timing.
- Cap rate 8.7% vs local median 4.4% in Indianapolis city (balance) — top-decile yield for the area; either an underpriced asset or a hidden risk that comps aren't pricing in. Stress-test before assuming the spread holds.
Location & tenants
- Location reads: area grade C — affects rentability + tenant quality, not the cash-flow math above.
- Indianapolis Public Schools (urban): math 14% / reading 20% proficiency, ranked #286 of 301 in IN (top 95%) — low school quality limits family demand, transient renter base, plan for 1-2y turnover; 77% free/reduced lunch — lower-income household profile, screen leases tightly.
- Zoned schools: Frederick Douglass School 19 (math 9% / reading 13%, grade F, #909 of 994 statewide, top 92%, 444 students, 81% FRL); H L Harshman Middle School (math 3% / reading 16%, grade F, #316 of 330 statewide, top 96%, 549 students, 84% FRL); Arsenal Technical High School (math 6% / reading 27%, grade F, #353 of 369 statewide, top 96%, 2,366 students, 74% FRL) — zoned schools at 80% FRL track the district average.
- Market conditions: Rents rising (+2.9%/yr); 501 active listings in the ZIP; 31 comparable units currently listed for rent nearby; rentals at typical pace (median 20d on market — plan ~3-4 weeks tenant-placement turnaround); 1,906 units permitted in Marion County in 2024 (621 in 5+ unit buildings).
- At $2,252/mo this rent would consume 47% of the median local household income ($57k/yr) (locally 1499% of renters already pay >50% of income on rent) — very limited rent-growth headroom before tenants either downsize or default.
Forward outlook
- Local home prices are declining (-3.0%/yr); year-one equity from $1k of loan paydown is wiped out by about $6k of value loss. Plan a longer hold.
- Marion County population projected at +18% by 2050 — long-run rental-demand tailwind backs the buy-and-hold thesis.
Negotiation context
- It's been on market 280 days — a 12% lower offer ($167k) is reasonable based on typical stale-listing flexibility.
- 5 sale attempts since 4y ago; this cycle's ask has dropped $90k (32%) from the opening price — seller is motivated, your offer sets the floor, not the list.
- Current owner paid $125k; list at $190k implies a 52% gain — meaningful room to come down on a strong offer.
Risks & watch-outs
- Watch-outs: built in 1925 — expect roof / HVAC / electrical / plumbing capex.
Questions for the listing agent
- It's been on market 280 days. Have you received any prior offers? Is the seller open to a 12% concession, seller financing, or rate buy-down credit?
- Built in 1925 — when were the roof, HVAC, electrical panel, plumbing, and water heater last replaced?
- Why hasn't it sold? Are there any deal-killer items the seller is aware of (foundation, flood, title, zoning, code violations)?
- Is there a deadline driving the sale (1031 exchange, divorce, estate, relocation)? That informs how much negotiation room exists.
- What's the average days-on-market for RENTAL listings here right now (not sales)? A rising rental-DOM trend means longer vacancies and softer asking-rent achievability than the comps imply.
- What's the recent tenant-quality profile in this submarket — average credit score on applications, eviction rate, late-payment / NSF rate, and stable-employment percentage? A property-management company in the area should have these aggregated.
- How much new for-sale + rental construction is in the pipeline within 1–3 miles? Heavy new supply typically softens prices + rents 12–24 months out; constrained supply supports both.
Investment metrics
- 1% rule
- 1.19% ✓
- Cap rate
- 8.71%
- Cash-on-cash
- 8.65%
- DSCR
- 1.38
- GRM
- 7.0
CMA / ARV
- ARV (median comp)
- $359,621
- List price
- $189,900
- Delta
- -47.19%
- Verdict
- UNDERPRICED
- Comps
- 20 within 1.0 mi
Show comp detail 12 sales within ~0.75 mi
| Address | Dist | Beds/Ba | Sqft | Sold | Price | $/sf | Match |
|---|---|---|---|---|---|---|---|
| 836 Villa Ave | 0.33mi | 3/2.5 (-1) | 2,744 (-2%) | 4mo | $339,000 | $124 | 71 |
| 1329 Spruce St | 0.49mi | 3/2.0 (-1) | 2,808 (+0%) | 1mo | $295,000 | $105 | 71 |
| 1420 Woodlawn Ave | 0.59mi | 4/2.5 | 2,841 (+2%) | 0mo | $459,900 | $162 | 68 |
| 1038 Dawson St | 0.31mi | 3/3.5 (-1) | 3,030 (+8%) | 1mo | $390,000 | $129 | 60 |
| 1627 Pleasant St | 0.44mi | 3/3.0 (-1) | 2,636 (-6%) | 1mo | $381,000 | $145 | 60 |
| 1230 Evison St | 0.42mi | 4/2.0 | 2,445 (-13%) | 5mo | $360,000 | $147 | 55 |
| 1407 Woodlawn Ave | 0.60mi | 3/2.5 (-1) | 2,914 (+4%) | 5mo | $479,500 | $165 | 54 |
| 1903 Hoyt Ave | 0.45mi | 3/1.5 (-1) | 2,504 (-11%) | 3mo | $170,000 | $68 | 52 |
| 1419 Lexington Ave | 0.66mi | 3/2.0 (-1) | 2,614 (-7%) | 5mo | $354,000 | $135 | 49 |
| 1652 Spann Ave | 0.65mi | 3/2.5 (-1) | 2,454 (-12%) | 1mo | $222,330 | $91 | 41 |
| 325 Harlan St | 0.74mi | 3/1.0 (-1) | 3,072 (+10%) | 3mo | $95,000 | $31 | 38 |
| 1718 Thaddeus St | 0.70mi | 3/2.0 (-1) | 2,428 (-13%) | 4mo | $179,000 | $74 | 37 |
Match score weights: distance 35% · size 25% · config 20% · recency 20%. Top-matched comps best support the ARV.
Projected returns pro-forma
-3.0% appreciation · 2.88% rent growth · sell at horizon
- IRR
- -3.3%
- Equity multiple
- 0.88×
- Total profit
- $-6,552
- Equity at exit
- $28,315
- IRR
- 6.3%
- Equity multiple
- 1.47×
- Total profit
- $24,955
- Equity at exit
- $16,419
Cash invested: $53,172 (down + closing). Projections, not guarantees.
Landlord ↔ Tenant lean methodology
- Overall (STATE)
- 90 Strongly Landlord-Friendly
- State Indiana
- 90 Strongly Landlord-Friendly · R+11
- County
- — inherits STATE
- City
- — inherits STATE
ZIP-level market 46203
- Home prices YoY
- -26.7%
- Rents YoY
- 2.9%
- Active inventory
- 501
- Price-to-rent
- 7.0×
Monthly cashflow live
- Estimated rent
- $2,252 high interval (Pro) →
- Mortgage (P&I)
- −$996
- Tax from tax record
- −$321 /mo · $3,848/yr
- Insurance
- −$79
- HOA
- −$0
- Lot rent
- −$0
- Vacancy / Maint / Mgmt
- −$473
- Net cashflow
- $383
Break-even live
Sensitivity live
| Price | -10% $491 | -5% $437 | +0% $383 | +5% $329 | +10% $276 |
|---|---|---|---|---|---|
| Rent | -10% $205 | -5% $294 | +0% $383 | +5% $472 | +10% $561 |
| Rate | -1.0pp $479 | -0.5pp $431 | base $383 | +0.5pp $334 | +1.0pp $284 |
UW: 25.0% down · 7.5% · 30yr · 1.5% tax · 5.0% vac · 8.0% maint · 8.0% mgmt
Financing live
Cash to close
- Down payment
- $47,475
- Closing costs
- $5,697
- Reserves months
- —
- Total cash needed
- —
Loan-product check · same deal, 3 products live
Conventional
25% down · 7.5% · 30yr
- Down + closing
- —
- Monthly P&I
- —
- Monthly cashflow
- —
- DSCR
- —
- Eligible?
- —
Personal DTI + credit; lowest rate.
DSCR
20% down · 8.5% · 30yr
- Down + closing
- —
- Monthly P&I
- —
- Monthly cashflow
- —
- DSCR
- —
- Eligible?
- —
No personal income docs; deal must DSCR.
Hard money
10% down · 12.0% · 12mo
- Down + closing
- —
- Monthly P&I
- —
- Monthly cashflow
- —
- DSCR
- —
- Eligible?
- —
Short-term bridge; refi at stabilization.
Rent comps 31 comps
| Address | Beds | Baths | Sqft | Rent | $/sqft | DOM | Units | Dist |
|---|---|---|---|---|---|---|---|---|
| 1153 Villa Ave Indianapolis, IN | 4.0 | 2.0 | 2880 | $2,100 | $0.73 | 26d | 1 | 0.07mi |
| 1230 Harlan St Indianapolis, IN | 3.0 | 3.5 | 2167 | $2,600 | $1.20 | 4d | 1 | 0.07mi |
| 2201 Pleasant St Indianapolis, IN | 4.0 | 3.0 | 2063 | $2,495 | $1.21 | 7d | 1 | 0.28mi |
| 1619 S Randolph St Indianapolis, IN | 3.0 | 1.0 | 2016 | $1,195 | $0.59 | 26d | 1 | 0.37mi |
| 1548 Lexington Ave Indianapolis, IN | 4.0 | 3.0 | 2224 | $2,250 | $1.01 | 5d | 1 | 0.54mi |
| 1643 Fletcher Ave Indianapolis, IN | 3.0 | 2.0 | 2019 | $2,249 | $1.11 | 26d | 1 | 0.57mi |
| 1741 S State Ave Indianapolis, IN | 4.0 | 2.0 | 2104 | $2,200 | $1.05 | 0d | 1 | 0.57mi |
| 1641 Iowa St Indianapolis, IN | 3.0 | 3.0 | 1938 | $1,900 | $0.98 | 26d | 1 | 0.58mi |
| 1409 Linden St Unit 1028898P Indianapolis, IN | 5.0 | 6.0 | 2895 | $14,651 | $5.06 | 26d | 1 | 0.62mi |
| 1205 Cottage Ave Unit 1372938P Indianapolis, IN | 4.0 | 3.5 | 2680 | $6,638 | $2.48 | 46d | 1 | 0.75mi |
| 1337 Barth Ave Indianapolis, IN | 3.0 | 1.0 | 2468 | $1,700 | $0.69 | 10d | 1 | 0.85mi |
| 1337 Barth Ave Indianapolis, IN | 3.0 | 1.0 | 2468 | $1,700 | $0.69 | 18d | 1 | 0.85mi |
| 1337 Barth Ave Indianapolis, IN | 3.0 | 1.0 | 2468 | $1,700 | $0.69 | 13d | 1 | 0.85mi |
| 1337 Barth Ave Unit NA Indianapolis, IN | 3.0 | 1.0 | 2468 | $1,700 | $0.69 | 7d | 1 | 0.85mi |
| 1301 Ringgold Ave Unit 1303750P Indianapolis, IN | 3.0 | 3.0 | 2884 | $6,514 | $2.26 | 46d | 1 | 0.89mi |
| 1027 Hosbrook St Indianapolis, IN | 4.0 | 3.5 | 3612 | $4,750 | $1.32 | 20d | 1 | 0.91mi |
| 1528 E Tabor St Indianapolis, IN | 3.0 | 1.5 | 2200 | $1,550 | $0.70 | 17d | 1 | 1.07mi |
| 117 S Arsenal Ave Indianapolis, IN | 3.0 | 2.0 | 2592 | $1,800 | $0.69 | 46d | 1 | 1.08mi |
| 734 Parkway Ave Indianapolis, IN | 3.0 | 2.0 | 2110 | $2,299 | $1.09 | 26d | 1 | 1.14mi |
| 743 Cottage Ave Indianapolis, IN | 5.0 | 2.0 | 2233 | $1,995 | $0.89 | 46d | 1 | 1.15mi |
| 29 N Walcott St Indianapolis, IN | 4.0 | 3.0 | 2200 | $2,400 | $1.09 | 46d | 1 | 1.23mi |
| 1835 Applegate St Indianapolis, IN | 4.0 | 3.0 | 2024 | $2,300 | $1.14 | 46d | 1 | 1.23mi |
| 210 N Keystone Ave Indianapolis, IN | 4.0 | 2.0 | 2024 | $2,200 | $1.09 | 10d | 1 | 1.33mi |
| 1430 E Ohio St Indianapolis, IN | 3.0 | 1.5 | 2174 | $1,745 | $0.80 | 46d | 1 | 1.39mi |
| 406 Parkway Ave Indianapolis, IN | 4.0 | 2.5 | 2481 | $2,250 | $0.91 | 26d | 1 | 1.39mi |
| 49 S Lasalle St Unit 1540092P Indianapolis, IN | 3.0 | 2.0 | 1991 | $3,053 | $1.53 | 5d | 1 | 1.41mi |
| 350 Terrace Ave Indianapolis, IN | 4.0 | 2.5 | 2552 | $3,000 | $1.18 | 26d | 1 | 1.43mi |
| 350 Terrace Ave Indianapolis, IN | 4.0 | 2.5 | 2552 | $3,000 | $1.18 | 6d | 1 | 1.43mi |
| 350 E Minnesota St Unit 1 Indianapolis, IN | 4.0 | 2.5 | 2500 | $3,000 | $1.20 | 1d | 1 | 1.43mi |
| 322 N Summit St Unit 4 Indianapolis, IN | 3.0 | 3.5 | 2546 | $3,100 | $1.22 | 10d | 1 | 1.44mi |
| 1399 Hoefgen St Indianapolis, IN | 5.0 | 3.0 | 2122 | $2,100 | $0.99 | 0d | 1 | 1.44mi |
Listing history 39 events
-
2026-06-22days on market $189,900 Active 280 DOM
-
2026-06-21days on market $189,900 Active 279 DOM
-
2026-06-18days on market $189,900 Active 276 DOM
-
2026-06-17days on market $189,900 Active 275 DOM
-
2026-06-16days on market $189,900 Active 274 DOM
-
2026-06-15days on market $189,900 Active 273 DOM
-
2026-06-13days on market $189,900 Active 271 DOM
-
2026-06-13days on market $189,900 Active 270 DOM
-
2026-06-09days on market $189,900 Active 267 DOM
-
2026-06-08days on market $189,900 Active 266 DOM
-
2026-06-07days on market $189,900 Active 265 DOM
-
2026-06-03pricedays on market $189,900 Active 261 DOM
-
2026-06-02days on market $199,900 Active 260 DOM
-
2026-06-01days on market $199,900 Active 259 DOM
-
2026-05-31days on market $199,900 Active 258 DOM
-
2026-05-04price $199,900 464-char remark
Show marketing remark (464 chars)
This property offers the perfect opportunity for a savvy buyer looking to renovate and add value, or an investor looking to fix-and-flip, add to a rental portfolio, or a long-term hold property. This property features solid bones and a layout with great potential, this home is ready for your vision and updates. Located in a growing area of Indianapolis with nearby amenities. Don't miss your chance to bring this property back to life and maximize its potential!
-
2026-04-08price $209,900 464-char remark
Show marketing remark (464 chars)
This property offers the perfect opportunity for a savvy buyer looking to renovate and add value, or an investor looking to fix-and-flip, add to a rental portfolio, or a long-term hold property. This property features solid bones and a layout with great potential, this home is ready for your vision and updates. Located in a growing area of Indianapolis with nearby amenities. Don't miss your chance to bring this property back to life and maximize its potential!
-
2026-03-11status Active 464-char remark
Show marketing remark (464 chars)
This property offers the perfect opportunity for a savvy buyer looking to renovate and add value, or an investor looking to fix-and-flip, add to a rental portfolio, or a long-term hold property. This property features solid bones and a layout with great potential, this home is ready for your vision and updates. Located in a growing area of Indianapolis with nearby amenities. Don't miss your chance to bring this property back to life and maximize its potential!
-
2026-03-04historical 464-char remark
Show marketing remark (464 chars)
This property offers the perfect opportunity for a savvy buyer looking to renovate and add value, or an investor looking to fix-and-flip, add to a rental portfolio, or a long-term hold property. This property features solid bones and a layout with great potential, this home is ready for your vision and updates. Located in a growing area of Indianapolis with nearby amenities. Don't miss your chance to bring this property back to life and maximize its potential!
-
2026-03-02price $219,900 464-char remark
Show marketing remark (464 chars)
This property offers the perfect opportunity for a savvy buyer looking to renovate and add value, or an investor looking to fix-and-flip, add to a rental portfolio, or a long-term hold property. This property features solid bones and a layout with great potential, this home is ready for your vision and updates. Located in a growing area of Indianapolis with nearby amenities. Don't miss your chance to bring this property back to life and maximize its potential!
-
2026-02-02price $229,900 464-char remark
Show marketing remark (464 chars)
This property offers the perfect opportunity for a savvy buyer looking to renovate and add value, or an investor looking to fix-and-flip, add to a rental portfolio, or a long-term hold property. This property features solid bones and a layout with great potential, this home is ready for your vision and updates. Located in a growing area of Indianapolis with nearby amenities. Don't miss your chance to bring this property back to life and maximize its potential!
-
2026-01-05price $239,900 464-char remark
Show marketing remark (464 chars)
This property offers the perfect opportunity for a savvy buyer looking to renovate and add value, or an investor looking to fix-and-flip, add to a rental portfolio, or a long-term hold property. This property features solid bones and a layout with great potential, this home is ready for your vision and updates. Located in a growing area of Indianapolis with nearby amenities. Don't miss your chance to bring this property back to life and maximize its potential!
-
2025-12-10price $249,900 464-char remark
Show marketing remark (464 chars)
This property offers the perfect opportunity for a savvy buyer looking to renovate and add value, or an investor looking to fix-and-flip, add to a rental portfolio, or a long-term hold property. This property features solid bones and a layout with great potential, this home is ready for your vision and updates. Located in a growing area of Indianapolis with nearby amenities. Don't miss your chance to bring this property back to life and maximize its potential!
-
2025-11-06price $259,900 464-char remark
Show marketing remark (464 chars)
This property offers the perfect opportunity for a savvy buyer looking to renovate and add value, or an investor looking to fix-and-flip, add to a rental portfolio, or a long-term hold property. This property features solid bones and a layout with great potential, this home is ready for your vision and updates. Located in a growing area of Indianapolis with nearby amenities. Don't miss your chance to bring this property back to life and maximize its potential!
-
2025-10-06price $269,900 464-char remark
Show marketing remark (464 chars)
This property offers the perfect opportunity for a savvy buyer looking to renovate and add value, or an investor looking to fix-and-flip, add to a rental portfolio, or a long-term hold property. This property features solid bones and a layout with great potential, this home is ready for your vision and updates. Located in a growing area of Indianapolis with nearby amenities. Don't miss your chance to bring this property back to life and maximize its potential!
-
2025-09-04$279,900 Active 464-char remark
Show marketing remark (464 chars)
This property offers the perfect opportunity for a savvy buyer looking to renovate and add value, or an investor looking to fix-and-flip, add to a rental portfolio, or a long-term hold property. This property features solid bones and a layout with great potential, this home is ready for your vision and updates. Located in a growing area of Indianapolis with nearby amenities. Don't miss your chance to bring this property back to life and maximize its potential!
-
2024-08-13status Pending
-
2024-08-12historical
-
2024-04-29price $315,000
-
2024-04-17$340,000 Active
-
2023-03-15soldstatus $125,000 Closed
-
2023-02-17status Pending
-
2023-02-14price $149,990
-
2023-02-13status Active
-
2023-02-12status Pending
-
2023-01-18price $154,990
-
2022-12-02price $159,900
-
2022-11-28price $164,900
-
2022-10-11$169,900 Active
ⓘ Source: listings_history table (triggers on properties + properties_extension) + one-shot
backfill from property_details.listing_events for pre-trigger history.
Tax reassessment forecast IN · Partial reset (capped growth)
- Current annual tax
- $3,848 · $321/mo
- Projected year-2 tax
- $3,848 · $321/mo
- Expected delta
- $0/yr ($0/mo · 0.0%)
ⓘ Screening estimate from a state-policy table — verify with the county assessor before closing.
Climate risk First Street
- Flood 1/10 Low FEMA zone X (unshaded) · 0% chance over 30 yrs
- Wildfire 1/10 Low
- Heat 4/10 Moderate 7 d/yr ≥101°F today · 19 d/yr by 30 yrs out
- Wind 2/10 Low 0% chance of damaging wind over 30 yrs
- Air quality 4/10 Moderate 5 unhealthy d/yr today · 7 by 30 yrs out
Nearby sold comps map
Loading sold comps map…
Walkable amenities ~0.75 mi
Loading nearby amenities…
Taxation est. · year 1
- Rental income
- $27,020
- − Mortgage interest
- −$10,637
- − Property taxes
- −$3,848
- − Insurance
- −$950
- − Repairs & maintenance
- −$2,162
- − Management
- −$2,162
- − Depreciation
- −$5,524
- Taxable income
- $1,738
- Est. tax owed @ 24.0%
- −$417
- After-tax cash flow
- $4,181/yr
For passive investors: Depreciation is non-cash, so a rental often shows a tax loss while cash-flowing — sheltering income. Rental losses are passive: they offset passive income freely, and up to $25,000/yr can offset ordinary (W-2) income if you actively participate and your MAGI is under $100k (phasing out to $0 by $150k); unused losses carry forward. On sale, claimed depreciation is recaptured at up to 25%, and gains may owe capital-gains tax (a 1031 exchange can defer both). Figures are a year-1 estimate at your 24.0% rate — not tax advice; consult a CPA.
Schools (NCES district)
- District
- Indianapolis Public Schools
- NCES district ID
- 1804770
- Math proficiency
- 14% ▼ -7.00%
- Reading proficiency
- 20% ▼ -3.00%
- Median HH income
- $32,034
- Composite
- 13.69/100
- National rank
- #9499
- State rank
- #286 of 301 in IN
Livability — Indianapolis city (balance)
No livability data for this city. (Only ~50 U.S. cities are tracked.)
Census & demographics
- Census place
- Indianapolis city (balance), IN
- County
- Marion County · 998,460 people
- City population
- 881,119
- Metro
- Indianapolis-Carmel-Anderson, IN
- Population (ZIP)
- 37,758
- Household income
- $57,393
- Rent vs Own
- Severe rent burden
- 1499.0
Population outlook (Marion County) Hauer SSP2
- Today (2025)
- 1,025,572 people
- By 2030
- 1,065,727 · +3.9%
- By 2040
- 1,141,577 · +11.3%
- By 2050
- 1,208,920 · +17.9%
- By 2075
- 1,367,288 · +33.3%
- By 2100
- 1,438,201 · +40.2%
Race, ethnicity, and origin ACS 2023
- Neighborhood character
- Predominantly White (69%)
- Race & ethnicity
- White 69% Hispanic / Latino 14% Black 12% Two or more races 8% Asian 2% Native American 1%
- Hispanic origin (detail)
- Mexican 12% Puerto Rican 1%
- Common ancestry
- Slovak 2% Lithuanian 2% Italian 1%
- Foreign-born
- 8% · Canada
- Languages at home
- 88% English-only · Spanish 10% Other Indo-European 1%
Political lean MEDSL · Marion
- 2024 margin
- Strong D (+27.7) · D 63.0% · R 35.3% · Other 1.7%
- 2008→2024 swing
- -0.7pp no change · 2008: 28.4pp · 2024: 27.7pp
- All cycles
- 2024: D+27.7 2020: D+29.1 2016: D+22.8 2012: D+22.2 2008: D+28.4
Not yet ingested
- Civics
- —
Market trends
- HPI YoY
- ▼ -127.37%
- Current HPI
- 349.579
- Rent YoY
- ▲ 2.88%
- Metro
- Indianapolis-Carmel-Anderson, IN
- State GDP YoY
- ▲ 2.90%
- F500 in state
- 18
Industry mix (Fortune 500 HQ in IN)
| Industry | F500 HQs | Revenue |
|---|---|---|
| Industrial Machinery | 2 | $37B |
|
||
| Healthcare | 1 | $177B |
|
||
| Pharmaceuticals | 1 | $45B |
|
||
| Metals / Steel | 1 | $18B |
|
||
| Agriculture | 1 | $17B |
|
||
| Packaging | 1 | $12B |
|
||
Price history
+17.7% since first listed24 events — show timeline
- 2026-05-04 Price Changed $199,900 MIBOR as Distributed by MLS Grid
- 2026-04-08 Price Changed $209,900 MIBOR as Distributed by MLS Grid
- 2026-03-11 Relisted — MIBOR as Distributed by MLS Grid
- 2026-03-04 Listing Removed — MIBOR as Distributed by MLS Grid
- 2026-03-02 Price Changed $219,900 MIBOR as Distributed by MLS Grid
- 2026-02-02 Price Changed $229,900 MIBOR as Distributed by MLS Grid
- 2026-01-05 Price Changed $239,900 MIBOR as Distributed by MLS Grid
- 2025-12-10 Price Changed $249,900 MIBOR as Distributed by MLS Grid
- 2025-11-06 Price Changed $259,900 MIBOR as Distributed by MLS Grid
- 2025-10-06 Price Changed $269,900 MIBOR as Distributed by MLS Grid
- 2025-09-04 Listed $279,900 MIBOR as Distributed by MLS Grid
- 2024-08-13 Pending — MIBOR as Distributed by MLS Grid
- 2024-08-12 Listing Removed — MIBOR as Distributed by MLS Grid
- 2024-04-29 Price Changed $315,000 MIBOR as Distributed by MLS Grid
- 2024-04-17 Listed $340,000 MIBOR as Distributed by MLS Grid
- 2023-03-15 Sold (MLS) $125,000 MIBOR as Distributed by MLS Grid
- 2023-02-17 Pending — MIBOR as Distributed by MLS Grid
- 2023-02-14 Price Changed $149,990 MIBOR as Distributed by MLS Grid
- 2023-02-13 Relisted — MIBOR as Distributed by MLS Grid
- 2023-02-12 Pending — MIBOR as Distributed by MLS Grid
- 2023-01-18 Price Changed $154,990 MIBOR as Distributed by MLS Grid
- 2022-12-02 Price Changed $159,900 MIBOR as Distributed by MLS Grid
- 2022-11-28 Price Changed $164,900 MIBOR as Distributed by MLS Grid
- 2022-10-11 Listed $169,900 MIBOR as Distributed by MLS Grid
Property tax history
+26.9%/yrLatest (2025): $3,848 · +22.3% YoY. Source: county tax records.
Cash-flow waterfall
monthlySold comps — $/sqft
last 12 mo · ≤1 miLoading sold comps…