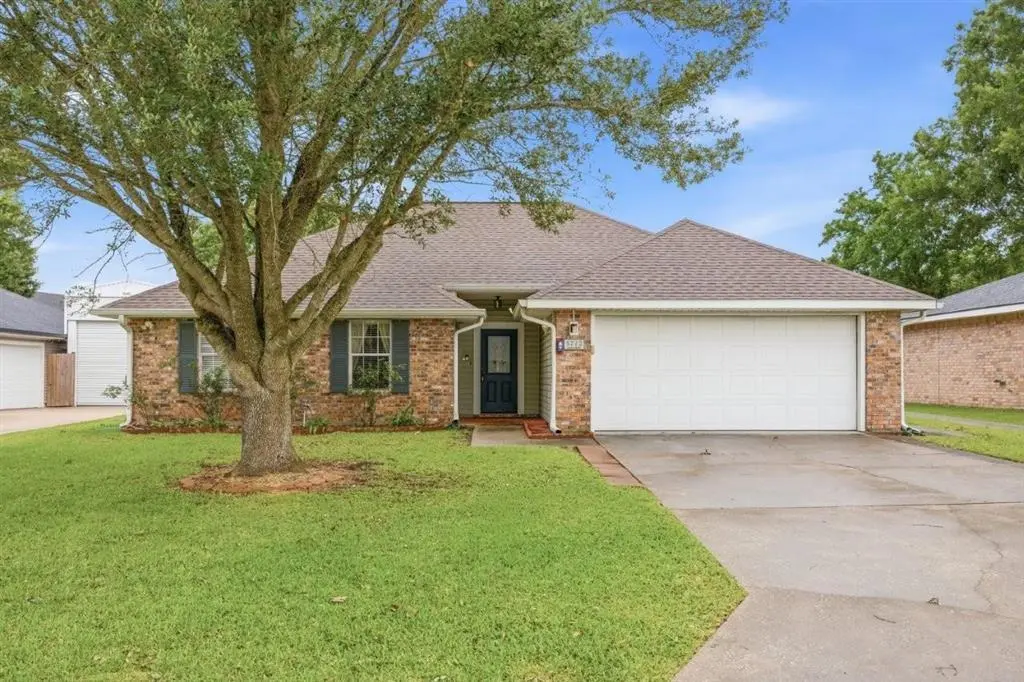
5712 Stonehaven Ln · Prien, LA
Flood risk 4/10 · Minor
- FEMA flood zone
- X (unshaded)
- Chance of flooding over 30 yrs
- 0.22%
- Est. flood insurance / yr
- $507 – $1,088
Fire risk 2/10 · Minimal
- Est. fire insurance / yr
- $1,269 – $2,357
Heat risk 9/10 · Severe
- Hot days now (above 109°F)
- 7 days/yr
- Hot days in 30 yrs
- 22 days/yr
Wind risk 9/10 · Severe
- Chance of severe wind over 30 yrs
- 99.0%
Air-quality risk 2/10 · Minimal
- Unhealthy air days now
- 1 days/yr
- Unhealthy air days in 30 yrs
- 1 days/yr
Risk factors via First Street. Map © Google.
Why this score? — see what drove the B- grade
The composite is a weighted blend of 9 inputs, each scored 0–100. Each bar is that input's sub-score; the figure is the points it added to the 100-point composite (weight × sub-score).
- Cash flow +29.0/30.0
- DSCR +10.0/10.0
- 1% rule +6.9/10.0
- ARV discount +6.6/15.0
- Rent growth +5.0/5.0
- Livability +3.2/5.0
- Schools +3.1/10.0
- Condition / age +2.5/5.0
- Appreciation +0.0/10.0
$210,000
🖨 Deal sheet 📄 Offer letter ✓ Due diligence
Listing remarks
Nice 3-bedroom, 2-bath brick home located in South Lake Charles! This adorable and cozy home features a warm wood-burning fireplace and offers the perfect space for a first-time buyer or growing family. The spacious master suite includes a large soaking tub and separate shower. Step outside to find an air-conditioned shop in the backyard, along with an additional storage shed for all your tools and hobbies. Conveniently located near shopping, dining, schools, and everything Lake Charles has to offer! All measurements are more or less.
Key facts
- Master suite
- Air conditioned shop
- Soaking tub
Tags
Property features AI
Exterior
- Utilities: Public water; Public sewer; Electricity available; Water available; Sewer available
- Home design: Single-story house; Single family residence; Residential property
- Exterior features: Back yard; City lot; Lot dimensions approximately 70 x 115 (0.18 acres)
Interior
- Bathrooms: 2 full bathrooms
- Interior features: Wood-burning fireplace; Central heating; Central air conditioning
Neighborhood map
What this means for you Summary
Snapshot
- This is a 3-bed/2.0-bath single-family listed at $210k.
Deal economics
- At list price, monthly cash flow is $718 ($9k/yr) — positive.
- The deal already cash-flows at list — no discount required.
- Meets the 1% rule at list price ($3k rent vs $210k).
- Recommended offer: $207k (1.5% below list) — sets the bar for market timing.
- Cap rate 10.4% vs local median 4.7% in Prien — top-decile yield for the area; either an underpriced asset or a hidden risk that comps aren't pricing in. Stress-test before assuming the spread holds.
Location & tenants
- Location reads 64/100 on livability (#174 in LA) — a middle-class / working-renter tenant base. Strengths: employment A+, housing A+, crime A; Watch: schools F, amenities F, commute F.
- Calcasieu Parish (other): math 30% / reading 44% proficiency, ranked #29 of 98 in LA (top 30%) — families likely to look elsewhere, expect single-tenant / working-renter base with shorter leases.
- Market conditions: Rents rising fast (+15.1%/yr); 456 active listings in the ZIP; 3 comparable units currently listed for rent nearby; rentals lingering (median 44d on market — plan ~5-8 weeks vacancy on turnover, expect pricing pressure); 67% of comp listings sitting > 30 days — soft ceiling on asking rent; solid renter incomes; 1,298 units permitted in Calcasieu Parish in 2024 (526 in 5+ unit buildings).
- This rent runs 35% of the median local income ($86k/yr) — at the standard rent-burdened threshold; future hikes will face affordability resistance.
Forward outlook
- Local home prices are declining (-3.0%/yr); year-one equity from $1k of loan paydown is wiped out by about $6k of value loss. Plan a longer hold.
- Calcasieu County population projected at +11% by 2050 — modest demand growth; plan on rents tracking national, not racing it.
- At projected returns (-3.0% appreciation + 8.0% rent growth), your $59k cash investment doubles in ~7 years — after that, you're playing with house money.
Negotiation context
- It's been on market 23 days — a 2% lower offer ($207k) is reasonable based on typical stale-listing flexibility.
- Current owner paid $116k; list at $210k implies a 81% gain — meaningful room to come down on a strong offer.
Risks & watch-outs
- Climate carrying-cost: severe wind risk, 99% chance of damaging wind over 30y; extreme-heat days projected 7→22/yr by 2055 (HVAC capex compounding) — expect insurance premiums to compound above CPI over the hold.
Questions for the listing agent
- Is there a deadline driving the sale (1031 exchange, divorce, estate, relocation)? That informs how much negotiation room exists.
- Schools are F-rated, which usually means shorter tenancies and higher turnover. Who's the typical renter profile here, and what's been the actual vacancy rate?
- What's the average days-on-market for RENTAL listings here right now (not sales)? A rising rental-DOM trend means longer vacancies and softer asking-rent achievability than the comps imply.
- What's the recent tenant-quality profile in this submarket — average credit score on applications, eviction rate, late-payment / NSF rate, and stable-employment percentage? A property-management company in the area should have these aggregated.
- How much new for-sale + rental construction is in the pipeline within 1–3 miles? Heavy new supply typically softens prices + rents 12–24 months out; constrained supply supports both.
Investment metrics
- 1% rule
- 1.19% ✓
- Cap rate
- 10.40%
- Cash-on-cash
- 14.66%
- DSCR
- 1.65
- GRM
- 7.0
CMA / ARV
- ARV (on-the-fly)
- $205,740
- Comps found
- 11
Show comp detail 11 sales within ~0.75 mi
| Address | Dist | Beds/Ba | Sqft | Sold | Price | $/sf | Match |
|---|---|---|---|---|---|---|---|
| 5704 Stonehaven Ln | 0.05mi | 3/2.0 | 1,504 (-1%) | 15mo | $205,000 | $136 | 83 |
| 1094 Spanish Mission Trl | 0.26mi | 3/2.0 | 1,524 (0%) | 9mo | $200,000 | $131 | 81 |
| 906 Aberdeen Dr | 0.10mi | 3/2.0 | 1,600 (+5%) | 9mo | $214,000 | $134 | 80 |
| 1011 Aberdeen Dr | 0.17mi | 3/2.0 | 1,390 (-9%) | 2mo | $191,500 | $138 | 75 |
| 5710 Stonehaven Ln | 0.01mi | 3/2.0 | 1,624 (+7%) | 20mo | $220,000 | $135 | 72 |
| 5705 Adair Dr | 0.12mi | 3/2.0 | 1,324 (-13%) | 8mo | $197,000 | $149 | 66 |
| 5797 Berwick Ln | 0.09mi | 3/2.0 | 1,381 (-9%) | 20mo | $185,000 | $134 | 64 |
| 1111 Aberdeen Dr | 0.27mi | 3/2.0 | 1,362 (-11%) | 8mo | $189,900 | $139 | 63 |
| 1077 Spanish Mission Trl | 0.23mi | 3/2.0 | 1,750 (+15%) | 13mo | $210,000 | $120 | 54 |
| 404 Arabie Rd Rd | 0.66mi | 3/2.5 | 1,390 (-9%) | 2mo | $167,500 | $121 | 51 |
| 5712 W Dietrich Loop W | 0.63mi | 2/2.0 (-1) | 1,639 (+8%) | 20mo | $235,000 | $143 | 36 |
Match score weights: distance 35% · size 25% · config 20% · recency 20%. Top-matched comps best support the ARV.
Projected returns pro-forma
-3.0% appreciation · 8.0% rent growth · sell at horizon
- IRR
- 10.2%
- Equity multiple
- 1.42×
- Total profit
- $24,877
- Equity at exit
- $31,312
- IRR
- 22.8%
- Equity multiple
- 3.39×
- Total profit
- $140,455
- Equity at exit
- $18,157
Cash invested: $58,800 (down + closing). Projections, not guarantees.
Landlord ↔ Tenant lean methodology
- Overall (STATE)
- 90 Strongly Landlord-Friendly
- State Louisiana
- 90 Strongly Landlord-Friendly · R+12
- County
- — inherits STATE
- City
- — inherits STATE
ZIP-level market 70605
- Rents YoY
- 15.1%
- Active inventory
- 456
- Price-to-rent
- 7.0×
Monthly cashflow live
- Estimated rent
- $2,503 medium interval (Pro) →
- Mortgage (P&I)
- −$1,101
- Tax from tax record
- −$70 /mo · $838/yr
- Insurance
- −$88
- HOA
- −$0
- Vacancy / Maint / Mgmt
- −$526
- Net cashflow
- $718
Break-even live
UW: 25.0% down · 7.5% · 30yr · 1.5% tax · 5.0% vac · 8.0% maint · 8.0% mgmt
Financing live
Cash to close
- Down payment
- $52,500
- Closing costs
- $6,300
- Reserves months
- —
- Total cash needed
- —
Loan-product check · same deal, 3 products live
Conventional
25% down · 7.5% · 30yr
- Down + closing
- —
- Monthly P&I
- —
- Monthly cashflow
- —
- DSCR
- —
- Eligible?
- —
Personal DTI + credit; lowest rate.
DSCR
20% down · 8.5% · 30yr
- Down + closing
- —
- Monthly P&I
- —
- Monthly cashflow
- —
- DSCR
- —
- Eligible?
- —
No personal income docs; deal must DSCR.
Hard money
10% down · 12.0% · 12mo
- Down + closing
- —
- Monthly P&I
- —
- Monthly cashflow
- —
- DSCR
- —
- Eligible?
- —
Short-term bridge; refi at stabilization.
Rent comps 3 comps
| Address | Beds | Baths | Sqft | Rent | $/sqft | DOM | Units | Dist |
|---|---|---|---|---|---|---|---|---|
| 716 Dianne Ln Lake Charles, LA | 3.0 | 2.0 | 2200 | $5,000 | $2.27 | 43d | 1 | 0.65mi |
| 155 Heather St Lake Charles, LA | 3.0 | 2.0 | 1316 | $1,650 | $1.25 | 13d | 1 | 0.88mi |
| 801 Sundale Dr Lake Charles, LA | 3.0 | 1.0 | 1144 | $1,195 | $1.04 | 43d | 1 | 1.18mi |
Listing history 18 events
-
2026-06-18status $210,000 Pending 23 DOM
-
2026-06-18days on market $210,000 Active 23 DOM
-
2026-06-17days on market $210,000 Active 22 DOM
-
2026-06-16days on market $210,000 Active 21 DOM
-
2026-06-15days on market $210,000 Active 20 DOM
-
2026-06-14days on market $210,000 Active 18 DOM
-
2026-06-13days on market $210,000 Active 17 DOM
-
2026-06-10days on market $210,000 Active 15 DOM
-
2026-06-09days on market $210,000 Active 14 DOM
-
2026-06-08days on market $210,000 Active 13 DOM
-
2026-06-07days on market $210,000 Active 12 DOM
-
2026-06-05days on market $210,000 Active 9 DOM
-
2026-06-02days on market $210,000 Active 7 DOM
-
2026-06-01days on market $210,000 Active 6 DOM
-
2026-05-31days on market $210,000 Active 5 DOM
-
2026-05-30days on market $210,000 Active 4 DOM
-
2026-05-26$210,000 Active
-
2005-03-23soldstatus $116,000
ⓘ Source: listings_history table (triggers on properties + properties_extension) + one-shot
backfill from property_details.listing_events for pre-trigger history.
Tax reassessment forecast LA · Resets to sale price
- Current annual tax
- $838 · $70/mo
- Projected year-2 tax
- $1,155 · $96/mo
- Expected delta
- +$318/yr (+$26/mo · 37.9%)
ⓘ Screening estimate from a state-policy table — verify with the county assessor before closing.
Climate risk First Street
- Flood 4/10 Moderate FEMA zone X (unshaded) · 22% chance over 30 yrs
- Wildfire 2/10 Low
- Heat 9/10 Extreme 7 d/yr ≥109°F today · 22 d/yr by 30 yrs out
- Wind 9/10 Extreme 99% chance of damaging wind over 30 yrs
- Air quality 2/10 Low 1 unhealthy d/yr today · 1 by 30 yrs out
Nearby sold comps map
Loading sold comps map…
Walkable amenities ~0.75 mi
Loading nearby amenities…
Taxation est. · year 1
- Rental income
- $30,031
- − Mortgage interest
- −$11,763
- − Property taxes
- −$838
- − Insurance
- −$1,050
- − Repairs & maintenance
- −$2,402
- − Management
- −$2,402
- − Depreciation
- −$6,109
- Taxable income
- $5,466
- Est. tax owed @ 24.0%
- −$1,312
- After-tax cash flow
- $7,310/yr
For passive investors: Depreciation is non-cash, so a rental often shows a tax loss while cash-flowing — sheltering income. Rental losses are passive: they offset passive income freely, and up to $25,000/yr can offset ordinary (W-2) income if you actively participate and your MAGI is under $100k (phasing out to $0 by $150k); unused losses carry forward. On sale, claimed depreciation is recaptured at up to 25%, and gains may owe capital-gains tax (a 1031 exchange can defer both). Figures are a year-1 estimate at your 24.0% rate — not tax advice; consult a CPA.
Schools (NCES district)
- District
- Calcasieu Parish
- NCES district ID
- 2200330
- Math proficiency
- 30% ▼ -39.00%
- Reading proficiency
- 44% ▼ -33.00%
- Median HH income
- $44,700
- Composite
- 31.45/100
- National rank
- #5979
- State rank
- #29 of 98 in LA
Livability — Prien
- Score
- 64/100
- State rank
- #174
- US rank
- #14370
Category grades
Schools grade is shown separately in the Schools card above.
Census & demographics
- County
- Calcasieu Parish · 170,889 people
- Metro
- Lake Charles, LA
- Population (ZIP)
- 40,482
- Household income
- $86,015
- Rent vs Own
- Severe rent burden
- 1328.0
Population outlook (Calcasieu County) Hauer SSP2
- Today (2025)
- 212,179 people
- By 2030
- 218,199 · +2.8%
- By 2040
- 228,486 · +7.7%
- By 2050
- 236,208 · +11.3%
- By 2075
- 251,696 · +18.6%
- By 2100
- 247,848 · +16.8%
Race, ethnicity, and origin ACS 2023
- Neighborhood character
- Predominantly White (79%)
- Race & ethnicity
- White 79% Black 10% Hispanic / Latino 6% Two or more races 6% Asian 3%
- Hispanic origin (detail)
- Mexican 2%
- Common ancestry
- Lithuanian 12% Italian 3% Slovak 2%
- Foreign-born
- 6% · Canada, Jamaica
- Languages at home
- 92% English-only · Spanish 4% Other Indo-European 2% Other Asian/Pacific 1%
Political lean MEDSL · Calcasieu
- 2024 margin
- Solid R (+39.6) · D 29.5% · R 69.0% · Other 1.5%
- 2008→2024 swing
- -15.0pp toward R · 2008: -24.6pp · 2024: -39.6pp
- All cycles
- 2024: R+39.6 2020: R+35.2 2016: R+33.3 2012: R+28.7 2008: R+24.6
Not yet ingested
- Civics
- —
Market trends
- HPI YoY
- ▼ -102.68%
- Current HPI
- 105.1903
- Rent YoY
- ▲ 15.10%
- Metro
- Lake Charles, LA
- State GDP YoY
- ▲ 3.29%
- F500 in state
- 10
Industry mix (Fortune 500 HQ in LA)
| Industry | F500 HQs | Revenue |
|---|---|---|
| Telecommunications | 2 | $23B |
|
||
| Utilities | 1 | $12B |
|
||
| Wholesale / Distribution | 1 | $5B |
|
||
| Advertising | 1 | $2B |
|
||
Price history
+81.0% since first listed2 events — show timeline
- 2026-05-26 Listed $210,000 SWLAR
- 2005-03-23 Sold (Public Records) $116,000 Public Records
Property tax history
+0.5%/yrLatest (2025): $838 · +2.2% YoY. Source: county tax records.
Cash-flow waterfall
monthlySold comps — $/sqft
last 12 mo · ≤1 miLoading sold comps…