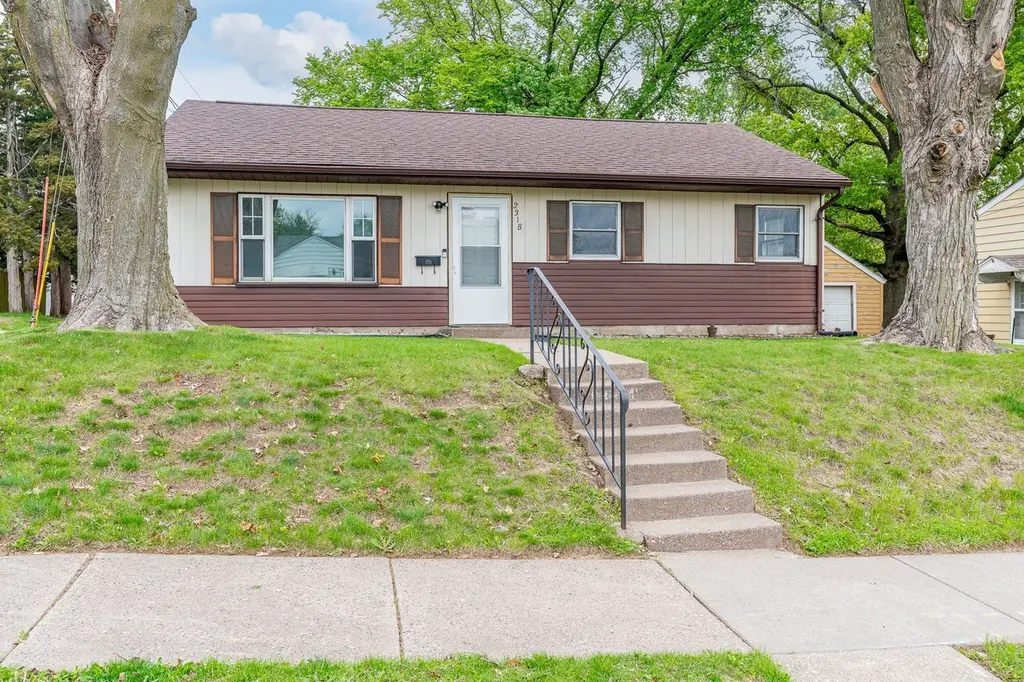
2318 N Sturdevant St · Davenport, IA
Flood risk 1/10 · Minimal
- FEMA flood zone
- X (unshaded)
- Chance of flooding over 30 yrs
- 0.0%
- Est. flood insurance / yr
- $507 – $1,088
Fire risk 1/10 · Minimal
- Est. fire insurance / yr
- $902 – $1,676
Heat risk 3/10 · Minor
- Hot days now (above 103°F)
- 7 days/yr
- Hot days in 30 yrs
- 16 days/yr
Wind risk 2/10 · Minimal
- Chance of severe wind over 30 yrs
- —
Air-quality risk 3/10 · Minor
- Unhealthy air days now
- 2 days/yr
- Unhealthy air days in 30 yrs
- 3 days/yr
Risk factors via First Street. Map © Google.
Why this score? — see what drove the D grade
The composite is a weighted blend of 9 inputs, each scored 0–100. Each bar is that input's sub-score; the figure is the points it added to the 100-point composite (weight × sub-score).
- ARV discount +10.9/15.0
- Cash flow +9.9/30.0
- Livability +4.0/5.0
- Schools +3.9/10.0
- Rent growth +3.5/5.0
- 1% rule +3.1/10.0
- DSCR +2.8/10.0
- Condition / age +2.5/5.0
- Appreciation +0.0/10.0
$150,000
🖨 Deal sheet 📄 Offer letter ✓ Due diligence
Listing remarks MLS
Spacious ranch home with over 1300 sq ft. located just a few blocks from Genesis West. This home features new furnace 2016, water heater 2016, roof 2013 and added insulation 2016. Large addition off the back of home offers family room with slider door overlooking fenced backyard. Large 2 car garage and shed.
Key facts
- 6,534 sq ft lot
- Built 1953
- Listed 24 days
Property features AI
Finance
- Other:
- Financial info:
- HOA & community: No master association fee required
Exterior
- Parking:
- Security:
- Utilities: Public water; Public sewer
- Home design: Detached single-family home; One-story
- Construction: Built approximately 71–80 years ago; Aluminum siding; Asphalt roof
- Exterior features: Level lot; Lot less than 0.25 acre
Interior
- Kitchen: Kitchen with luxury vinyl flooring; Range; Refrigerator
- Bedrooms: Three bedrooms (all on the main level)
- Flooring: Carpet in several bedrooms and the master bedroom; Laminate flooring in living room, family room and laundry; Luxury vinyl in kitchen
- Bathrooms: One full bathroom
- Heating & cooling: Natural gas heating; Central air conditioning
- Interior features: Six total rooms
- Laundry & utility: Main-level laundry room (6 x 8) with laminate flooring; Washer; Dryer
Neighborhood map
What this means for you Summary
Snapshot
- This is a 3-bed/1.0-bath single-family listed at $150k.
Deal economics
- At list price, monthly cash flow is $-93 ($-1k/yr) — negative.
- To cash-flow at today's rent, offer at most $134k (10.9% below list).
- To meet the 1% rule (rent ≥ 1% of price), the offer needs to be $121k (19.2% below list).
- Recommended offer: $121k (19.2% below list) — sets the bar for 1% rule.
- Cap rate 5.6% vs local median 4.4% in Davenport — meaningfully above typical; check what's discounted (condition, days-on-market, listing class) to confirm the premium yield is real.
Location & tenants
- Location reads 79/100 on livability (#126 in IA, #2,312 nationally) — a middle-class / working-renter tenant base. Strengths: cost of living A+, housing A+, health & safety A+; Watch: employment C-, crime F.
- Davenport Community School District (urban): math 43% / reading 50% proficiency, ranked #288 of 289 in IA (top 100%) — families likely to look elsewhere, expect single-tenant / working-renter base with shorter leases.
- Market conditions: Rents rising (+4.0%/yr); 161 active listings in the ZIP; 23 comparable units currently listed for rent nearby; rentals at typical pace (median 21d on market — plan ~3-4 weeks tenant-placement turnaround); 48% of comp listings sitting > 30 days — soft ceiling on asking rent; 805 units permitted in Scott County in 2024 (479 in 5+ unit buildings).
Forward outlook
- Local home prices are declining (-3.0%/yr); year-one equity from $1k of loan paydown is wiped out by about $4k of value loss. Plan a longer hold.
- Scott County population projected at +19% by 2050 — long-run rental-demand tailwind backs the buy-and-hold thesis.
Negotiation context
- It's been on market 24 days — a 2% lower offer ($148k) is reasonable based on typical stale-listing flexibility.
- 3 sale attempts since 9y ago; this cycle's ask has dropped $19k (11%) from the opening price — seller is motivated, your offer sets the floor, not the list.
- Current owner paid $70k; list at $150k implies a 114% gain — meaningful room to come down on a strong offer.
Risks & watch-outs
- Watch-outs: built in 1953 — expect roof / HVAC / electrical / plumbing capex.
Questions for the listing agent
- What do current leases actually rent for vs. the listed asking? Can we see a recent rent roll and the last 12 months of T-12 income?
- Built in 1953 — when were the roof, HVAC, electrical panel, plumbing, and water heater last replaced?
- Is there a deadline driving the sale (1031 exchange, divorce, estate, relocation)? That informs how much negotiation room exists.
- Crime grade is F in this area — have there been break-ins, vandalism, or insurance claims at this property in the last 3 years? What carrier currently insures it and at what premium?
- The area grade is low — what's the realistic commute time and amenity access for the typical tenant pool here? Any planned neighborhood developments (good or bad) we should know about?
- What's the average days-on-market for RENTAL listings here right now (not sales)? A rising rental-DOM trend means longer vacancies and softer asking-rent achievability than the comps imply.
- What's the recent tenant-quality profile in this submarket — average credit score on applications, eviction rate, late-payment / NSF rate, and stable-employment percentage? A property-management company in the area should have these aggregated.
- How much new for-sale + rental construction is in the pipeline within 1–3 miles? Heavy new supply typically softens prices + rents 12–24 months out; constrained supply supports both.
Investment metrics
- 1% rule
- 0.81% ✗
- Cap rate
- 5.55%
- Cash-on-cash
- -2.65%
- DSCR
- 0.88
- GRM
- 10.3
CMA / ARV
- ARV (median comp)
- $162,292
- List price
- $150,000
- Delta
- -7.57%
- Verdict
- FAIR
- Comps
- 20 within 1.0 mi
Show comp detail 12 sales within ~0.75 mi
| Address | Dist | Beds/Ba | Sqft | Sold | Price | $/sf | Match |
|---|---|---|---|---|---|---|---|
| 2030 N Sturdevant St | 0.20mi | 2/1.5 (-1) | 1,326 (-1%) | 1mo | $40,000 | $30 | 81 |
| 1629 W Columbia Ave | 0.20mi | 3/2.5 | 1,400 (+4%) | 0mo | $243,900 | $174 | 78 |
| 1548 W Central Park Ave | 0.17mi | 3/1.0 | 1,206 (-10%) | 2mo | $154,900 | $128 | 73 |
| 1442 W High St | 0.25mi | 2/2.0 (-1) | 1,263 (-6%) | 0mo | $130,000 | $103 | 69 |
| 2128 N Sturdevant St | 0.13mi | 3/2.0 | 1,514 (+13%) | 2mo | $167,900 | $111 | 67 |
| 1649 Florence Ln Ln | 0.10mi | 3/2.0 | 1,150 (-14%) | 2mo | $120,000 | $104 | 66 |
| 2323 Frances Pl | 0.58mi | 3/2.0 | 1,293 (-4%) | 1mo | $240,000 | $186 | 62 |
| 2102 W 18th St | 0.60mi | 3/1.0 | 1,236 (-8%) | 1mo | $155,000 | $125 | 57 |
| 2113 N Marquette St St | 0.43mi | 3/1.0 | 1,162 (-14%) | 2mo | $166,500 | $143 | 55 |
| 1341 W 14th St | 0.74mi | 3/1.5 | 1,244 (-7%) | 1mo | $131,900 | $106 | 50 |
| 1922 N Pine St | 0.69mi | 3/1.0 | 1,475 (+10%) | 3mo | $169,900 | $115 | 49 |
| 1618 N Marquette St | 0.61mi | 3/1.5 | 1,176 (-12%) | 3mo | $87,000 | $74 | 47 |
Match score weights: distance 35% · size 25% · config 20% · recency 20%. Top-matched comps best support the ARV.
Projected returns pro-forma
-3.0% appreciation · 3.99% rent growth · sell at horizon
- IRR
- -19.6%
- Equity multiple
- 0.31×
- Total profit
- $-28,958
- Equity at exit
- $22,365
- IRR
- -10.3%
- Equity multiple
- 0.34×
- Total profit
- $-27,599
- Equity at exit
- $12,969
Cash invested: $42,000 (down + closing). Projections, not guarantees.
Landlord ↔ Tenant lean methodology
- Overall (STATE)
- 83 Strongly Landlord-Friendly
- State Iowa
- 83 Strongly Landlord-Friendly · R+6
- County
- — inherits STATE
- City
- — inherits STATE
ZIP-level market 52804
- Home prices YoY
- -25.3%
- Rents YoY
- 4.0%
- Active inventory
- 161
- Price-to-rent
- 10.3×
Monthly cashflow live
- Estimated rent
- $1,212 high interval (Pro) →
- Mortgage (P&I)
- −$787
- Tax from tax record
- −$201 /mo · $2,408/yr
- Insurance
- −$62
- HOA
- −$0
- Vacancy / Maint / Mgmt
- −$254
- Net cashflow
- $-93
Break-even live
UW: 25.0% down · 7.5% · 30yr · 1.5% tax · 5.0% vac · 8.0% maint · 8.0% mgmt
Financing live
Cash to close
- Down payment
- $37,500
- Closing costs
- $4,500
- Reserves months
- —
- Total cash needed
- —
Loan-product check · same deal, 3 products live
Conventional
25% down · 7.5% · 30yr
- Down + closing
- —
- Monthly P&I
- —
- Monthly cashflow
- —
- DSCR
- —
- Eligible?
- —
Personal DTI + credit; lowest rate.
DSCR
20% down · 8.5% · 30yr
- Down + closing
- —
- Monthly P&I
- —
- Monthly cashflow
- —
- DSCR
- —
- Eligible?
- —
No personal income docs; deal must DSCR.
Hard money
10% down · 12.0% · 12mo
- Down + closing
- —
- Monthly P&I
- —
- Monthly cashflow
- —
- DSCR
- —
- Eligible?
- —
Short-term bridge; refi at stabilization.
Rent comps 23 comps
| Address | Beds | Baths | Sqft | Rent | $/sqft | DOM | Units | Dist |
|---|---|---|---|---|---|---|---|---|
| 1723 W Locust St Davenport, IA | 3.0 | 1.0 | 1690 | $1,395 | $0.83 | 43d | 1 | 0.38mi |
| 901 W 15th St Davenport, IA | 1.0–2.0 | 1.0–2.0 | 950 | $895 | $0.94 | 13d | 1 | 0.47mi |
| 1455 W 12th St Davenport, IA | 3.0 | 1.0 | 942 | $1,095 | $1.16 | 13d | 1 | 0.81mi |
| 1607 W 12th St Davenport, IA | 1.0–2.0 | 1.0 | 800 | $740 | $0.93 | 43d | 3 | 0.87mi |
| 915 W 14th St Davenport, IA | 3.0 | 1.0 | 1390 | $900 | $0.65 | 43d | 1 | 0.91mi |
| 1318 1/2 Brown St Davenport, IA | 2.0 | 1.0 | 900 | $875 | $0.97 | 20d | 1 | 0.99mi |
| 1315 Brown St Unit 2 Davenport, IA | 3.0 | 1.0 | 1300 | $1,250 | $0.96 | 20d | 1 | 1.01mi |
| 621 W 15th St Davenport, IA | 4.0 | 2.0 | 1833 | $1,500 | $0.82 | 13d | 1 | 1.03mi |
| 537 W 16th St Davenport, IA | 3.0 | 1.0 | 1311 | $1,400 | $1.07 | 43d | 1 | 1.03mi |
| 1323 N Gaines St Davenport, IA | 4.0 | 2.0 | 1733 | $1,350 | $0.78 | 20d | 1 | 1.07mi |
| 1716 W 7th St Davenport, IA | 4.0 | 1.0 | 1278 | $1,712 | $1.34 | 13d | 1 | 1.11mi |
| 1615 1/2 N Ripley St Davenport, IA | 2.0 | 1.0 | 900 | $825 | $0.92 | 43d | 1 | 1.16mi |
| 2638 N Clark St Unit 2 Davenport, IA | 3.0 | 1.5 | 1200 | $1,250 | $1.04 | 13d | 1 | 1.17mi |
| 1519 N Ripley St Davenport, IA | 2.0 | 1.0 | 1144 | $1,100 | $0.96 | 13d | 1 | 1.18mi |
| 1511 N Ripley St Davenport, IA | 4.0 | 2.0 | 1872 | $1,450 | $0.77 | 20d | 1 | 1.19mi |
| 2809 N Main St Davenport, IA | 3.0 | 1.5 | 1000 | $1,350 | $1.35 | 20d | 1 | 1.29mi |
| 730 Brown St Unit 3 Davenport, IA | 2.0 | 1.0 | 1000 | $800 | $0.80 | 43d | 1 | 1.29mi |
| 1421 N Main St #2 Davenport, IA | 3.0 | 1.0 | 1350 | $1,095 | $0.81 | 43d | 1 | 1.36mi |
| 1341 W 4th St Davenport, IA | 3.0 | 1.5 | 979 | $1,394 | $1.42 | 43d | 1 | 1.39mi |
| 201 E Locust St Unit Sw Davenport, IA | 2.0 | 1.0 | 1000 | $875 | $0.88 | 43d | 1 | 1.42mi |
| 1812 Pershing Ave Unit 1 Davenport, IA | 3.0 | 1.0 | 1000 | $1,200 | $1.20 | 20d | 1 | 1.47mi |
| 2224 Iowa St Davenport, IA | 2.0 | 1.0 | 1214 | $895 | $0.74 | 43d | 1 | 1.48mi |
| 2224 Iowa St Unit 2224 Davenport, IA | 2.0 | 1.0 | 1214 | $925 | $0.76 | 43d | 1 | 1.48mi |
Listing history 6 events
-
2026-05-13price $159,000 131-char remark
-
2026-05-02$169,000 Active 131-char remark
-
2017-04-07soldstatus $70,000 309-char remark
Show marketing remark (309 chars)
Spacious ranch home with over 1300 sq ft. located just a few blocks from Genesis West. This home features new furnace 2016, water heater 2016, roof 2013 and added insulation 2016. Large addition off the back of home offers family room with slider door overlooking fenced backyard. Large 2 car garage and shed.
-
2017-02-13$89,900 309-char remark
Show marketing remark (309 chars)
Spacious ranch home with over 1300 sq ft. located just a few blocks from Genesis West. This home features new furnace 2016, water heater 2016, roof 2013 and added insulation 2016. Large addition off the back of home offers family room with slider door overlooking fenced backyard. Large 2 car garage and shed.
ⓘ Source: listings_history table (triggers on properties + properties_extension) + one-shot
backfill from property_details.listing_events for pre-trigger history.
Tax reassessment forecast IA · Partial reset (capped growth)
- Current annual tax
- $2,408 · $201/mo
- Projected year-2 tax
- $2,408 · $201/mo
- Expected delta
- $0/yr ($0/mo · 0.0%)
ⓘ Screening estimate from a state-policy table — verify with the county assessor before closing.
Climate risk First Street
- Flood 1/10 Low FEMA zone X (unshaded) · 0% chance over 30 yrs
- Wildfire 1/10 Low
- Heat 3/10 Moderate 7 d/yr ≥103°F today · 16 d/yr by 30 yrs out
- Wind 2/10 Low
- Air quality 3/10 Moderate 2 unhealthy d/yr today · 3 by 30 yrs out
Nearby sold comps map
Loading sold comps map…
Walkable amenities ~0.75 mi
Loading nearby amenities…
Taxation est. · year 1
- Rental income
- $14,540
- − Mortgage interest
- −$8,402
- − Property taxes
- −$2,408
- − Insurance
- −$750
- − Repairs & maintenance
- −$1,163
- − Management
- −$1,163
- − Depreciation
- −$4,364
- Taxable loss
- −$3,711
- Est. tax savings @ 24.0%
- +$891
- After-tax cash flow
- $-220/yr
For passive investors: Depreciation is non-cash, so a rental often shows a tax loss while cash-flowing — sheltering income. Rental losses are passive: they offset passive income freely, and up to $25,000/yr can offset ordinary (W-2) income if you actively participate and your MAGI is under $100k (phasing out to $0 by $150k); unused losses carry forward. On sale, claimed depreciation is recaptured at up to 25%, and gains may owe capital-gains tax (a 1031 exchange can defer both). Figures are a year-1 estimate at your 24.0% rate — not tax advice; consult a CPA.
Schools (NCES district)
- District
- Davenport Community School District
- NCES district ID
- 1908580
- Math proficiency
- 43% ▼ -11.00%
- Reading proficiency
- 50% ▼ -3.00%
- Median HH income
- $46,157
- Composite
- 39.49/100
- National rank
- #3951
- State rank
- #288 of 289 in IA
Livability — Davenport
- Score
- 79/100
- State rank
- #126
- US rank
- #2312
Category grades
Schools grade is shown separately in the Schools card above.
Census & demographics
- Census place
- Davenport, IA
- County
- Scott County · 144,583 people
- City population
- 103,319
- Metro
- Davenport-Moline-Rock Island, IA-IL
- Population (ZIP)
- 26,835
- Household income
- $65,849
- Rent vs Own
- Severe rent burden
- 830.0
Population outlook (Scott County) Hauer SSP2
- Today (2025)
- 188,878 people
- By 2030
- 196,648 · +4.1%
- By 2040
- 210,860 · +11.6%
- By 2050
- 224,359 · +18.8%
- By 2075
- 258,884 · +37.1%
- By 2100
- 286,447 · +51.7%
Race, ethnicity, and origin ACS 2023
- Neighborhood character
- Predominantly White (71%)
- Race & ethnicity
- White 71% Black 10% Hispanic / Latino 10% Two or more races 9% Asian 2%
- Hispanic origin (detail)
- Mexican 8%
- Common ancestry
- Iranian 2% Romanian 2% Portuguese 1%
- Foreign-born
- 4% · Canada, China, Vietnam
- Languages at home
- 94% English-only · Spanish 3% Russian/Polish/Slavic 1% Chinese 1%
Political lean MEDSL · Scott
- 2024 margin
- Toss-up / Even · D 47.3% · R 51.2% · Other 1.4%
- 2008→2024 swing
- -18.4pp toward R · 2008: 14.6pp · 2024: -3.9pp
- All cycles
- 2024: R+3.9 2020: D+3.5 2016: D+1.4 2012: D+13.8 2008: D+14.6
Not yet ingested
- Civics
- —
Market trends
- HPI YoY
- ▼ -66.50%
- Current HPI
- 196.2267
- Rent YoY
- ▲ 3.99%
- Metro
- Davenport-Moline-Rock Island, IA-IL
- State GDP YoY
- ▲ 2.48%
- F500 in state
- 4
Industry mix (Fortune 500 HQ in IA)
| Industry | F500 HQs | Revenue |
|---|---|---|
| Financial Services | 1 | $16B |
|
||
| Retail / Convenience | 1 | $15B |
|
||
Price history
+66.9% since first listed8 events — show timeline
- 2026-05-28 Pending — MRED as Distributed by MLS Grid
- 2026-05-21 Price Changed $150,000 MRED as Distributed by MLS Grid
- 2026-05-13 Price Changed $159,000 MRED as Distributed by MLS Grid
- 2026-05-02 Listed $169,000 MRED as Distributed by MLS Grid
- 2017-04-07 Sold (MLS) $70,000 RMLSA as Distributed by MLS Grid
- 2017-04-07 Sold (MLS) $70,000 MRED as Distributed by MLS Grid
- 2017-02-13 Listed $89,900 RMLSA as Distributed by MLS Grid
- 2017-02-13 Listed $89,900 MRED as Distributed by MLS Grid
Property tax history
+1.4%/yrLatest (2025): $2,408 · +2.5% YoY. Source: county tax records.
Cash-flow waterfall
monthlySold comps — $/sqft
last 12 mo · ≤1 miLoading sold comps…