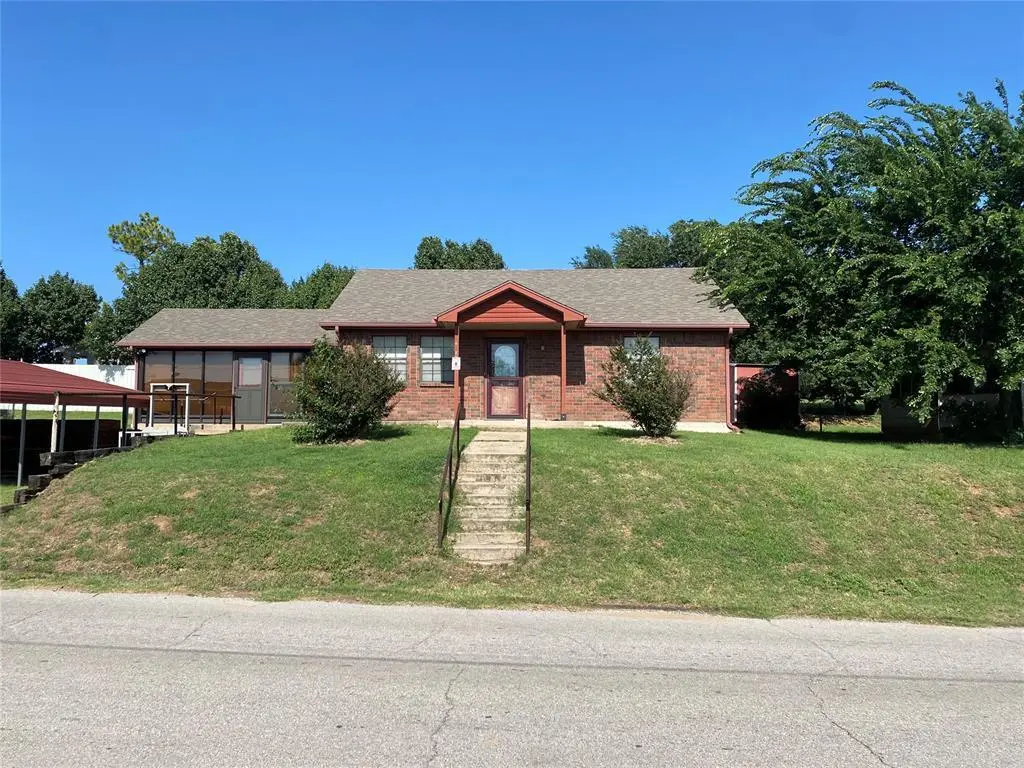
410 N C St · Cement, OK
Flood risk 1/10 · Minimal
- FEMA flood zone
- X (unshaded)
- Chance of flooding over 30 yrs
- 0.0%
- Est. flood insurance / yr
- $507 – $1,088
Fire risk 9/10 · Severe
- Est. fire insurance / yr
- $2,463 – $4,575
Heat risk 5/10 · Moderate
- Hot days now (above 107°F)
- 7 days/yr
- Hot days in 30 yrs
- 18 days/yr
Wind risk 2/10 · Minimal
- Chance of severe wind over 30 yrs
- 3.0%
Air-quality risk 2/10 · Minimal
- Unhealthy air days now
- 0 days/yr
- Unhealthy air days in 30 yrs
- 1 days/yr
Risk factors via First Street. Map © Google.
Why this score? — see what drove the D+ grade
The composite is a weighted blend of 9 inputs, each scored 0–100. Each bar is that input's sub-score; the figure is the points it added to the 100-point composite (weight × sub-score).
- Cash flow +19.5/30.0
- DSCR +6.2/10.0
- Appreciation +5.5/10.0
- 1% rule +5.2/10.0
- Livability +3.2/5.0
- Condition / age +2.8/5.0
- Rent growth +2.5/5.0
- Schools +2.2/10.0
- ARV discount +0.0/15.0
$112,000
🖨 Deal sheet 📄 Offer letter ✓ Due diligence
Listing remarks
Charming Brick Home in a Quiet Small-Town Community Welcome to this inviting brick home nestled in a friendly, small community where neighbors still wave and life moves at a more relaxed pace. Featuring 2–3 bedrooms and 1 bathroom, this well-kept home is perfect for first-time buyers, downsizers, or anyone looking for an affordable, low-maintenance place to call home. Use the third room as a bedroom, home office, or hobby room. The brick exterior offers classic curb appeal and long-lasting durability. Come see how comfortable and simple life can be in this charming brick home!
Key facts
- Brick home
- Curb appeal
- Low maintenance
Tags
Property features AI
Finance
- Other: Living area approximately 1,356 (assessor); Property located in Cement, OK
- Financial info: Loan qualification available; Not assumable
- HOA & community: No mandatory association dues
Exterior
- Utilities: Homestead not claimed
- Home design: Single family residence; One level; Residential property
- Construction: Brick construction; Composition roof; Built status: existing
- Exterior features: Outbuildings; Interior lot
Interior
- Bedrooms: 3 bedrooms
- Bathrooms: 1 full bathroom
- Heating & cooling: Electric heating
- Interior features: One living area; No fireplace; Conventional foundation
Neighborhood map
What this means for you Summary
Snapshot
- This is a 3-bed/1.0-bath single-family listed at $112k. Condition is rated average.
Deal economics
- At list price, monthly cash flow is $128 ($2k/yr) — positive.
- The deal already cash-flows at list — no discount required.
- Meets the 1% rule at list price ($1k rent vs $112k).
Location & tenants
- Location reads 64/100 on livability (#174 in OK) — a middle-class / working-renter tenant base. Strengths: crime A+, cost of living A+, housing A+; Watch: amenities F, commute F, employment F.
- Cement (rural): math 20% / reading 25% proficiency, ranked #378 of 513 in OK (top 74%) — low school quality limits family demand, transient renter base, plan for 1-2y turnover; 66% free/reduced lunch — lower-income household profile, screen leases tightly.
- Zoned schools: Cement Es (math 12% / reading 22%, grade F, #540 of 845 statewide, top 68%, 141 students, 0% FRL); Cement Hs (math 24% / reading 24%, grade F, #150 of 447 statewide, top 48%, 64 students, 0% FRL) — zoned schools average 0% FRL vs 66% district-wide (66 pts lower); this property's tenant base skews higher-income than the district average.
- Market conditions: 18 active listings in the ZIP.
Forward outlook
- In year one you build about $2k of equity ($774 loan paydown + $1k appreciation (0.9% local appreciation)).
- Caddo County population projected to shrink 7% by 2050 — rents likely to lag national; underwrite the cash flow, not the appreciation.
- At projected returns (0.9% appreciation + 3.0% rent growth), your $31k cash investment doubles in ~8 years — after that, you're playing with house money.
Negotiation context
- Only 9 days on market — expect competitive offers; lowballing is unlikely to land.
Risks & watch-outs
- Climate carrying-cost: severe wildfire risk; extreme-heat days projected 7→18/yr by 2055 (HVAC capex compounding) — expect insurance premiums to compound above CPI over the hold.
Questions for the listing agent
- Is there a deadline driving the sale (1031 exchange, divorce, estate, relocation)? That informs how much negotiation room exists.
- Schools are F-rated, which usually means shorter tenancies and higher turnover. Who's the typical renter profile here, and what's been the actual vacancy rate?
- The area grade is low — what's the realistic commute time and amenity access for the typical tenant pool here? Any planned neighborhood developments (good or bad) we should know about?
- What's the average days-on-market for RENTAL listings here right now (not sales)? A rising rental-DOM trend means longer vacancies and softer asking-rent achievability than the comps imply.
- What's the recent tenant-quality profile in this submarket — average credit score on applications, eviction rate, late-payment / NSF rate, and stable-employment percentage? A property-management company in the area should have these aggregated.
- How much new for-sale + rental construction is in the pipeline within 1–3 miles? Heavy new supply typically softens prices + rents 12–24 months out; constrained supply supports both.
Investment metrics
- 1% rule
- 1.02% ✓
- Cap rate
- 7.66%
- Cash-on-cash
- 4.89%
- DSCR
- 1.22
- GRM
- 8.2
CMA / ARV
- ARV (on-the-fly)
- $93,564
- Comps found
- 4
Show comp detail 4 sales within ~0.75 mi
| Address | Dist | Beds/Ba | Sqft | Sold | Price | $/sf | Match |
|---|---|---|---|---|---|---|---|
| 210 E 5th St | 0.03mi | 3/1.0 | 1,329 (-2%) | 17mo | $36,000 | $27 | 81 |
| 626 N Main St | 0.20mi | 3/1.0 | 1,467 (+8%) | 1mo | $123,000 | $84 | 76 |
| 108 SE East St | 0.28mi | 3/1.0 | 1,377 (+2%) | 16mo | $95,000 | $69 | 71 |
| 102 NE Avenue | 0.22mi | 3/1.0 | 1,192 (-12%) | 10mo | $65,500 | $55 | 61 |
Match score weights: distance 35% · size 25% · config 20% · recency 20%. Top-matched comps best support the ARV.
Projected returns pro-forma
0.94% appreciation · 3.0% rent growth · sell at horizon
- IRR
- 6.2%
- Equity multiple
- 1.32×
- Total profit
- $9,900
- Equity at exit
- $37,867
- IRR
- 10.5%
- Equity multiple
- 2.27×
- Total profit
- $39,772
- Equity at exit
- $50,039
Cash invested: $31,360 (down + closing). Projections, not guarantees.
Landlord ↔ Tenant lean methodology
- Overall (STATE)
- 83 Strongly Landlord-Friendly
- State Oklahoma
- 83 Strongly Landlord-Friendly · R+20
- County
- — inherits STATE
- City
- — inherits STATE
ZIP-level market 73017
- Home prices YoY
- 0.4%
- Active inventory
- 18
- Price-to-rent
- 8.2×
Monthly cashflow live
- Estimated rent
- $1,141 medium interval (Pro) →
- Mortgage (P&I)
- −$587
- Tax est. 1.5%
- −$140 /mo · $1,680/yr
- Insurance
- −$47
- HOA
- −$0
- Vacancy / Maint / Mgmt
- −$240
- Net cashflow
- $128
Break-even live
UW: 25.0% down · 7.5% · 30yr · 1.5% tax · 5.0% vac · 8.0% maint · 8.0% mgmt
Financing live
Cash to close
- Down payment
- $28,000
- Closing costs
- $3,360
- Reserves months
- —
- Total cash needed
- —
Loan-product check · same deal, 3 products live
Conventional
25% down · 7.5% · 30yr
- Down + closing
- —
- Monthly P&I
- —
- Monthly cashflow
- —
- DSCR
- —
- Eligible?
- —
Personal DTI + credit; lowest rate.
DSCR
20% down · 8.5% · 30yr
- Down + closing
- —
- Monthly P&I
- —
- Monthly cashflow
- —
- DSCR
- —
- Eligible?
- —
No personal income docs; deal must DSCR.
Hard money
10% down · 12.0% · 12mo
- Down + closing
- —
- Monthly P&I
- —
- Monthly cashflow
- —
- DSCR
- —
- Eligible?
- —
Short-term bridge; refi at stabilization.
Listing history 7 events
-
2026-06-18days on market $112,000 Active 9 DOM
-
2026-06-17days on market $112,000 Active 8 DOM
-
2026-06-16days on market $112,000 Active 7 DOM
-
2026-06-15days on market $112,000 Active 6 DOM
-
2026-06-13days on market $112,000 Active 4 DOM
-
2026-06-10remarks 583-char remark
-
2026-06-10$112,000 Active 1 DOM
ⓘ Source: listings_history table (triggers on properties + properties_extension) + one-shot
backfill from property_details.listing_events for pre-trigger history.
Climate risk First Street
- Flood 1/10 Low FEMA zone X (unshaded) · 0% chance over 30 yrs
- Wildfire 9/10 Extreme
- Heat 5/10 Major 7 d/yr ≥107°F today · 18 d/yr by 30 yrs out
- Wind 2/10 Low 3% chance of damaging wind over 30 yrs
- Air quality 2/10 Low 0 unhealthy d/yr today · 1 by 30 yrs out
Nearby sold comps map
Loading sold comps map…
Walkable amenities ~0.75 mi
Loading nearby amenities…
Taxation est. · year 1
- Rental income
- $13,697
- − Mortgage interest
- −$6,274
- − Property taxes
- −$1,680
- − Insurance
- −$560
- − Repairs & maintenance
- −$1,096
- − Management
- −$1,096
- − Depreciation
- −$3,258
- Taxable loss
- −$267
- Est. tax savings @ 24.0%
- +$64
- After-tax cash flow
- $1,596/yr
For passive investors: Depreciation is non-cash, so a rental often shows a tax loss while cash-flowing — sheltering income. Rental losses are passive: they offset passive income freely, and up to $25,000/yr can offset ordinary (W-2) income if you actively participate and your MAGI is under $100k (phasing out to $0 by $150k); unused losses carry forward. On sale, claimed depreciation is recaptured at up to 25%, and gains may owe capital-gains tax (a 1031 exchange can defer both). Figures are a year-1 estimate at your 24.0% rate — not tax advice; consult a CPA.
Condition & rehab AI · 9 photos
This charming brick home in a quiet small-town community has average condition and could benefit from moderate renovations to increase its resale and rental value.
Repairs flagged
- Moderate kitchen cabinets — dated and in need of updating
- Minor kitchen countertops — tile is in good condition
Value-add opportunities
- Both update kitchen cabinets and countertops — modernizing the kitchen will appeal to buyers and renters
- Both paint interior walls — fresh paint can make a significant difference in the home's appearance
- Both landscaping — improved landscaping can enhance curb appeal and attract more potential buyers
Renovation cost estimate screening
| Repair item | Severity | Est. cost |
|---|---|---|
| kitchen cabinets · dated and in need of updating | Moderate | $3,000–15,000 |
| kitchen countertops · tile is in good condition | Minor | $500–3,000 |
| Total estimated repair cost · 2 items | $3,500–18,000 |
Value-add ROI direction
- Both update kitchen cabinets and countertops — modernizing the kitchen will appeal to buyers and renters ↑
- Both paint interior walls — fresh paint can make a significant difference in the home's appearance ↑
- Both landscaping — improved landscaping can enhance curb appeal and attract more potential buyers ↑
ⓘ Cost ranges are severity-bucket heuristics (US national rule-of-thumb). Get contractor quotes + a written scope before underwriting a rehab budget.
Schools (NCES district)
- District
- Cement
- NCES district ID
- 4006960
- Math proficiency
- 20% ▲ 5.00%
- Reading proficiency
- 25% ▼ -5.00%
- Median HH income
- $39,786
- Composite
- 22.14/100
- National rank
- #13524
- State rank
- #378 of 513 in OK
Livability — Cement
- Score
- 64/100
- State rank
- #174
- US rank
- #13913
Category grades
Schools grade is shown separately in the Schools card above.
Census & demographics
- Census place
- Cement, OK
- Population (ZIP)
- 1,318
Population outlook (Caddo County) Hauer SSP2
- Today (2025)
- 28,391 people
- By 2030
- 27,844 · -1.9%
- By 2040
- 27,057 · -4.7%
- By 2050
- 26,484 · -6.7%
- By 2075
- 26,266 · -7.5%
- By 2100
- 26,077 · -8.2%
Race, ethnicity, and origin ACS 2023
- Neighborhood character
- Predominantly White (76%)
- Race & ethnicity
- White 76% Two or more races 19% Hispanic / Latino 13% Native American 3%
- Hispanic origin (detail)
- Mexican 4%
- Common ancestry
- Slovak 5% Iranian 5% Lithuanian 2%
- Foreign-born
- 2% · Canada
- Languages at home
- 96% English-only · Spanish 3%
Political lean MEDSL · Caddo
- 2024 margin
- Solid R (+47.1) · D 25.4% · R 72.5% · Other 2.1%
- 2008→2024 swing
- -16.4pp toward R · 2008: -30.7pp · 2024: -47.1pp
- All cycles
- 2024: R+47.1 2020: R+44.0 2016: R+43.4 2012: R+28.5 2008: R+30.7
Not yet ingested
- Civics
- —
Market trends
- HPI YoY
- ▲ 0.94%
- Current HPI
- 258.0561
- Rent YoY
- —
- Metro
- —
- State GDP YoY
- ▲ 1.55%
- F500 in state
- 6
Industry mix (Fortune 500 HQ in OK)
| Industry | F500 HQs | Revenue |
|---|---|---|
| Energy | 3 | $48B |
|
||
Price history
1 event — show timeline
- 2026-06-09 Listed $112,000 MLSOK
Cash-flow waterfall
monthlySold comps — $/sqft
last 12 mo · ≤1 miLoading sold comps…