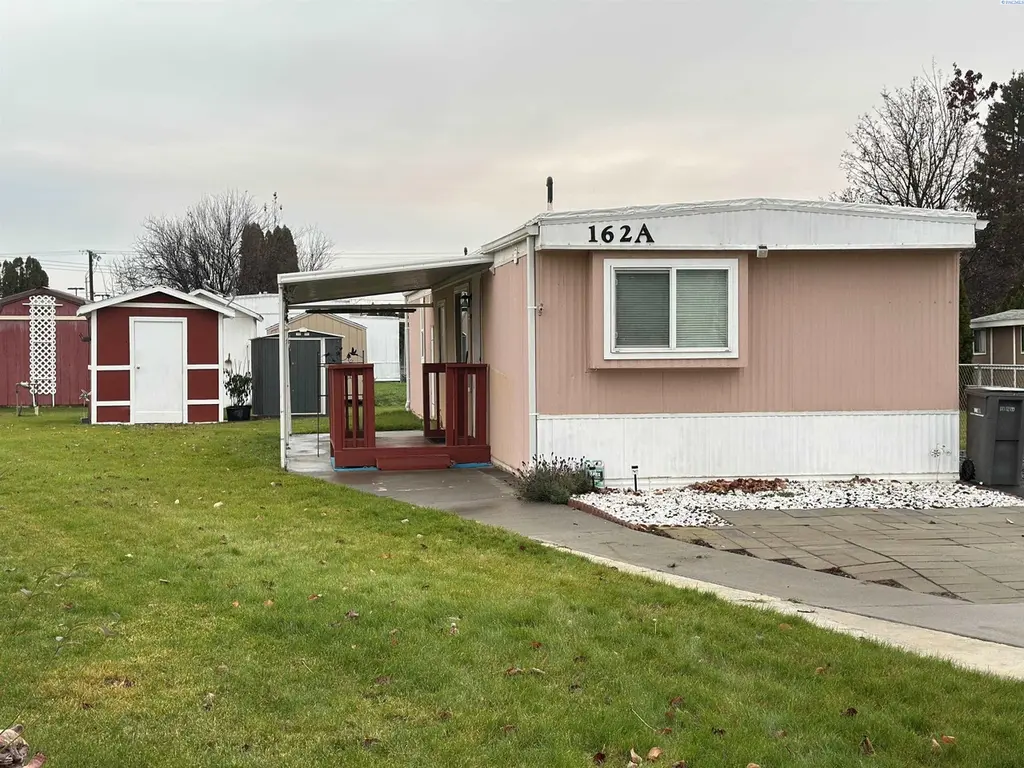
7901 W Clearwater Ave. #162a Ave Unit 162a · Kennewick, WA
Flood risk 1/10 · Minimal
- FEMA flood zone
- —
- Chance of flooding over 30 yrs
- 0.0%
- Est. flood insurance / yr
- —
Fire risk 4/10 · Minor
- Est. fire insurance / yr
- $604 – $1,122
Heat risk 5/10 · Moderate
- Hot days now (above 98°F)
- 7 days/yr
- Hot days in 30 yrs
- 14 days/yr
Wind risk 1/10 · Minimal
- Chance of severe wind over 30 yrs
- —
Air-quality risk 8/10 · Major
- Unhealthy air days now
- 14 days/yr
- Unhealthy air days in 30 yrs
- 15 days/yr
Risk factors via First Street. Map © Google.
Why this score? — see what drove the B+ grade
The composite is a weighted blend of 9 inputs, each scored 0–100. Each bar is that input's sub-score; the figure is the points it added to the 100-point composite (weight × sub-score).
- Cash flow +30.0/30.0
- ARV discount +15.0/15.0
- 1% rule +10.0/10.0
- DSCR +10.0/10.0
- Schools +4.6/10.0
- Livability +3.9/5.0
- Rent growth +3.3/5.0
- Condition / age +2.5/5.0
- Appreciation +0.0/10.0
$59,999
🖨 Deal sheet (PDF) 📄 Offer letter ✓ Due diligence
Listing remarks MLS
MLS# 289253 Well maintained and move-in ready home in a prime location! Enjoy a bright and welcoming interior, plus a private outdoor patio perfect for relaxing or entertaining. Convenient off-street parking adds privacy and ease. Located close to shopping, dining, parks, and major routes. centers. This Manufactured Home features a central air system for efficient year-round comfort, and a remodeled bathroom with modern finishes. A great opportunity for low-maintenance living in a well-kept community.
Key facts
- Remodeled bathroom
- Central air system
- Off-street parking
Tags
Neighborhood map
What this means for you Summary
Snapshot
- This is a 2-bed/1.0-bath manufactured listed at $60k.
Deal economics
- At list price, monthly cash flow is $1k ($12k/yr) — positive.
- The deal already cash-flows at list — no discount required.
- Meets the 1% rule at list price ($2k rent vs $60k).
- Recommended offer: $53k (12.0% below list) — sets the bar for market timing.
- Cap rate 26.7% vs local median 3.3% in Kennewick — top-decile yield for the area; either an underpriced asset or a hidden risk that comps aren't pricing in. Stress-test before assuming the spread holds.
Location & tenants
- Location reads 78/100 on livability (#131 in WA, #2,599 nationally) — a middle-class / working-renter tenant base. Strengths: commute A+, housing A+, health & safety A; Watch: amenities D+, crime F.
- Kennewick School District (urban): math 43% / reading 58% proficiency, ranked #141 of 291 in WA (top 48%) — acceptable for families but not a draw, mixed tenant base, ~2y average lease.
- Zoned schools: Ridge View Elementary School (334 students, 38% FRL); Desert Hills Middle School (889 students, 29% FRL); Kamiakin High School (1,884 students, 43% FRL).
- Market conditions: Rents rising (+3.4%/yr); 292 active listings in the ZIP; 4 comparable units currently listed for rent nearby; rentals at typical pace (median 16d on market — plan ~3-4 weeks tenant-placement turnaround); 1,532 units permitted in Benton County in 2024 (389 in 5+ unit buildings).
- This rent runs 33% of the median local income ($63k/yr) — at the standard rent-burdened threshold; future hikes will face affordability resistance.
Forward outlook
- Local home prices are declining (-3.0%/yr); year-one equity from $415 of loan paydown is wiped out by about $2k of value loss. Plan a longer hold.
- Benton County population projected at +32% by 2050 — long-run rental-demand tailwind backs the buy-and-hold thesis.
- At projected returns (-3.0% appreciation + 3.4% rent growth), your $17k cash investment doubles in ~2 years — after that, you're playing with house money.
Negotiation context
- It's been on market 198 days — a 12% lower offer ($53k) is reasonable based on typical stale-listing flexibility.
- 4 sale attempts since 12y ago with the ask held roughly flat each time — persistent listings suggest the price (not the market) is what's stuck; bring a comps-based counter.
Risks & watch-outs
- Climate carrying-cost: extreme-heat days projected 7→14/yr by 2055 (HVAC capex compounding) — expect insurance premiums to compound above CPI over the hold.
Questions for the listing agent
- It's been on market 198 days. Have you received any prior offers? Is the seller open to a 12% concession, seller financing, or rate buy-down credit?
- Built in 1977 — when were the roof, HVAC, electrical panel, plumbing, and water heater last replaced?
- Why hasn't it sold? Are there any deal-killer items the seller is aware of (foundation, flood, title, zoning, code violations)?
- Is there a deadline driving the sale (1031 exchange, divorce, estate, relocation)? That informs how much negotiation room exists.
- Schools are D-rated, which usually means shorter tenancies and higher turnover. Who's the typical renter profile here, and what's been the actual vacancy rate?
- Crime grade is F in this area — have there been break-ins, vandalism, or insurance claims at this property in the last 3 years? What carrier currently insures it and at what premium?
- What's the average days-on-market for RENTAL listings here right now (not sales)? A rising rental-DOM trend means longer vacancies and softer asking-rent achievability than the comps imply.
- What's the recent tenant-quality profile in this submarket — average credit score on applications, eviction rate, late-payment / NSF rate, and stable-employment percentage? A property-management company in the area should have these aggregated.
- How much new for-sale + rental construction is in the pipeline within 1–3 miles? Heavy new supply typically softens prices + rents 12–24 months out; constrained supply supports both.
Investment metrics
- 1% rule
- 2.90% ✓
- Cap rate
- 26.74%
- Cash-on-cash
- 73.01%
- DSCR
- 4.25
- GRM
- 2.9
CMA / ARV
- ARV (median comp)
- $77,000
- List price
- $59,999
- Delta
- -22.08%
- Verdict
- UNDERPRICED
- Comps
- 3 within 2.0 mi
Projected returns pro-forma
-3.0% appreciation · 3.39% rent growth · sell at horizon
- IRR
- 73.2%
- Equity multiple
- 4.34×
- Total profit
- $56,048
- Equity at exit
- $8,946
- IRR
- 77.1%
- Equity multiple
- 9.06×
- Total profit
- $135,410
- Equity at exit
- $5,188
Cash invested: $16,800 (down + closing). Projections, not guarantees.
Landlord ↔ Tenant lean methodology
- Overall (STATE)
- 28 Tenant-Leaning
- State Washington
- 28 Tenant-Leaning · D+8
- County
- — inherits STATE
- City
- — inherits STATE
ZIP-level market 99336
- Rents YoY
- 3.4%
- Active inventory
- 292
- Price-to-rent
- 2.9×
Monthly cashflow live
- Estimated rent
- $1,738 medium interval (Pro) →
- Mortgage (P&I)
- −$315
- Tax from tax record
- −$12 /mo · $139/yr
- Insurance
- −$25
- HOA
- −$0
- Vacancy / Maint / Mgmt
- −$365
- Net cashflow
- $1,022
Break-even live
Sensitivity live
| Price | -10% $1,056 | -5% $1,039 | +0% $1,022 | +5% $1,005 | +10% $988 |
|---|---|---|---|---|---|
| Rent | -10% $885 | -5% $953 | +0% $1,022 | +5% $1,091 | +10% $1,159 |
| Rate | -1.0pp $1,052 | -0.5pp $1,037 | base $1,022 | +0.5pp $1,007 | +1.0pp $991 |
UW: 25.0% down · 7.5% · 30yr · 1.5% tax · 5.0% vac · 8.0% maint · 8.0% mgmt
Financing live
Cash to close
- Down payment
- $15,000
- Closing costs
- $1,800
- Reserves months
- —
- Total cash needed
- —
Loan-product check · same deal, 3 products live
Conventional
25% down · 7.5% · 30yr
- Down + closing
- —
- Monthly P&I
- —
- Monthly cashflow
- —
- DSCR
- —
- Eligible?
- —
Personal DTI + credit; lowest rate.
DSCR
20% down · 8.5% · 30yr
- Down + closing
- —
- Monthly P&I
- —
- Monthly cashflow
- —
- DSCR
- —
- Eligible?
- —
No personal income docs; deal must DSCR.
Hard money
10% down · 12.0% · 12mo
- Down + closing
- —
- Monthly P&I
- —
- Monthly cashflow
- —
- DSCR
- —
- Eligible?
- —
Short-term bridge; refi at stabilization.
Rent comps 4 comps
| Address | Beds | Baths | Sqft | Rent | $/sqft | DOM | Units | Dist |
|---|---|---|---|---|---|---|---|---|
| 7803 W Deschutes Ave Kennewick, WA | 1.0–3.0 | 1.0–2.0 | 925 | $1,770 | $1.91 | 15d | 13 | 0.31mi |
| 7968 W 10th Ave Kennewick, WA | 1.0–3.0 | 1.0–2.0 | 951 | $1,875 | $1.97 | 15d | 10 | 0.67mi |
| 7960 W 10th Ave Kennewick, WA | 1.0–2.0 | 1.0–2.0 | 946 | $2,345 | $2.48 | 15d | 9 | 0.69mi |
| 1950 Bellerive Dr Richland, WA | 2.0 | 1.0 | 710 | $1,058 | $1.49 | 15d | 5 | 1.47mi |
Listing history 26 events
-
2026-06-21days on market $59,999 Active 198 DOM
-
2026-06-18days on market $59,999 Active 195 DOM
-
2026-06-17days on market $59,999 Active 194 DOM
-
2026-06-16days on market $59,999 Active 193 DOM
-
2026-06-15days on market $59,999 Active 192 DOM
-
2026-06-14days on market $59,999 Active 190 DOM
-
2026-06-13days on market $59,999 Active 189 DOM
-
2026-06-10days on market $59,999 Active 187 DOM
-
2026-06-09days on market $59,999 Active 186 DOM
-
2026-06-08days on market $59,999 Active 185 DOM
-
2026-06-07days on market $59,999 Active 184 DOM
-
2026-06-05days on market $59,999 Active 181 DOM
-
2026-06-03days on market $59,999 Active 180 DOM
-
2026-06-02days on market $59,999 Active 179 DOM
-
2026-06-01days on market $59,999 Active 178 DOM
-
2026-05-31days on market $59,999 Active 177 DOM
-
2026-05-30days on market $59,999 Active 176 DOM
-
2026-03-20price $59,999 506-char remark
Show marketing remark (506 chars)
MLS# 289253 Well maintained and move-in ready home in a prime location! Enjoy a bright and welcoming interior, plus a private outdoor patio perfect for relaxing or entertaining. Convenient off-street parking adds privacy and ease. Located close to shopping, dining, parks, and major routes. centers. This Manufactured Home features a central air system for efficient year-round comfort, and a remodeled bathroom with modern finishes. A great opportunity for low-maintenance living in a well-kept community.
-
2025-12-05$62,000 Active 506-char remark
Show marketing remark (506 chars)
MLS# 289253 Well maintained and move-in ready home in a prime location! Enjoy a bright and welcoming interior, plus a private outdoor patio perfect for relaxing or entertaining. Convenient off-street parking adds privacy and ease. Located close to shopping, dining, parks, and major routes. centers. This Manufactured Home features a central air system for efficient year-round comfort, and a remodeled bathroom with modern finishes. A great opportunity for low-maintenance living in a well-kept community.
-
2023-10-06soldstatus $55,000 Closed 497-char remark
Show marketing remark (497 chars)
MLS# 270883 Beautiful, well kept home in a 55+ community park. Open living room and kitchen with several upgrades. New laminate flooring, black top driveway, landscaping, ugs sprinklers, water heater, and gutters are all recent additions. The heating/air unit and roof were replaced in 2020. Very quiet living with a covered porch with ramp and two outdoor sheds for storage . All appliances stay with the house. Close to shops, restaurants, and parks. Call your favorite realtor to see it today!
-
2023-09-13historical Active Under Contract 497-char remark
Show marketing remark (497 chars)
MLS# 270883 Beautiful, well kept home in a 55+ community park. Open living room and kitchen with several upgrades. New laminate flooring, black top driveway, landscaping, ugs sprinklers, water heater, and gutters are all recent additions. The heating/air unit and roof were replaced in 2020. Very quiet living with a covered porch with ramp and two outdoor sheds for storage . All appliances stay with the house. Close to shops, restaurants, and parks. Call your favorite realtor to see it today!
-
2023-08-30$68,500 Active 497-char remark
Show marketing remark (497 chars)
MLS# 270883 Beautiful, well kept home in a 55+ community park. Open living room and kitchen with several upgrades. New laminate flooring, black top driveway, landscaping, ugs sprinklers, water heater, and gutters are all recent additions. The heating/air unit and roof were replaced in 2020. Very quiet living with a covered porch with ramp and two outdoor sheds for storage . All appliances stay with the house. Close to shops, restaurants, and parks. Call your favorite realtor to see it today!
-
2015-11-19soldstatus $10,000
-
2015-10-19$10,000
-
2015-01-31soldstatus $10,000
-
2014-10-31$10,000
ⓘ Source: listings_history table (triggers on properties + properties_extension) + one-shot
backfill from property_details.listing_events for pre-trigger history.
Tax reassessment forecast WA · Resets to sale price
- Current annual tax
- $139 · $12/mo
- Projected year-2 tax
- $588 · $49/mo
- Expected delta
- +$449/yr (+$37/mo · 323.6%)
ⓘ Screening estimate from a state-policy table — verify with the county assessor before closing.
Climate risk First Street
- Flood 1/10 Low 0% chance over 30 yrs
- Wildfire 4/10 Moderate
- Heat 5/10 Major 7 d/yr ≥98°F today · 14 d/yr by 30 yrs out
- Wind 1/10 Low
- Air quality 8/10 Severe 14 unhealthy d/yr today · 15 by 30 yrs out
Nearby sold comps map
Loading sold comps map…
Walkable amenities ~0.75 mi
Loading nearby amenities…
Taxation est. · year 1
- Rental income
- $20,860
- − Mortgage interest
- −$3,361
- − Property taxes
- −$139
- − Insurance
- −$300
- − Repairs & maintenance
- −$1,669
- − Management
- −$1,669
- − Depreciation
- −$1,745
- Taxable income
- $11,978
- Est. tax owed @ 24.0%
- −$2,875
- After-tax cash flow
- $9,391/yr
For passive investors: Depreciation is non-cash, so a rental often shows a tax loss while cash-flowing — sheltering income. Rental losses are passive: they offset passive income freely, and up to $25,000/yr can offset ordinary (W-2) income if you actively participate and your MAGI is under $100k (phasing out to $0 by $150k); unused losses carry forward. On sale, claimed depreciation is recaptured at up to 25%, and gains may owe capital-gains tax (a 1031 exchange can defer both). Figures are a year-1 estimate at your 24.0% rate — not tax advice; consult a CPA.
Schools (NCES district)
- District
- Kennewick School District
- NCES district ID
- 5303930
- Math proficiency
- 43% ▼ -1.00%
- Reading proficiency
- 58% ▬ 0.00%
- Median HH income
- $54,191
- Composite
- 45.56/100
- National rank
- #5667
- State rank
- #141 of 291 in WA
Livability — Kennewick
- Score
- 78/100
- State rank
- #131
- US rank
- #2599
Category grades
Schools grade is shown separately in the Schools card above.
Census & demographics
- Census place
- Kennewick, WA
- County
- Benton County · 186,895 people
- City population
- 104,655
- Metro
- Kennewick-Richland, WA
- Population (ZIP)
- 50,735
- Household income
- $62,527
- Rent vs Own
- Severe rent burden
- 2605.0
Population outlook (Benton County) Hauer SSP2
- Today (2025)
- 219,421 people
- By 2030
- 233,813 · +6.6%
- By 2040
- 262,134 · +19.5%
- By 2050
- 290,100 · +32.2%
- By 2075
- 363,525 · +65.7%
- By 2100
- 418,667 · +90.8%
Race, ethnicity, and origin ACS 2023
- Neighborhood character
- Diverse neighborhood (Simpson 0.56)
- Race & ethnicity
- White 55% Hispanic / Latino 37% Two or more races 15% Black 3% Asian 2% Native American 1%
- Hispanic origin (detail)
- Mexican 31% Cuban 2%
- Common ancestry
- Portuguese 4% Slovak 3% Romanian 1%
- Foreign-born
- 16% · Canada, Jamaica
- Languages at home
- 68% English-only · Spanish 29% Arabic 1%
Political lean MEDSL · Benton
- 2024 margin
- Strong R (+21.9) · D 37.7% · R 59.6% · Other 2.7%
- 2008→2024 swing
- +4.2pp toward D · 2008: -26.1pp · 2024: -21.9pp
- All cycles
- 2024: R+21.9 2020: R+21.0 2016: R+26.6 2012: R+27.0 2008: R+26.1
Not yet ingested
- Civics
- —
Market trends
- HPI YoY
- ▼ -408.26%
- Current HPI
- 256.1143
- Rent YoY
- ▲ 3.39%
- Metro
- Kennewick-Richland, WA
- State GDP YoY
- ▲ 4.65%
- F500 in state
- 22
Industry mix (Fortune 500 HQ in WA)
| Industry | F500 HQs | Revenue |
|---|---|---|
| Retail | 2 | $269B |
|
||
| Technology / Retail | 1 | $638B |
|
||
| Technology | 1 | $245B |
|
||
| Telecommunications | 1 | $38B |
|
||
| Food / Beverage | 1 | $36B |
|
||
| Automotive / Trucks | 1 | $34B |
|
||
Price history
+500.0% since first listed9 events — show timeline
- 2026-03-20 Price Changed $59,999 PACMLS
- 2025-12-05 Listed $62,000 PACMLS
- 2023-10-06 Sold (MLS) $55,000 PACMLS
- 2023-09-13 Contingent — PACMLS
- 2023-08-30 Listed $68,500 PACMLS
- 2015-11-19 Sold (MLS) $10,000 PACMLS
- 2015-10-19 Listed $10,000 PACMLS
- 2015-01-31 Sold (MLS) $10,000 PACMLS
- 2014-10-31 Listed $10,000 PACMLS
Property tax history
+5.9%/yrLatest (2026): $139 · -5.7% YoY. Source: county tax records.
Cash-flow waterfall
monthlySold comps — $/sqft
last 12 mo · ≤1 miLoading sold comps…