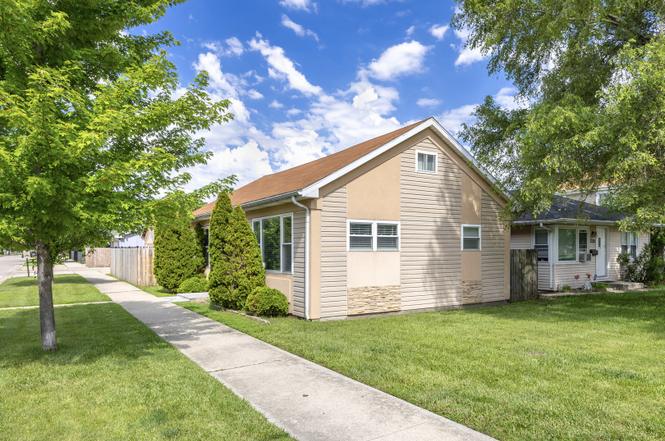
1700 N 37th Ave · Stone Park, IL
Flood risk 8/10 · Major
- FEMA flood zone
- X (shaded)
- Chance of flooding over 30 yrs
- 0.99%
- Est. flood insurance / yr
- $473 – $860
Fire risk 1/10 · Minimal
- Est. fire insurance / yr
- $804 – $1,492
Heat risk 3/10 · Minor
- Hot days now (above 100°F)
- 7 days/yr
- Hot days in 30 yrs
- 14 days/yr
Wind risk 2/10 · Minimal
- Chance of severe wind over 30 yrs
- 0.0%
Air-quality risk 4/10 · Minor
- Unhealthy air days now
- 6 days/yr
- Unhealthy air days in 30 yrs
- 7 days/yr
Risk factors via First Street. Map © Google.
Why this score? — see what drove the F grade
The composite is a weighted blend of 9 inputs, each scored 0–100. Each bar is that input's sub-score; the figure is the points it added to the 100-point composite (weight × sub-score).
- Appreciation +8.3/10.0
- ARV discount +7.5/15.0
- Livability +4.1/5.0
- Cash flow +2.9/30.0
- Rent growth +2.5/5.0
- Condition / age +2.5/5.0
- Schools +1.4/10.0
- 1% rule +0.2/10.0
- DSCR +0.0/10.0
$300,000
🖨 Deal sheet (PDF) 📄 Offer letter ✓ Due diligence
Listing remarks MLS
Beautiful House in Stone Park. Home Features 4 Bedrooms and 2 Baths. In Great Condition But Selling in As Condition.
Key facts
- Master suite
- Expansive kitchen
- Top dining
Tags
Property features AI
Finance
- HOA & community: No master association fee required; Neighborhood sidewalks and street lights
Exterior
- Parking: Detached garage (garage owned) with garage door opener; Approximately 2.5 garage/total parking spaces
- Utilities: Lake Michigan water; Public sewer
- Home design: Detached single-family home; Two-story residence; Fee simple ownership; Not currently leased; Built before 1978
- Construction: Vinyl siding; Asphalt roof
- Exterior features: Fenced yard; Corner lot (30 x 125)
Interior
- Kitchen: Kitchen with eating area/table space (11 x 11); Range; Microwave; Dishwasher; Refrigerator
- Bedrooms: Master bedroom on the main level (12 x 12) with full bath access; Bedroom on main level (11 x 10); Two bedrooms on second level (each 14 x 13)
- Flooring: Hardwood flooring in living room and master bedroom; Laminate flooring in two second-floor bedrooms; Ceramic tile in kitchen
- Bathrooms: Two full bathrooms
- Heating & cooling: Natural gas heating; Central air conditioning
- Interior features: First-floor bedroom; Storm door(s); Finished full attic; Six total rooms
- Laundry & utility: Main-level laundry with gas dryer hookup, in-unit laundry in a laundry closet (6 x 7); Washer; Dryer
Neighborhood map
What this means for you Summary
Snapshot
- This is a 2-bed/1.0-bath single-family listed at $300k.
Deal economics
- At list price, monthly cash flow is $-1k ($-13k/yr) — negative.
- To cash-flow at today's rent, offer at most $124k (58.5% below list).
- To meet the 1% rule (rent ≥ 1% of price), the offer needs to be $156k (48.1% below list).
- Recommended offer: $124k (58.5% below list) — sets the bar for cash-flow.
Location & tenants
- Location reads 82/100 on livability (#68 in IL, #1,121 nationally) — a professional / high-income tenant draw. Strengths: crime A+, commute A+, cost of living A+; Watch: amenities D+, health & safety D+, schools F.
- Proviso Twp Hsd 209 (suburban): math 12% / reading 17% proficiency, ranked #507 of 620 in IL (top 82%) — low school quality limits family demand, transient renter base, plan for 1-2y turnover.
- Market conditions: 7 active listings in the ZIP; 14 comparable units currently listed for rent nearby; rentals at typical pace (median 20d on market — plan ~3-4 weeks tenant-placement turnaround); 6,272 units permitted in Cook County in 2024 (4,658 in 5+ unit buildings).
Forward outlook
- In year one you build about $22k of equity ($2k loan paydown + $20k appreciation (6.7% local appreciation)).
- By year 2, paydown + projected appreciation supports a ~$35k cash-out refi (75% LTV) — recoverable capital for the next deal without selling this one.
Negotiation context
- Only 4 days on market — expect competitive offers; lowballing is unlikely to land.
- 2 sale attempts since 6y ago with the ask held roughly flat each time — persistent listings suggest the price (not the market) is what's stuck; bring a comps-based counter.
- Current owner paid $207k; 45% above their basis — modest negotiation headroom, anchor on the comps not their cost.
Risks & watch-outs
- Watch-outs: flood insurance adds $56/mo; built in 1954 — expect roof / HVAC / electrical / plumbing capex.
- Climate carrying-cost: severe flood risk — expect insurance premiums to compound above CPI over the hold.
Questions for the listing agent
- What do current leases actually rent for vs. the listed asking? Can we see a recent rent roll and the last 12 months of T-12 income?
- Built in 1954 — when were the roof, HVAC, electrical panel, plumbing, and water heater last replaced?
- What's the actual annual flood-insurance premium (NFIP or private), and is the property in a SFHA with mandatory coverage?
- Is there a deadline driving the sale (1031 exchange, divorce, estate, relocation)? That informs how much negotiation room exists.
- Schools are F-rated, which usually means shorter tenancies and higher turnover. Who's the typical renter profile here, and what's been the actual vacancy rate?
- The area grade is low — what's the realistic commute time and amenity access for the typical tenant pool here? Any planned neighborhood developments (good or bad) we should know about?
- What's the average days-on-market for RENTAL listings here right now (not sales)? A rising rental-DOM trend means longer vacancies and softer asking-rent achievability than the comps imply.
- What's the recent tenant-quality profile in this submarket — average credit score on applications, eviction rate, late-payment / NSF rate, and stable-employment percentage? A property-management company in the area should have these aggregated.
- How much new for-sale + rental construction is in the pipeline within 1–3 miles? Heavy new supply typically softens prices + rents 12–24 months out; constrained supply supports both.
Investment metrics
- 1% rule
- 0.52% ✗
- Cap rate
- 2.34%
- Cash-on-cash
- -14.11%
- DSCR
- 0.37
- GRM
- 16.1
CMA / ARV
- ARV (on-the-fly)
- $148,608
- Comps found
- 5
Show comp detail 5 sales within ~0.75 mi
| Address | Dist | Beds/Ba | Sqft | Sold | Price | $/sf | Match |
|---|---|---|---|---|---|---|---|
| 1722 N 36th Ave | 0.09mi | 3/1.0 (+1) | 924 (+7%) | 0mo | $170,000 | $184 | 79 |
| 1813 N 40th Ave | 0.24mi | 2/1.0 | 888 (+3%) | 14mo | $150,000 | $169 | 73 |
| 401 E Lemoyne St | 0.49mi | 2/1.0 | 896 (+4%) | 2mo | $130,000 | $145 | 69 |
| 1528 N 39th Ave | 0.36mi | 3/1.0 (+1) | 924 (+7%) | 0mo | $320,000 | $346 | 66 |
| 1614 N 34th Ave | 0.20mi | 3/1.0 (+1) | 783 (-9%) | 16mo | $135,000 | $172 | 57 |
Match score weights: distance 35% · size 25% · config 20% · recency 20%. Top-matched comps best support the ARV.
Projected returns pro-forma
6.65% appreciation · 3.0% rent growth · sell at horizon
- IRR
- 5.4%
- Equity multiple
- 1.38×
- Total profit
- $31,944
- Equity at exit
- $200,944
- IRR
- 7.7%
- Equity multiple
- 2.71×
- Total profit
- $143,661
- Equity at exit
- $375,572
Cash invested: $84,000 (down + closing). Projections, not guarantees.
Landlord ↔ Tenant lean methodology
- Overall (STATE)
- 43 Moderately Tenant-Leaning
- State Illinois
- 43 Moderately Tenant-Leaning · D+7
- County
- — inherits STATE
- City
- — inherits STATE
ZIP-level market 60165
- Home prices YoY
- 2.4%
- Active inventory
- 7
- Price-to-rent
- 16.1×
Monthly cashflow live
- Estimated rent
- $1,556 high interval (Pro) →
- Mortgage (P&I)
- −$1,573
- Tax from tax record
- −$519 /mo · $6,223/yr
- Insurance
- −$125
- Flood insurance flood zone
- −$56 /mo · $666/yr
- HOA
- −$0
- Vacancy / Maint / Mgmt
- −$327
- Net cashflow
- $-1,043
Break-even live
Sensitivity live
| Price | -10% $-873 | -5% $-958 | +0% $-1,043 | +5% $-1,128 | +10% $-1,213 |
|---|---|---|---|---|---|
| Rent | -10% $-1,166 | -5% $-1,104 | +0% $-1,043 | +5% $-982 | +10% $-920 |
| Rate | -1.0pp $-892 | -0.5pp $-967 | base $-1,043 | +0.5pp $-1,121 | +1.0pp $-1,200 |
UW: 25.0% down · 7.5% · 30yr · 1.5% tax · 5.0% vac · 8.0% maint · 8.0% mgmt
Financing live
Cash to close
- Down payment
- $75,000
- Closing costs
- $9,000
- Reserves months
- —
- Total cash needed
- —
Loan-product check · same deal, 3 products live
Conventional
25% down · 7.5% · 30yr
- Down + closing
- —
- Monthly P&I
- —
- Monthly cashflow
- —
- DSCR
- —
- Eligible?
- —
Personal DTI + credit; lowest rate.
DSCR
20% down · 8.5% · 30yr
- Down + closing
- —
- Monthly P&I
- —
- Monthly cashflow
- —
- DSCR
- —
- Eligible?
- —
No personal income docs; deal must DSCR.
Hard money
10% down · 12.0% · 12mo
- Down + closing
- —
- Monthly P&I
- —
- Monthly cashflow
- —
- DSCR
- —
- Eligible?
- —
Short-term bridge; refi at stabilization.
Rent comps 14 comps
| Address | Beds | Baths | Sqft | Rent | $/sqft | DOM | Units | Dist |
|---|---|---|---|---|---|---|---|---|
| 1500 N 22nd Ave Apt B2 Melrose Park, IL | 1.0 | 1.0 | 575 | $1,350 | $2.35 | 0d | 1 | 0.96mi |
| 1971 N 19th Ave Apt 6 Melrose Park, IL | 2.0 | 1.0 | 800 | $1,700 | $2.12 | 25d | 1 | 1.24mi |
| 3108 Saint Charles Rd Unit 2B Bellwood, IL | 2.0 | 1.0 | 750 | $1,550 | $2.07 | 25d | 1 | 1.25mi |
| 3108 Saint Charles Rd Unit 1B Bellwood, IL | 1.0 | 1.0 | 650 | $1,250 | $1.92 | 3d | 1 | 1.25mi |
| 12 23rd Ave Melrose Park, IL | 2.0 | 1.0 | 850 | $1,775 | $2.09 | 13d | 1 | 1.26mi |
| 12 23rd Ave Melrose Park, IL | 2.0 | 1.0 | 850 | $1,775 | $2.09 | 21d | 1 | 1.26mi |
| 1970 N 18th Ave Melrose Park, IL | 1.0 | 1.0 | 675 | $1,320 | $1.96 | 11d | 2 | 1.27mi |
| 1973 N 18th Ave Melrose Park, IL | 2.0 | 1.0 | 1000 | $1,750 | $1.75 | 25d | 1 | 1.30mi |
| 1618 Division St Unit 3 Melrose Park, IL | 1.0 | 1.0 | 750 | $1,545 | $2.06 | 18d | 1 | 1.31mi |
| 2054 N 18th Ave Unit C4 Melrose Park, IL | 1.0 | 1.0 | 800 | $1,250 | $1.56 | 0d | 1 | 1.36mi |
| 1419 N 16th Ave Melrose Park, IL | 2.0 | 1.0 | 1000 | $1,650 | $1.65 | 0d | 1 | 1.37mi |
| 2069 N 18th Ave Unit 1 Melrose Park, IL | 2.0 | 1.0 | 800 | $1,595 | $1.99 | 25d | 1 | 1.40mi |
| 2069 N 18th Ave Unit 2 Melrose Park, IL | 1.0 | 1.0 | 700 | $1,355 | $1.94 | 19d | 1 | 1.40mi |
| 312 23rd Ave Unit 2 Bellwood, IL | 2.0 | 1.0 | 850 | $1,775 | $2.09 | 21d | 1 | 1.47mi |
Listing history 3 events
-
2026-06-21days on market $300,000 Active 4 DOM
-
2026-06-18remarks 699-char remark
-
2026-06-18$300,000 Active 1 DOM
ⓘ Source: listings_history table (triggers on properties + properties_extension) + one-shot
backfill from property_details.listing_events for pre-trigger history.
Tax reassessment forecast IL · Partial reset (capped growth)
- Current annual tax
- $6,223 · $519/mo
- Projected year-2 tax
- $6,516 · $543/mo
- Expected delta
- +$294/yr (+$24/mo · 4.7%)
ⓘ Screening estimate from a state-policy table — verify with the county assessor before closing.
Climate risk First Street
- Flood 8/10 Severe FEMA zone X (shaded) · 99% chance over 30 yrs
- Wildfire 1/10 Low
- Heat 3/10 Moderate 7 d/yr ≥100°F today · 14 d/yr by 30 yrs out
- Wind 2/10 Low 0% chance of damaging wind over 30 yrs
- Air quality 4/10 Moderate 6 unhealthy d/yr today · 7 by 30 yrs out
Nearby sold comps map
Loading sold comps map…
Walkable amenities ~0.75 mi
Loading nearby amenities…
Taxation est. · year 1
- Rental income
- $18,673
- − Mortgage interest
- −$16,805
- − Property taxes
- −$6,223
- − Insurance
- −$2,166
- − Repairs & maintenance
- −$1,494
- − Management
- −$1,494
- − Depreciation
- −$8,727
- Taxable loss
- −$18,235
- Est. tax savings @ 24.0%
- +$4,377
- After-tax cash flow
- $-8,139/yr
For passive investors: Depreciation is non-cash, so a rental often shows a tax loss while cash-flowing — sheltering income. Rental losses are passive: they offset passive income freely, and up to $25,000/yr can offset ordinary (W-2) income if you actively participate and your MAGI is under $100k (phasing out to $0 by $150k); unused losses carry forward. On sale, claimed depreciation is recaptured at up to 25%, and gains may owe capital-gains tax (a 1031 exchange can defer both). Figures are a year-1 estimate at your 24.0% rate — not tax advice; consult a CPA.
Schools (NCES district)
- District
- Proviso Twp Hsd 209
- NCES district ID
- 1732910
- Math proficiency
- 12% ▼ -4.00%
- Reading proficiency
- 17% ▼ -3.00%
- Median HH income
- $51,744
- Composite
- 13.5/100
- National rank
- #9518
- State rank
- #507 of 620 in IL
Livability — Stone Park
- Score
- 82/100
- State rank
- #68
- US rank
- #1121
Category grades
Schools grade is shown separately in the Schools card above.
Census & demographics
- Census place
- Stone Park, IL
- City population
- 4,504
- Population (ZIP)
- 4,504
Population outlook (Cook County) Hauer SSP2
- Today (2025)
- 5,347,519 people
- By 2030
- 5,357,703 · +0.2%
- By 2040
- 5,324,924 · -0.4%
- By 2050
- 5,230,762 · -2.2%
- By 2075
- 4,785,735 · -10.5%
- By 2100
- 4,188,836 · -21.7%
Race, ethnicity, and origin ACS 2023
- Neighborhood character
- Predominantly Hispanic (93%)
- Race & ethnicity
- Hispanic / Latino 93% Two or more races 28% White 4% Native American 2% Black 2%
- Hispanic origin (detail)
- Mexican 85% Puerto Rican 5%
- Foreign-born
- 41% · Canada
- Languages at home
- 16% English-only · Spanish 82% Other Asian/Pacific 2%
Political lean MEDSL · Cook
- 2024 margin
- Solid D (+42.0) · D 70.4% · R 28.4% · Other 1.2%
- 2008→2024 swing
- -11.4pp toward R · 2008: 53.4pp · 2024: 42.0pp
- All cycles
- 2024: D+42.0 2020: D+50.3 2016: D+53.0 2012: D+49.4 2008: D+53.4
Not yet ingested
- Civics
- —
Market trends
- HPI YoY
- ▲ 6.65%
- Current HPI
- 282.2554
- Rent YoY
- —
- Metro
- —
- State GDP YoY
- ▲ 1.59%
- F500 in state
- 60
Industry mix (Fortune 500 HQ in IL)
| Industry | F500 HQs | Revenue |
|---|---|---|
| Insurance | 4 | $201B |
|
||
| Consumer Goods | 4 | $87B |
|
||
| Industrial Machinery | 3 | $64B |
|
||
| Healthcare | 2 | $55B |
|
||
| Retail / Pharmacy | 1 | $148B |
|
||
| Agriculture / Food | 1 | $86B |
|
||
Price history
+130.8% since first listed5 events — show timeline
- 2026-06-17 Listed $300,000 MRED as Distributed by MLS Grid
- 2020-09-24 Sold (MLS) $206,900 MRED as Distributed by MLS Grid
- 2020-07-19 Pending — MRED as Distributed by MLS Grid
- 2020-07-15 Listed $204,900 MRED as Distributed by MLS Grid
- 2005-05-19 Sold (Public Records) $130,000 Public Records
Property tax history
+6.8%/yrLatest (2023): $6,223 · +133.2% YoY. Source: county tax records.
Cash-flow waterfall
monthlySold comps — $/sqft
last 12 mo · ≤1 miLoading sold comps…