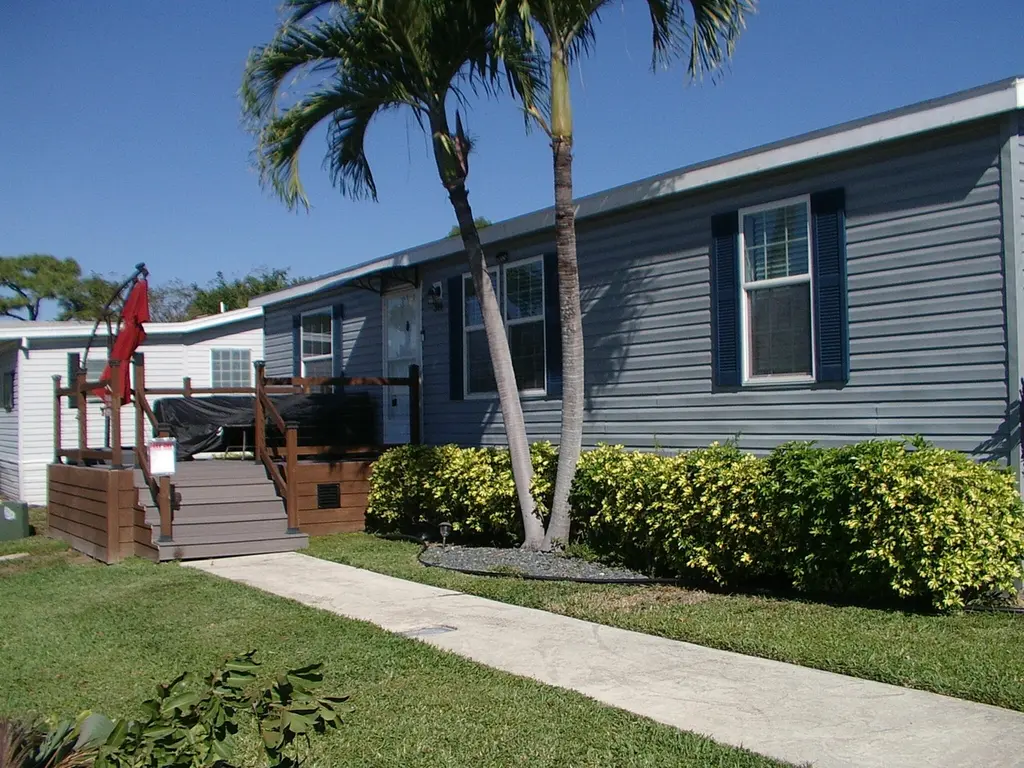
2555 Pga Blvd #314 · Palm Beach Gardens, FL
Flood risk 5/10 · Moderate
- FEMA flood zone
- X (shaded)
- Chance of flooding over 30 yrs
- 0.24%
- Est. flood insurance / yr
- $507 – $1,088
Fire risk 1/10 · Minimal
- Est. fire insurance / yr
- $947 – $1,759
Heat risk 10/10 · Severe
- Hot days now (above 106°F)
- 7 days/yr
- Hot days in 30 yrs
- 25 days/yr
Wind risk 10/10 · Severe
- Chance of severe wind over 30 yrs
- 99.0%
Air-quality risk 2/10 · Minimal
- Unhealthy air days now
- 0 days/yr
- Unhealthy air days in 30 yrs
- 1 days/yr
Risk factors via First Street. Map © Google.
Why this score? — see what drove the B grade
The composite is a weighted blend of 9 inputs, each scored 0–100. Each bar is that input's sub-score; the figure is the points it added to the 100-point composite (weight × sub-score).
- Cash flow +30.0/30.0
- 1% rule +10.0/10.0
- DSCR +10.0/10.0
- ARV discount +7.5/15.0
- Schools +4.3/10.0
- Condition / age +4.0/5.0
- Livability +3.5/5.0
- Rent growth +3.1/5.0
- Appreciation +0.0/10.0
$115,000
🖨 Deal sheet 📄 Offer letter ✓ Due diligence
Listing remarks
Motivated seller, vacant easy to show, call for appointment Totally redone all brand new inside, all ages community very nice amenities including resort style pool gym kids playground shuffleboard putting greens basketball game room This home is renovated modern upgrades throughout luxury vinyl floor, three bedrooms two bathrooms. . all ages community nice amenities
Key facts
- 0.41 acre lot
- 2 parking spots
- Built 2011
Property features AI
Finance
- Financial info: Pets allowed (size limits may apply)
- HOA & community: Community clubhouse; Playground; Shuffleboard court; Heated pool; HOA with monthly fee (fee covers cable TV, sewer, trash, water)
Exterior
- Parking: Assigned parking; Detached carport; Carport with 1 covered space; 2 open parking spaces (2 total)
- Utilities: Public water; Public sewer; Cable available
- Home design: Manufactured home; Double wide; Single-story
- Construction: Vinyl siding; Shingle roof
- Exterior features: Not on the waterfront
Interior
- Kitchen: Refrigerator included
- Bedrooms: 3 bedrooms on the main level
- Flooring: Laminate flooring
- Bathrooms: 2 full bathrooms
- Heating & cooling: Central heating; Central air conditioning
- Interior features: Vaulted ceilings; Split bedroom layout
- Laundry & utility: In-unit laundry
Neighborhood map
What this means for you Summary
Snapshot
- This is a 3-bed/2.0-bath manufactured listed at $115k. Condition is rated good.
Deal economics
- At list price, monthly cash flow is $534 ($6k/yr) — positive.
- The deal already cash-flows at list — no discount required.
- Meets the 1% rule at list price ($4k rent vs $115k).
- Recommended offer: $108k (6.0% below list) — sets the bar for market timing.
Location & tenants
- Location reads 69/100 on livability (#464 in FL) — a middle-class / working-renter tenant base. Strengths: crime A+, employment A+, housing A+; Watch: amenities F, commute F, cost of living F.
- Palm Beach (suburban): math 46% / reading 53% proficiency, ranked #34 of 73 in FL (top 47%) — families likely to look elsewhere, expect single-tenant / working-renter base with shorter leases.
- Zoned schools: Dwight D. Eisenhower Elementary School (math 52% / reading 52%, grade C-, #990 of 2,144 statewide, top 48%, 432 students, 56% FRL); Howell L. Watkins Middle School (math 18% / reading 33%, grade F, #512 of 571 statewide, top 90%, 794 students, 76% FRL); William T. Dwyer High School (math 36% / reading 58%, grade D-, #207 of 667 statewide, top 32%, 2,206 students, 37% FRL) — zoned schools at 57% FRL track the district average.
- Market conditions: Rents rising (+2.5%/yr); 303 active listings in the ZIP; 40 comparable units currently listed for rent nearby; rentals at typical pace (median 24d on market — plan ~3-4 weeks tenant-placement turnaround); solid renter incomes; 3,974 units permitted in Palm Beach County in 2024 (1,012 in 5+ unit buildings).
- At $3,676/mo this rent would consume 47% of the median local household income ($95k/yr) (locally 1429% of renters already pay >50% of income on rent) — very limited rent-growth headroom before tenants either downsize or default.
Forward outlook
- Local home prices are declining (-3.0%/yr); year-one equity from $795 of loan paydown is wiped out by about $3k of value loss. Plan a longer hold.
- Palm Beach County population projected at +30% by 2050 — long-run rental-demand tailwind backs the buy-and-hold thesis.
- At projected returns (-3.0% appreciation + 2.5% rent growth), your $32k cash investment doubles in ~7 years — after that, you're playing with house money.
Negotiation context
- It's been on market 86 days — a 6% lower offer ($108k) is reasonable based on typical stale-listing flexibility.
- 3 sale attempts since 4y ago; this cycle's ask has dropped $10k (8%) from the opening price — seller is motivated, your offer sets the floor, not the list.
Risks & watch-outs
- Watch-outs: HOA is 43% of rent.
- Climate carrying-cost: moderate flood risk; severe wind risk, 99% chance of damaging wind over 30y; extreme-heat days projected 7→25/yr by 2055 (HVAC capex compounding) — expect insurance premiums to compound above CPI over the hold.
Questions for the listing agent
- It's been on market 86 days. Have you received any prior offers? Is the seller open to a 6% concession, seller financing, or rate buy-down credit?
- What does the HOA fee cover, when was the last increase, and are there any pending special assessments or reserve-fund shortfalls?
- Why hasn't it sold? Are there any deal-killer items the seller is aware of (foundation, flood, title, zoning, code violations)?
- Is there a deadline driving the sale (1031 exchange, divorce, estate, relocation)? That informs how much negotiation room exists.
- Schools are B-rated — typically a magnet for longer-tenancy family renters. What's the average tenant stay here, and is there a school-zone premium baked into asking?
- What's the average days-on-market for RENTAL listings here right now (not sales)? A rising rental-DOM trend means longer vacancies and softer asking-rent achievability than the comps imply.
- What's the recent tenant-quality profile in this submarket — average credit score on applications, eviction rate, late-payment / NSF rate, and stable-employment percentage? A property-management company in the area should have these aggregated.
- How much new for-sale + rental construction is in the pipeline within 1–3 miles? Heavy new supply typically softens prices + rents 12–24 months out; constrained supply supports both.
Investment metrics
- 1% rule
- 3.20% ✓
- Cap rate
- 11.87%
- Cash-on-cash
- 19.92%
- DSCR
- 1.89
- GRM
- 2.6
CMA / ARV
No comps found within radius.
Projected returns pro-forma
-3.0% appreciation · 2.49% rent growth · sell at horizon
- IRR
- 11.5%
- Equity multiple
- 1.45×
- Total profit
- $14,553
- Equity at exit
- $17,147
- IRR
- 20.1%
- Equity multiple
- 2.65×
- Total profit
- $53,042
- Equity at exit
- $9,943
Cash invested: $32,200 (down + closing). Projections, not guarantees.
Landlord ↔ Tenant lean methodology
- Overall (STATE)
- 87 Strongly Landlord-Friendly
- State Florida
- 87 Strongly Landlord-Friendly · R+3
- County
- — inherits STATE
- City
- — inherits STATE
ZIP-level market 33410
- Rents YoY
- 2.5%
- Active inventory
- 303
- Price-to-rent
- 2.6×
Monthly cashflow live
- Estimated rent
- $3,676 high interval (Pro) →
- Mortgage (P&I)
- −$603
- Tax est. 1.5%
- −$144 /mo · $1,725/yr
- Insurance
- −$48
- HOA
- −$1,575
- Vacancy / Maint / Mgmt
- −$772
- Net cashflow
- $534
Break-even live
UW: 25.0% down · 7.5% · 30yr · 1.5% tax · 5.0% vac · 8.0% maint · 8.0% mgmt
Financing live
Cash to close
- Down payment
- $28,750
- Closing costs
- $3,450
- Reserves months
- —
- Total cash needed
- —
Loan-product check · same deal, 3 products live
Conventional
25% down · 7.5% · 30yr
- Down + closing
- —
- Monthly P&I
- —
- Monthly cashflow
- —
- DSCR
- —
- Eligible?
- —
Personal DTI + credit; lowest rate.
DSCR
20% down · 8.5% · 30yr
- Down + closing
- —
- Monthly P&I
- —
- Monthly cashflow
- —
- DSCR
- —
- Eligible?
- —
No personal income docs; deal must DSCR.
Hard money
10% down · 12.0% · 12mo
- Down + closing
- —
- Monthly P&I
- —
- Monthly cashflow
- —
- DSCR
- —
- Eligible?
- —
Short-term bridge; refi at stabilization.
Rent comps 40 comps
| Address | Beds | Baths | Sqft | Rent | $/sqft | DOM | Units | Dist |
|---|---|---|---|---|---|---|---|---|
| 2727 Anzio Ct #106 Palm Beach Gardens, FL | 3.0 | 2.0 | 1316 | $3,000 | $2.28 | 24d | 1 | 0.19mi |
| 2813 Grande Pkwy #109 Palm Beach Gardens, FL | 3.0 | 2.0 | 1278 | $2,818 | $2.21 | 24d | 1 | 0.24mi |
| 2805 Veronia Dr Palm Beach Gardens, FL | 3.0 | 2.0 | 1361 | $3,000 | $2.20 | 24d | 1 | 0.31mi |
| 2802 Sarento Pl #204 Palm Beach Gardens, FL | 2.0 | 2.0 | 1092 | $3,500 | $3.21 | 24d | 1 | 0.32mi |
| 2395 Idlewild Rd Palm Beach Gardens, FL | 3.0 | 2.0 | 1476 | $4,500 | $3.05 | 22d | 1 | 0.35mi |
| 2916 Tuscany Ct Palm Beach Gardens, FL | 3.0 | 2.0 | 1278 | $2,818 | $2.21 | 24d | 1 | 0.38mi |
| 2916 Tuscany Ct #201 Palm Beach Gardens, FL | 2.0 | 2.0 | 1149 | $3,200 | $2.79 | 3d | 1 | 0.38mi |
| 2388 S Wallen Dr West Palm Beach, FL | 3.0 | 2.0 | 1296 | $4,500 | $3.47 | 24d | 1 | 0.40mi |
| 2396 Easy St Unit A Palm Beach Gardens, FL | 2.0 | 1.0 | 948 | $3,500 | $3.69 | 24d | 1 | 0.54mi |
| 3270 Grove Rd Unit 1326860P Palm Beach Gardens, FL | 3.0 | 2.0 | 1496 | $5,047 | $3.37 | 7d | 1 | 0.74mi |
| 2100 PGA Blvd Palm Beach Gardens, FL | 1.0–3.0 | 1.0–2.0 | 1044 | $3,509 | $3.36 | 1d | 10 | 0.83mi |
| 12015 Colony Ave Palm Beach Gardens, FL | 3.0 | 2.0 | 1104 | $3,100 | $2.81 | 22d | 1 | 0.86mi |
| 12015 Colony Ave Palm Beach Gardens, FL | 3.0 | 2.0 | 1104 | $3,100 | $2.81 | 24d | 1 | 0.86mi |
| 700 Sanctuary Cove Dr West Palm Beach, FL | 1.0–3.0 | 1.0–2.0 | 1120 | $3,167 | $2.83 | 1d | 55 | 0.99mi |
| 11021 Legacy Ln #303 Palm Beach Gardens, FL | 2.0 | 2.0 | 1403 | $2,950 | $2.10 | 24d | 1 | 1.00mi |
| 49 Uno Lago Dr Juno Beach, FL | 2.0 | 2.5 | 1494 | $5,500 | $3.68 | 24d | 1 | 1.00mi |
| 11023 Legacy Ln #204 Palm Beach Gardens, FL | 2.0 | 2.0 | 1309 | $3,500 | $2.67 | 24d | 1 | 1.01mi |
| 1869 Circle Dr North Palm Beach, FL | 2.0 | 2.0 | 1216 | $3,400 | $2.80 | 12d | 1 | 1.01mi |
| 1718 Ridge Rd North Palm Beach, FL | 2.0 | 2.0 | 900 | $2,950 | $3.28 | 24d | 1 | 1.01mi |
| 827 Oak Harbour Dr Juno Beach, FL | 2.0 | 2.0 | 1301 | $4,200 | $3.23 | 24d | 1 | 1.03mi |
| 11011 Legacy Dr #306 Palm Beach Gardens, FL | 2.0 | 2.0 | 1403 | $4,350 | $3.10 | 24d | 1 | 1.07mi |
| 11900 Valencia Gardens Ave Palm Beach Gardens, FL | 1.0–3.0 | 1.0–2.0 | 980 | $3,002 | $3.06 | 1d | 18 | 1.07mi |
| 10201 Chapman Oak Ct Palm Beach Gardens, FL | 2.0 | 2.0 | 1152 | $4,000 | $3.47 | 24d | 1 | 1.08mi |
| 3745 Atlantic Rd Unit 3745 Palm Beach Gardens, FL | 4.0 | 2.0 | 1119 | $2,900 | $2.59 | 24d | 1 | 1.08mi |
| 11521 Landing Pl Unit E1 North Palm Beach, FL | 2.0 | 2.0 | 1130 | $7,000 | $6.19 | 24d | 1 | 1.08mi |
| 300 Uno Lago Dr Juno Beach, FL | 2.0–3.0 | 2.0 | 1319 | $6,800 | $5.16 | 3d | 1 | 1.10mi |
| 800 Uno Lago Dr #305 Juno Beach, FL | 3.0 | 2.0 | 1446 | $5,000 | $3.46 | 24d | 1 | 1.10mi |
| 3640 Gull Rd Palm Beach Gardens, FL | 3.0 | 2.0 | 1382 | $2,975 | $2.15 | 7d | 1 | 1.10mi |
| 1660 Twelve Oaks Way #203 North Palm Beach, FL | 2.0 | 2.0 | 1492 | $7,500 | $5.03 | 19d | 1 | 1.13mi |
| 12155 US Highway 1 North Palm Beach, FL | 1.0–3.0 | 1.0–2.0 | 1297 | $4,786 | $3.69 | 1d | 23 | 1.14mi |
| 7102 Geminata Oak Ct Unit 7102 Palm Beach Gardens, FL | 2.0 | 2.0 | 1152 | $3,200 | $2.78 | 7d | 1 | 1.17mi |
| 11024 Legacy Dr #104 Palm Beach Gardens, FL | 2.0 | 2.0 | 1345 | $6,000 | $4.46 | 24d | 1 | 1.17mi |
| 3660 RCA Blvd Palm Beach Gardens, FL | 1.0–2.0 | 1.0–2.0 | 1524 | $6,849 | $4.49 | 1d | 30 | 1.19mi |
| 11028 Legacy Dr #203 Palm Beach Gardens, FL | 2.0 | 2.0 | 1309 | $4,000 | $3.06 | 24d | 1 | 1.19mi |
| 3818 Everglades Rd Palm Beach Gardens, FL | 4.0 | 1.5 | 1381 | $3,000 | $2.17 | 24d | 1 | 1.21mi |
| 3955 Design Center Dr Palm Beach Gardens, FL | 3.0 | 1.0–2.0 | 996 | $4,108 | $4.12 | 2d | 25 | 1.38mi |
| 134 Lakeshore Dr Unit T13 North Palm Beach, FL | 2.0 | 2.0 | 1244 | $3,250 | $2.61 | 24d | 1 | 1.40mi |
| 130 Lakeshore Dr #923 North Palm Beach, FL | 2.0 | 2.0 | 1244 | $3,300 | $2.65 | 24d | 1 | 1.48mi |
| 136 Lakeshore Dr North Palm Beach, FL | 2.0 | 2.0 | 1244 | $4,000 | $3.22 | 4d | 1 | 1.48mi |
| 132 Lakeshore Dr #1118 North Palm Beach, FL | 3.0 | 2.5 | 1498 | $6,450 | $4.31 | 24d | 1 | 1.48mi |
HOA detail
- Monthly dues
- $1,575 · $18,900/yr
- Likely covers
- poolgym
Listing history 22 events
-
2026-06-18days on market $115,000 Active 86 DOM
-
2026-06-17days on market $115,000 Active 85 DOM
-
2026-06-16days on market $115,000 Active 84 DOM
-
2026-06-15days on market $115,000 Active 83 DOM
-
2026-06-13days on market $115,000 Active 81 DOM
-
2026-06-09days on market $115,000 Active 77 DOM
-
2026-06-08days on market $115,000 Active 76 DOM
-
2026-06-07days on market $115,000 Active 75 DOM
-
2026-06-04days on market $115,000 Active 72 DOM
-
2026-06-03days on market $115,000 Active 71 DOM
-
2026-06-02days on market $115,000 Active 70 DOM
-
2026-06-01days on market $115,000 Active 69 DOM
-
2026-05-31days on market $115,000 Active 68 DOM
-
2026-04-09price $115,000
-
2026-03-24$125,000 Active
-
2023-07-31historical
-
2023-05-19price $135,000
-
2023-04-18price $150,000
-
2023-03-15price $155,000
-
2023-02-04$165,000 Active
-
2022-12-01historical
-
2022-11-28$165,000 Active
ⓘ Source: listings_history table (triggers on properties + properties_extension) + one-shot
backfill from property_details.listing_events for pre-trigger history.
Climate risk First Street
- Flood 5/10 Major FEMA zone X (shaded) · 24% chance over 30 yrs
- Wildfire 1/10 Low
- Heat 10/10 Extreme 7 d/yr ≥106°F today · 25 d/yr by 30 yrs out
- Wind 10/10 Extreme 99% chance of damaging wind over 30 yrs
- Air quality 2/10 Low 0 unhealthy d/yr today · 1 by 30 yrs out
Nearby sold comps map
Loading sold comps map…
Walkable amenities ~0.75 mi
Loading nearby amenities…
Taxation est. · year 1
- Rental income
- $44,115
- − Mortgage interest
- −$6,442
- − Property taxes
- −$1,725
- − Insurance
- −$575
- − Repairs & maintenance
- −$3,529
- − Management
- −$3,529
- − HOA
- −$18,900
- − Depreciation
- −$3,345
- Taxable income
- $6,069
- Est. tax owed @ 24.0%
- −$1,457
- After-tax cash flow
- $4,957/yr
For passive investors: Depreciation is non-cash, so a rental often shows a tax loss while cash-flowing — sheltering income. Rental losses are passive: they offset passive income freely, and up to $25,000/yr can offset ordinary (W-2) income if you actively participate and your MAGI is under $100k (phasing out to $0 by $150k); unused losses carry forward. On sale, claimed depreciation is recaptured at up to 25%, and gains may owe capital-gains tax (a 1031 exchange can defer both). Figures are a year-1 estimate at your 24.0% rate — not tax advice; consult a CPA.
Condition & rehab AI · 12 photos
This manufactured home is in good condition with modern upgrades and a well-maintained exterior. It has potential for further value increases through painting and landscaping improvements.
Value-add opportunities
- Both Painting exterior and interior — Enhances curb appeal and interior aesthetics
- Both Landscaping improvements — Enhances curb appeal and adds value
- Both New flooring in bathrooms — Improves aesthetics and functionality
- Both New lighting fixtures — Enhances aesthetics and functionality
Renovation cost estimate screening
Value-add ROI direction
- Both Painting exterior and interior — Enhances curb appeal and interior aesthetics ↑
- Both Landscaping improvements — Enhances curb appeal and adds value ↑
- Both New flooring in bathrooms — Improves aesthetics and functionality ↑
- Both New lighting fixtures — Enhances aesthetics and functionality ↑
ⓘ Cost ranges are severity-bucket heuristics (US national rule-of-thumb). Get contractor quotes + a written scope before underwriting a rehab budget.
Schools (NCES district)
- District
- Palm Beach
- NCES district ID
- 1201500
- Math proficiency
- 46% ▼ -16.00%
- Reading proficiency
- 53% ▼ -4.00%
- Median HH income
- $53,943
- Composite
- 42.72/100
- National rank
- #3160
- State rank
- #34 of 73 in FL
Livability — Palm Beach Gardens
- Score
- 69/100
- State rank
- #464
- US rank
- #8366
Category grades
Schools grade is shown separately in the Schools card above.
Census & demographics
- Census place
- Palm Beach Gardens, FL
- County
- Palm Beach County · 1,438,312 people
- City population
- 96,294
- Metro
- Miami-Fort Lauderdale-Pompano Beach, FL
- Population (ZIP)
- 36,759
- Household income
- $94,530
- Rent vs Own
- Severe rent burden
- 1429.0
Population outlook (Palm Beach County) Hauer SSP2
- Today (2025)
- 1,637,487 people
- By 2030
- 1,743,255 · +6.5%
- By 2040
- 1,948,712 · +19.0%
- By 2050
- 2,132,979 · +30.3%
- By 2075
- 2,530,027 · +54.5%
- By 2100
- 2,706,979 · +65.3%
Race, ethnicity, and origin ACS 2023
- Neighborhood character
- Predominantly White (70%)
- Race & ethnicity
- White 70% Hispanic / Latino 15% Two or more races 13% Black 5% Asian 4%
- Hispanic origin (detail)
- Mexican 2% Puerto Rican 2% Cuban 3%
- Common ancestry
- Romanian 4% Lithuanian 3% Slovak 2%
- Foreign-born
- 17% · Canada, Jamaica, Vietnam
- Languages at home
- 78% English-only · Spanish 13% French/Haitian/Cajun 3% Other Indo-European 2%
Political lean MEDSL · Palm Beach
- 2024 margin
- Toss-up / Even · D 50.0% · R 49.2%
- 2008→2024 swing
- -22.1pp toward R · 2008: 22.9pp · 2024: 0.8pp
- All cycles
- 2024: D+0.8 2020: D+12.8 2016: D+15.3 2012: D+17.0 2008: D+22.9
Not yet ingested
- Civics
- —
Market trends
- HPI YoY
- ▼ -346.12%
- Current HPI
- 375.5381
- Rent YoY
- ▲ 2.49%
- Metro
- Miami-Fort Lauderdale-Pompano Beach, FL
- State GDP YoY
- ▲ 3.28%
- F500 in state
- 36
Industry mix (Fortune 500 HQ in FL)
| Industry | F500 HQs | Revenue |
|---|---|---|
| Industrial Technology | 2 | $29B |
|
||
| Insurance | 2 | $17B |
|
||
| Retail | 1 | $60B |
|
||
| Technology Distribution | 1 | $58B |
|
||
| Homebuilding | 1 | $35B |
|
||
| Technology Manufacturing | 1 | $35B |
|
||
Price history
-30.3% since first listed9 events — show timeline
- 2026-04-09 Price Changed $115,000 Beaches MLS
- 2026-03-24 Listed $125,000 Beaches MLS
- 2023-07-31 Listing Removed — MCRTC
- 2023-05-19 Price Changed $135,000 MCRTC
- 2023-04-18 Price Changed $150,000 MCRTC
- 2023-03-15 Price Changed $155,000 MCRTC
- 2023-02-04 Listed $165,000 MCRTC
- 2022-12-01 Listing Removed — Beaches MLS
- 2022-11-28 Listed $165,000 Beaches MLS
Cash-flow waterfall
monthlySold comps — $/sqft
last 12 mo · ≤1 miLoading sold comps…