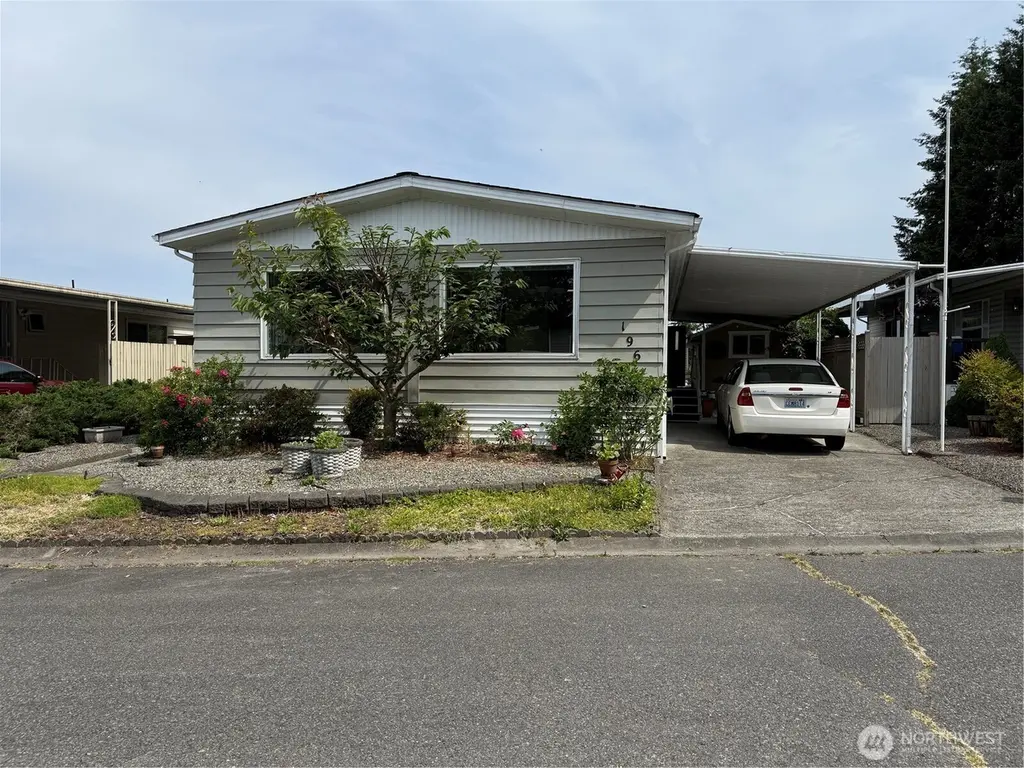
1415 84th St SE #196 · Everett, WA
Flood risk No data
- FEMA flood zone
- —
- Chance of flooding over 30 yrs
- —
- Est. flood insurance / yr
- —
Fire risk No data
- Est. fire insurance / yr
- —
Heat risk No data
- Hot days now (above threshold)
- —
- Hot days in 30 yrs
- —
Wind risk No data
- Chance of severe wind over 30 yrs
- —
Air-quality risk No data
- Unhealthy air days now
- —
- Unhealthy air days in 30 yrs
- —
Risk factors via First Street. Map © Google.
Why this score? — see what drove the C+ grade
The composite is a weighted blend of 9 inputs, each scored 0–100. Each bar is that input's sub-score; the figure is the points it added to the 100-point composite (weight × sub-score).
- Cash flow +30.0/30.0
- DSCR +10.0/10.0
- 1% rule +9.3/10.0
- Schools +5.9/10.0
- Livability +3.7/5.0
- Condition / age +2.5/5.0
- Rent growth +1.7/5.0
- ARV discount +1.5/15.0
- Appreciation +0.0/10.0
$145,000
🖨 Deal sheet (PDF) 📄 Offer letter ✓ Due diligence
Listing remarks
$10,000 price adjustment. .Welcome to Mobile Country Club, a premier 55+ park. This is a delightful home has large rooms for entertaining & backs to common green area & is located in the back of the park, past workshop. Country style kitchen has breakfast bar & sitting area/office space w/ pellet stove. Formal dining w/ built in hutch, large living room. Heat pump for efficient heating/cooling. Utility room w/ storage units. Huge storage shed w/ power. Fruit trees, fenced yard. Newer front deck/stairs. New carpet installed, fresh interior paint. Park offers clubhouse, kitchen area, laundry, dining area and outdoor pool. Park has monthly activities that brings the neighbors
Key facts
- Huge storage shed
- Built in hutch
- Utility room
Tags
Neighborhood map
What this means for you Summary
Snapshot
- This is a 2-bed/2.0-bath manufactured listed at $145k.
Deal economics
- At list price, monthly cash flow is $631 ($8k/yr) — positive.
- The deal already cash-flows at list — no discount required.
- Meets the 1% rule at list price ($2k rent vs $145k).
- Recommended offer: $128k (12.0% below list) — sets the bar for market timing.
- Cap rate 11.5% vs local median 2.5% in Everett — top-decile yield for the area; either an underpriced asset or a hidden risk that comps aren't pricing in. Stress-test before assuming the spread holds.
Location & tenants
- Location reads 73/100 on livability (#199 in WA) — a middle-class / working-renter tenant base. Strengths: commute A+, housing A, health & safety A; Watch: crime D+, amenities F, cost of living F.
- Everett School District (urban): math 60% / reading 72% proficiency, ranked #26 of 291 in WA (top 9%) — acceptable for families but not a draw, mixed tenant base, ~2y average lease.
- Zoned schools: Emerson Elementary School (621 students, 64% FRL); Evergreen Middle School (909 students, 64% FRL); Cascade High School (1,793 students, 53% FRL) — zoned schools average 60% FRL vs 31% district-wide (30 pts higher); higher-poverty schools than district average — tighter screening recommended.
- Market conditions: Rents falling (-3.2%/yr); 277 active listings in the ZIP; 40 comparable units currently listed for rent nearby; rentals leasing fast (median 7d on market — plan ~1-2 weeks tenant-placement turnaround); solid renter incomes; 3,982 units permitted in Snohomish County in 2024 (1,492 in 5+ unit buildings).
Forward outlook
- Local home prices are declining (-3.0%/yr); year-one equity from $1k of loan paydown is wiped out by about $4k of value loss. Plan a longer hold.
- Snohomish County population projected at +30% by 2050 — long-run rental-demand tailwind backs the buy-and-hold thesis.
- At projected returns (-3.0% appreciation + 0.0% rent growth), your $41k cash investment doubles in ~9 years — after that, you're playing with house money.
Negotiation context
- It's been on market 368 days — a 12% lower offer ($128k) is reasonable based on typical stale-listing flexibility.
- 2 sale attempts since 4y ago; this cycle's ask has dropped $16k (10%) from the opening price — seller is motivated, your offer sets the floor, not the list.
Questions for the listing agent
- It's been on market 368 days. Have you received any prior offers? Is the seller open to a 12% concession, seller financing, or rate buy-down credit?
- Built in 1977 — when were the roof, HVAC, electrical panel, plumbing, and water heater last replaced?
- Why hasn't it sold? Are there any deal-killer items the seller is aware of (foundation, flood, title, zoning, code violations)?
- Is there a deadline driving the sale (1031 exchange, divorce, estate, relocation)? That informs how much negotiation room exists.
- Crime grade is D in this area — have there been break-ins, vandalism, or insurance claims at this property in the last 3 years? What carrier currently insures it and at what premium?
- What's the average days-on-market for RENTAL listings here right now (not sales)? A rising rental-DOM trend means longer vacancies and softer asking-rent achievability than the comps imply.
- What's the recent tenant-quality profile in this submarket — average credit score on applications, eviction rate, late-payment / NSF rate, and stable-employment percentage? A property-management company in the area should have these aggregated.
- How much new for-sale + rental construction is in the pipeline within 1–3 miles? Heavy new supply typically softens prices + rents 12–24 months out; constrained supply supports both.
Investment metrics
- 1% rule
- 1.43% ✓
- Cap rate
- 11.51%
- Cash-on-cash
- 18.65%
- DSCR
- 1.83
- GRM
- 5.8
CMA / ARV
- ARV (median comp)
- $128,000
- List price
- $145,000
- Delta
- 13.28%
- Verdict
- OVERPRICED
- Comps
- 9 within 1.0 mi
Show comp detail 9 sales within ~0.75 mi
| Address | Dist | Beds/Ba | Sqft | Sold | Price | $/sf | Match |
|---|---|---|---|---|---|---|---|
| 1415 84th St SE #36 | 0.00mi | 2/2.0 | 1,152 (+1%) | 2mo | $150,000 | $130 | 97 |
| 1415 84th St SE #80 | 0.00mi | 2/2.0 | 1,194 (+5%) | 7mo | $140,000 | $117 | 86 |
| 1415 84th St SE #11 | 0.00mi | 2/2.0 | 1,200 (+5%) | 8mo | $145,000 | $121 | 85 |
| 1415 84th St SE #104 | 0.00mi | 2/2.0 | 1,242 (+9%) | 1mo | $75,000 | $60 | 84 |
| 1415 84th St SE #45 | 0.00mi | 2/2.0 | 1,240 (+9%) | 10mo | $65,000 | $52 | 78 |
| 1415 84th St SE #97 | 0.00mi | 2/2.0 | 1,240 (+9%) | 16mo | $110,000 | $89 | 73 |
| 1415 84th St SE #110 | 0.00mi | 2/2.0 | 1,232 (+8%) | 18mo | $200,000 | $162 | 72 |
| 1415 84th St SE #9 | 0.00mi | 2/2.0 | 1,000 (-12%) | 12mo | $164,950 | $165 | 69 |
| 1415 SE 84th St #122 | 0.00mi | 2/2.0 | 1,242 (+9%) | 23mo | $125,000 | $101 | 66 |
Match score weights: distance 35% · size 25% · config 20% · recency 20%. Top-matched comps best support the ARV.
Projected returns pro-forma
-3.0% appreciation · 0.0% rent growth · sell at horizon
- IRR
- 7.0%
- Equity multiple
- 1.26×
- Total profit
- $10,661
- Equity at exit
- $21,620
- IRR
- 13.5%
- Equity multiple
- 1.93×
- Total profit
- $37,742
- Equity at exit
- $12,537
Cash invested: $40,600 (down + closing). Projections, not guarantees.
Landlord ↔ Tenant lean methodology
- Overall (STATE)
- 28 Tenant-Leaning
- State Washington
- 28 Tenant-Leaning · D+8
- County
- — inherits STATE
- City
- — inherits STATE
ZIP-level market 98208
- Rents YoY
- -3.2%
- Active inventory
- 277
- Price-to-rent
- 5.8×
Monthly cashflow live
- Estimated rent
- $2,067 high interval (Pro) →
- Mortgage (P&I)
- −$760
- Tax est. 1.5%
- −$181 /mo · $2,175/yr
- Insurance
- −$60
- HOA
- −$0
- Vacancy / Maint / Mgmt
- −$434
- Net cashflow
- $631
Break-even live
Sensitivity live
| Price | -10% $731 | -5% $681 | +0% $631 | +5% $581 | +10% $531 |
|---|---|---|---|---|---|
| Rent | -10% $468 | -5% $549 | +0% $631 | +5% $713 | +10% $794 |
| Rate | -1.0pp $704 | -0.5pp $668 | base $631 | +0.5pp $593 | +1.0pp $555 |
UW: 25.0% down · 7.5% · 30yr · 1.5% tax · 5.0% vac · 8.0% maint · 8.0% mgmt
Financing live
Cash to close
- Down payment
- $36,250
- Closing costs
- $4,350
- Reserves months
- —
- Total cash needed
- —
Loan-product check · same deal, 3 products live
Conventional
25% down · 7.5% · 30yr
- Down + closing
- —
- Monthly P&I
- —
- Monthly cashflow
- —
- DSCR
- —
- Eligible?
- —
Personal DTI + credit; lowest rate.
DSCR
20% down · 8.5% · 30yr
- Down + closing
- —
- Monthly P&I
- —
- Monthly cashflow
- —
- DSCR
- —
- Eligible?
- —
No personal income docs; deal must DSCR.
Hard money
10% down · 12.0% · 12mo
- Down + closing
- —
- Monthly P&I
- —
- Monthly cashflow
- —
- DSCR
- —
- Eligible?
- —
Short-term bridge; refi at stabilization.
Rent comps 40 comps
| Address | Beds | Baths | Sqft | Rent | $/sqft | DOM | Units | Dist |
|---|---|---|---|---|---|---|---|---|
| 9009 W Mall Dr Everett, WA | 1.0–2.0 | 1.0–2.0 | 830 | $2,502 | $3.01 | 0d | 19 | 0.23mi |
| 1224 Kossuth Ave Everett, WA | 2.0 | 1.0 | 1375 | $2,700 | $1.96 | 21d | 1 | 0.44mi |
| 229 Dorn Ave Unit C101 Everett, WA | 3.0 | 2.5 | 1452 | $2,900 | $2.00 | 0d | 1 | 0.74mi |
| 233 Dorn Ave Unit 1 Everett, WA | 2.0 | 1.0 | 944 | $1,950 | $2.07 | 12d | 1 | 0.74mi |
| 8102 Evergreen Way Everett, WA | 1.0–5.0 | 1.0–2.0 | 1390 | $2,058 | $1.48 | 0d | 17 | 0.75mi |
| 207 Dorn Ave Unit 2H Everett, WA | 2.0 | 1.0 | 780 | $1,795 | $2.30 | 16d | 1 | 0.76mi |
| 115 Dorn Ave Everett, WA | 2.0 | 1.0–2.0 | 946 | $1,738 | $1.84 | 18d | 1 | 0.80mi |
| 1007 75th St SE Everett, WA | 2.0 | 1.5 | 1059 | $1,695 | $1.60 | 1d | 1 | 0.84mi |
| 618 75th St SE Unit 206 Everett, WA | 2.0 | 1.0 | 833 | $1,700 | $2.04 | 26d | 1 | 0.86mi |
| 618 75th St SE Everett, WA | 3.0 | 2.0 | 1232 | $2,400 | $1.95 | 12d | 1 | 0.86mi |
| 618 75th St SE Everett, WA | 2.0 | 1.0 | 833 | $1,750 | $2.10 | 26d | 1 | 0.86mi |
| 1915 75th St SE Unit 1H Everett, WA | 3.0 | 1.5 | 1300 | $2,500 | $1.92 | 26d | 1 | 0.89mi |
| 10101 7th Ave SE Everett, WA | 1.0–3.0 | 1.0–2.0 | 1073 | $2,277 | $2.12 | 0d | 14 | 0.90mi |
| 8920 Evergreen Way Everett, WA | 2.0 | 1.0 | 567 | $1,750 | $3.08 | 1d | 7 | 0.91mi |
| 701 75th St SE Everett, WA | 1.0–3.0 | 1.0 | 820 | $1,850 | $2.26 | 6d | 5 | 0.92mi |
| 747 75th St SE Everett, WA | 2.0 | 1.0 | 864 | $1,722 | $1.99 | 6d | 1 | 0.96mi |
| 120 W Casino Rd Everett, WA | 1.0–2.0 | 1.0–1.5 | 818 | $1,992 | $2.43 | 0d | 13 | 1.00mi |
| 2319 75th St SE Everett, WA | 3.0 | 2.0 | 1112 | $2,745 | $2.47 | 26d | 1 | 1.00mi |
| 1304 Bruskrud Rd Everett, WA | 2.0 | 1.5–2.0 | 900 | $2,000 | $2.22 | 1d | 5 | 1.03mi |
| 120 SE Everett Mall Way Everett, WA | 1.0–2.0 | 1.0–2.0 | 813 | $2,134 | $2.62 | 0d | 43 | 1.13mi |
| 6911 Rainier Dr Unit 11-03 Everett, WA | 2.0 | 1.5 | 1008 | $1,695 | $1.68 | 26d | 1 | 1.13mi |
| 6911 Rainier Dr Unit 11-07 Everett, WA | 2.0 | 1.5 | 1008 | $2,095 | $2.08 | 6d | 1 | 1.13mi |
| 2220 Monroe Ave Everett, WA | 3.0 | 1.0 | 930 | $2,799 | $3.01 | 1d | 1 | 1.15mi |
| 222 W Marilyn Ave Everett, WA | 3.0 | 1.0 | 1000 | $2,400 | $2.40 | 18d | 1 | 1.25mi |
| 8710 5th Ave W Everett, WA | 2.0 | 2.0 | 950 | $1,998 | $2.10 | 0d | 11 | 1.28mi |
| 8530 5th Ave W Everett, WA | 1.0–2.0 | 1.0 | 808 | $1,595 | $1.97 | 6d | 2 | 1.28mi |
| 8220 5th Ave W Apt F Everett, WA | 2.0 | 1.0 | 950 | $1,595 | $1.68 | 1d | 1 | 1.29mi |
| 215 100th St SW Everett, WA | 2.0 | 2.0 | 856 | $1,845 | $2.16 | 6d | 1 | 1.32mi |
| 6609 Cady Rd Unit 2 Everett, WA | 2.0 | 1.5 | 1386 | $2,225 | $1.61 | 26d | 1 | 1.34mi |
| 611 W Casino Rd Unit 3A Everett, WA | 1.0 | 1.0 | 753 | $1,400 | $1.86 | 4d | 1 | 1.34mi |
| 611 W Casino Rd Unit 2A Everett, WA | 1.0 | 1.0 | 700 | $1,350 | $1.93 | 1d | 1 | 1.34mi |
| 611 W Casino Rd Everett, WA | 1.0 | 1.0 | 753 | $1,400 | $1.86 | 1d | 1 | 1.34mi |
| 611 W Casino Rd Everett, WA | 1.0 | 1.0 | 700 | $1,350 | $1.93 | 45d | 1 | 1.34mi |
| 507 Madison St Apt A Everett, WA | 3.0 | 2.0 | 1014 | $2,449 | $2.42 | 1d | 1 | 1.35mi |
| 702 W Casino Rd Everett, WA | 1.0–2.0 | 1.0–1.5 | 850 | $1,749 | $2.06 | 6d | 21 | 1.36mi |
| 711 W Casino Rd Everett, WA | 1.0–2.0 | 1.0 | 770 | $1,801 | $2.34 | 1d | 5 | 1.38mi |
| 9925 4th Ave W Apt 9 Everett, WA | 1.0 | 1.0 | 800 | $1,245 | $1.56 | 3d | 1 | 1.39mi |
| 9925 4th Ave W Apt 6 Everett, WA | 2.0 | 2.0 | 1000 | $1,445 | $1.45 | 3d | 1 | 1.39mi |
| 2505 Madison St Unit A Everett, WA | 3.0 | 1.0 | 1040 | $2,800 | $2.69 | 26d | 1 | 1.39mi |
| 9615 Holly Dr Everett, WA | 1.0–2.0 | 1.0 | 645 | $2,220 | $3.44 | 6d | 1 | 1.41mi |
Listing history 24 events
-
2026-06-21days on market $145,000 Active 368 DOM
-
2026-06-18days on market $145,000 Active 365 DOM
-
2026-06-17days on market $145,000 Active 364 DOM
-
2026-06-16days on market $145,000 Active 363 DOM
-
2026-06-15days on market $145,000 Active 362 DOM
-
2026-06-13days on market $145,000 Active 360 DOM
-
2026-06-13days on market $145,000 Active 359 DOM
-
2026-06-09days on market $145,000 Active 356 DOM
-
2026-06-08days on market $145,000 Active 355 DOM
-
2026-06-07days on market $145,000 Active 354 DOM
-
2026-06-04days on market $145,000 Active 351 DOM
-
2026-06-03days on market $145,000 Active 350 DOM
-
2026-06-02days on market $145,000 Active 349 DOM
-
2026-06-01days on market $145,000 Active 348 DOM
-
2026-05-31days on market $145,000 Active 347 DOM
-
2026-05-15price $145,000
-
2025-10-06price $155,000
-
2025-08-15price $158,000
-
2025-06-18$161,300 Active
-
2022-02-11soldstatus $130,000 Closed
-
2022-02-07status Pending
-
2022-02-02status Pending - Backup Offer Requested
-
2022-02-02status Pending
-
2022-01-24$140,000 Active
ⓘ Source: listings_history table (triggers on properties + properties_extension) + one-shot
backfill from property_details.listing_events for pre-trigger history.
Nearby sold comps map
Loading sold comps map…
Walkable amenities ~0.75 mi
Loading nearby amenities…
Taxation est. · year 1
- Rental income
- $24,805
- − Mortgage interest
- −$8,122
- − Property taxes
- −$2,175
- − Insurance
- −$725
- − Repairs & maintenance
- −$1,984
- − Management
- −$1,984
- − Depreciation
- −$4,218
- Taxable income
- $5,596
- Est. tax owed @ 24.0%
- −$1,343
- After-tax cash flow
- $6,228/yr
For passive investors: Depreciation is non-cash, so a rental often shows a tax loss while cash-flowing — sheltering income. Rental losses are passive: they offset passive income freely, and up to $25,000/yr can offset ordinary (W-2) income if you actively participate and your MAGI is under $100k (phasing out to $0 by $150k); unused losses carry forward. On sale, claimed depreciation is recaptured at up to 25%, and gains may owe capital-gains tax (a 1031 exchange can defer both). Figures are a year-1 estimate at your 24.0% rate — not tax advice; consult a CPA.
Schools (NCES district)
- District
- Everett School District
- NCES district ID
- 5302670
- Math proficiency
- 60% ▲ 1.00%
- Reading proficiency
- 72% ▲ 1.00%
- Median HH income
- $66,815
- Composite
- 59.0/100
- National rank
- #1964
- State rank
- #26 of 291 in WA
Livability — Everett
- Score
- 73/100
- State rank
- #199
- US rank
- #5489
Category grades
Schools grade is shown separately in the Schools card above.
Census & demographics
- Census place
- Everett, WA
- County
- Snohomish County · 786,756 people
- City population
- 173,457
- Metro
- Seattle-Tacoma-Bellevue, WA
- Population (ZIP)
- 60,915
- Household income
- $103,705
- Rent vs Own
- Severe rent burden
- 1617.0
Population outlook (Snohomish County) Hauer SSP2
- Today (2025)
- 899,800 people
- By 2030
- 960,975 · +6.8%
- By 2040
- 1,074,447 · +19.4%
- By 2050
- 1,171,954 · +30.2%
- By 2075
- 1,384,849 · +53.9%
- By 2100
- 1,497,296 · +66.4%
Race, ethnicity, and origin ACS 2023
- Neighborhood character
- Diverse neighborhood (Simpson 0.65)
- Race & ethnicity
- White 55% Asian 17% Hispanic / Latino 14% Two or more races 13% Black 5%
- Hispanic origin (detail)
- Mexican 10%
- Common ancestry
- Portuguese 5% Italian 3% Slovak 2%
- Foreign-born
- 27% · Canada, Vietnam, South Korea
- Languages at home
- 66% English-only · Spanish 9% Vietnamese 4% Other Asian/Pacific 4%
Political lean MEDSL · Snohomish
- 2024 margin
- D (+19.0) · D 57.8% · R 38.9% · Other 3.3%
- 2008→2024 swing
- +0.1pp no change · 2008: 18.9pp · 2024: 19.0pp
- All cycles
- 2024: D+19.0 2020: D+20.6 2016: D+16.6 2012: D+16.2 2008: D+18.9
Not yet ingested
- Civics
- —
Market trends
- HPI YoY
- ▼ -884.74%
- Current HPI
- 337.856
- Rent YoY
- ▼ -3.16%
- Metro
- Seattle-Tacoma-Bellevue, WA
- State GDP YoY
- ▲ 4.65%
- F500 in state
- 22
Industry mix (Fortune 500 HQ in WA)
| Industry | F500 HQs | Revenue |
|---|---|---|
| Retail | 2 | $269B |
|
||
| Technology / Retail | 1 | $638B |
|
||
| Technology | 1 | $245B |
|
||
| Telecommunications | 1 | $38B |
|
||
| Food / Beverage | 1 | $36B |
|
||
| Automotive / Trucks | 1 | $34B |
|
||
Price history
+3.6% since first listed9 events — show timeline
- 2026-05-15 Price Changed $145,000 NWMLS as Distributed by MLS Grid
- 2025-10-06 Price Changed $155,000 NWMLS as Distributed by MLS Grid
- 2025-08-15 Price Changed $158,000 NWMLS as Distributed by MLS Grid
- 2025-06-18 Listed $161,300 NWMLS as Distributed by MLS Grid
- 2022-02-11 Sold (MLS) $130,000 NWMLS as Distributed by MLS Grid
- 2022-02-07 Pending — NWMLS as Distributed by MLS Grid
- 2022-02-02 Pending — NWMLS as Distributed by MLS Grid
- 2022-02-02 Pending — NWMLS as Distributed by MLS Grid
- 2022-01-24 Listed $140,000 NWMLS as Distributed by MLS Grid
Property tax history
-9.8%/yrLatest (2026): $88 · -3.1% YoY. Source: county tax records.
Cash-flow waterfall
monthlySold comps — $/sqft
last 12 mo · ≤1 miLoading sold comps…