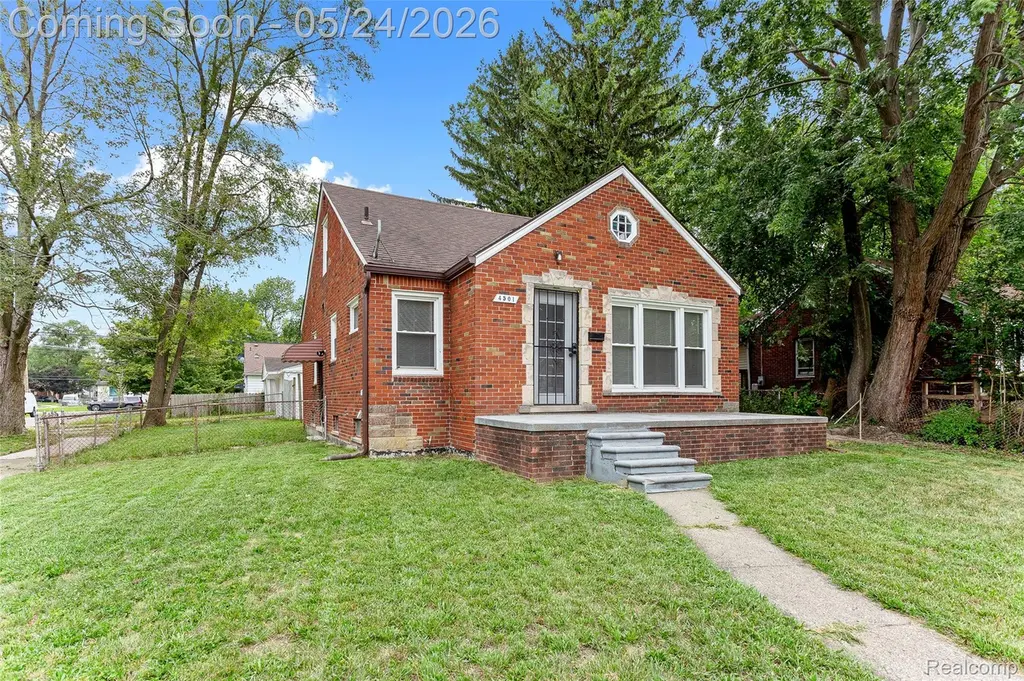
4501 Woodhall St · Detroit, MI
Flood risk 1/10 · Minimal
- FEMA flood zone
- X (unshaded)
- Chance of flooding over 30 yrs
- 0.0%
- Est. flood insurance / yr
- $473 – $860
Fire risk 1/10 · Minimal
- Est. fire insurance / yr
- $784 – $1,456
Heat risk 3/10 · Minor
- Hot days now (above 96°F)
- 7 days/yr
- Hot days in 30 yrs
- 14 days/yr
Wind risk 2/10 · Minimal
- Chance of severe wind over 30 yrs
- —
Air-quality risk 3/10 · Minor
- Unhealthy air days now
- 3 days/yr
- Unhealthy air days in 30 yrs
- 4 days/yr
Risk factors via First Street. Map © Google.
Why this score? — see what drove the B- grade
The composite is a weighted blend of 9 inputs, each scored 0–100. Each bar is that input's sub-score; the figure is the points it added to the 100-point composite (weight × sub-score).
- Cash flow +25.5/30.0
- ARV discount +15.0/15.0
- 1% rule +9.3/10.0
- DSCR +8.4/10.0
- Livability +3.7/5.0
- Rent growth +2.7/5.0
- Condition / age +2.5/5.0
- Schools +1.3/10.0
- Appreciation +0.0/10.0
$99,000
🖨 Deal sheet (PDF) 📄 Offer letter ✓ Due diligence
Listing remarks
ARE YOU LOOKING FOR A MOVE-IN-READY BRICK BUNGALOW ON A CORNER LOT IN THE CORNERSTONE VILLAGE NEIGHBORHOOD? This is it! Detroit’s strong rental market makes this property an attractive option for local or remote investors seeking a steady stream of rental income with a reliable long-term tenant with a desirable rental history paying $1,200 monthly. This well-maintained 3-bed/1-bath bungalow offers comfortable living spaces with a fenced backyard & detached 2-car garage. New upgrades include PEX plumbing, electrical, walls paint throughout & vinyl windows. PRIME LOCATION minutes away from Grosse Pointe, a few blocks off Mack Ave. , with tons of restaurants, shopping, hospita
Key facts
- 6,970 sq ft lot
- 2 garage spots
- Built 1951
Property features AI
Exterior
- Parking: Detached 2-car garage
- Utilities: Public water; Natural gas; Forced air heating system
- Home design: Residential property; 1 1/2-story structure; Built in 1951; Frontage approximately 20 feet
- Construction: Basement foundation (below-grade area present)
- Exterior features: Basement foundation; Paved street access
Interior
- Kitchen: Entry-level kitchen (approx. 6 x 4) with ceramic flooring
- Bedrooms: Second-level bedroom (approx. 14 x 9) with carpet; Entry-level bedroom (approx. 10 x 10) with wood flooring; Entry-level bedroom (approx. 10 wide) with wood flooring; Total of 7 rooms
- Flooring: Carpet in at least one bedroom; Wood flooring in living room and two bedrooms; Ceramic flooring in kitchen, dining room, and bathroom
- Bathrooms: One full bathroom (entry level) with ceramic flooring — approx. 7 x 4
- Heating & cooling: Forced air heating; Natural gas fuel
- Interior features: Cable/Internet available; Unfinished basement
- Laundry & utility: Basement present (unfinished) — space for utilities
Neighborhood map
What this means for you Summary
Snapshot
- This is a 3-bed/1.0-bath single-family listed at $99k.
Deal economics
- At list price, monthly cash flow is $230 ($3k/yr) — positive.
- The deal already cash-flows at list — no discount required.
- Meets the 1% rule at list price ($1k rent vs $99k).
- Recommended offer: $98k (1.5% below list) — sets the bar for market timing.
Location & tenants
- Location reads 73/100 on livability (#218 in MI) — a middle-class / working-renter tenant base. Strengths: amenities A+, commute A+, cost of living A+; Watch: schools F, crime F, employment F.
- Detroit Public Schools Community District (urban): math 10% / reading 24% proficiency, ranked #499 of 540 in MI (top 92%) — low school quality limits family demand, transient renter base, plan for 1-2y turnover; 90% free/reduced lunch — lower-income household profile, screen leases tightly.
- Market conditions: Rents flat; 492 active listings in the ZIP; 40 comparable units currently listed for rent nearby; rentals at typical pace (median 19d on market — plan ~3-4 weeks tenant-placement turnaround); lower-income renter base — watch delinquency; 2,639 units permitted in Wayne County in 2024 (1,216 in 5+ unit buildings).
- This rent runs 38% of the median local income ($45k/yr) — at the standard rent-burdened threshold; future hikes will face affordability resistance.
Forward outlook
- Local home prices are declining (-3.0%/yr); year-one equity from $684 of loan paydown is wiped out by about $3k of value loss. Plan a longer hold.
- Wayne County population projected at -17% by 2050 — secular population decline; favor cash flow + early exit over multi-decade hold.
Negotiation context
- It's been on market 29 days — a 2% lower offer ($98k) is reasonable based on typical stale-listing flexibility.
- 10 sale attempts since 16y ago with the ask held roughly flat each time — persistent listings suggest the price (not the market) is what's stuck; bring a comps-based counter.
- Current owner paid $55k; list at $99k implies a 80% gain — meaningful room to come down on a strong offer.
Risks & watch-outs
- Watch-outs: property tax is 4.0% of price; built in 1951 — expect roof / HVAC / electrical / plumbing capex.
Questions for the listing agent
- Built in 1951 — when were the roof, HVAC, electrical panel, plumbing, and water heater last replaced?
- Property tax is high relative to price — has the assessment been appealed recently, and will the sale trigger a re-assessment?
- Is there a deadline driving the sale (1031 exchange, divorce, estate, relocation)? That informs how much negotiation room exists.
- Schools are F-rated, which usually means shorter tenancies and higher turnover. Who's the typical renter profile here, and what's been the actual vacancy rate?
- Crime grade is F in this area — have there been break-ins, vandalism, or insurance claims at this property in the last 3 years? What carrier currently insures it and at what premium?
- What's the average days-on-market for RENTAL listings here right now (not sales)? A rising rental-DOM trend means longer vacancies and softer asking-rent achievability than the comps imply.
- What's the recent tenant-quality profile in this submarket — average credit score on applications, eviction rate, late-payment / NSF rate, and stable-employment percentage? A property-management company in the area should have these aggregated.
- How much new for-sale + rental construction is in the pipeline within 1–3 miles? Heavy new supply typically softens prices + rents 12–24 months out; constrained supply supports both.
Investment metrics
- 1% rule
- 1.43% ✓
- Cap rate
- 9.08%
- Cash-on-cash
- 9.95%
- DSCR
- 1.44
- GRM
- 5.8
CMA / ARV
- ARV (on-the-fly)
- $120,990
- Comps found
- 12
Show comp detail 12 sales within ~0.75 mi
| Address | Dist | Beds/Ba | Sqft | Sold | Price | $/sf | Match |
|---|---|---|---|---|---|---|---|
| 4104 Woodhall St | 0.25mi | 3/1.0 | 1,090 (0%) | 3mo | $29,900 | $27 | 86 |
| 5271 Marseilles St | 0.52mi | 3/1.0 | 1,100 (+1%) | 5mo | $75,000 | $68 | 70 |
| 3482 Grayton St | 0.62mi | 3/1.0 | 1,097 (+1%) | 3mo | $140,000 | $128 | 67 |
| 5279 Cadieux Rd | 0.50mi | 3/2.0 | 1,161 (+6%) | 0mo | $68,000 | $59 | 62 |
| 5220 University Pl | 0.47mi | 2/1.0 (-1) | 1,001 (-8%) | 0mo | $40,000 | $40 | 59 |
| 866 Lincoln Rd | 0.62mi | 2/2.0 (-1) | 1,104 (+1%) | 1mo | $249,000 | $226 | 59 |
| 4503 Bishop St | 0.41mi | 3/1.5 | 1,215 (+12%) | 3mo | $158,000 | $130 | 58 |
| 4154 Grayton St | 0.39mi | 3/1.5 | 1,227 (+13%) | 2mo | $215,000 | $175 | 57 |
| 5330 Hereford St | 0.56mi | 3/1.0 | 1,204 (+10%) | 3mo | $103,000 | $86 | 54 |
| 5210 Farmbrook St | 0.56mi | 2/1.0 (-1) | 1,188 (+9%) | 3mo | $85,000 | $72 | 51 |
| 4200 Grayton St | 0.37mi | 3/3.0 | 1,234 (+13%) | 4mo | $258,000 | $209 | 50 |
| 5762 Oldtown St | 0.71mi | 3/1.5 | 1,240 (+14%) | 2mo | $138,000 | $111 | 40 |
Match score weights: distance 35% · size 25% · config 20% · recency 20%. Top-matched comps best support the ARV.
Projected returns pro-forma
-3.0% appreciation · 0.73% rent growth · sell at horizon
- IRR
- -4.4%
- Equity multiple
- 0.84×
- Total profit
- $-4,409
- Equity at exit
- $14,761
- IRR
- 1.9%
- Equity multiple
- 1.12×
- Total profit
- $3,229
- Equity at exit
- $8,560
Cash invested: $27,720 (down + closing). Projections, not guarantees.
Landlord ↔ Tenant lean methodology
- Overall (STATE)
- 62 Landlord-Friendly
- State Michigan
- 62 Landlord-Friendly · EVEN
- County
- — inherits STATE
- City
- — inherits STATE
ZIP-level market 48224
- Rents YoY
- 0.7%
- Active inventory
- 492
- Price-to-rent
- 5.8×
Monthly cashflow live
- Estimated rent
- $1,414 high interval (Pro) →
- Mortgage (P&I)
- −$519
- Tax from tax record
- −$327 /mo · $3,922/yr
- Insurance
- −$41
- HOA
- −$0
- Vacancy / Maint / Mgmt
- −$297
- Net cashflow
- $230
Break-even live
Sensitivity live
| Price | -10% $286 | -5% $258 | +0% $230 | +5% $202 | +10% $174 |
|---|---|---|---|---|---|
| Rent | -10% $118 | -5% $174 | +0% $230 | +5% $286 | +10% $342 |
| Rate | -1.0pp $280 | -0.5pp $255 | base $230 | +0.5pp $204 | +1.0pp $178 |
UW: 25.0% down · 7.5% · 30yr · 1.5% tax · 5.0% vac · 8.0% maint · 8.0% mgmt
Financing live
Cash to close
- Down payment
- $24,750
- Closing costs
- $2,970
- Reserves months
- —
- Total cash needed
- —
Loan-product check · same deal, 3 products live
Conventional
25% down · 7.5% · 30yr
- Down + closing
- —
- Monthly P&I
- —
- Monthly cashflow
- —
- DSCR
- —
- Eligible?
- —
Personal DTI + credit; lowest rate.
DSCR
20% down · 8.5% · 30yr
- Down + closing
- —
- Monthly P&I
- —
- Monthly cashflow
- —
- DSCR
- —
- Eligible?
- —
No personal income docs; deal must DSCR.
Hard money
10% down · 12.0% · 12mo
- Down + closing
- —
- Monthly P&I
- —
- Monthly cashflow
- —
- DSCR
- —
- Eligible?
- —
Short-term bridge; refi at stabilization.
Rent comps 40 comps
| Address | Beds | Baths | Sqft | Rent | $/sqft | DOM | Units | Dist |
|---|---|---|---|---|---|---|---|---|
| 17137 Ontario St Unit 1 Detroit, MI | 2.0 | 1.0 | 982 | $1,123 | $1.14 | 25d | 1 | 0.19mi |
| 890 Neff Rd Grosse Pointe, MI | 2.0 | 1.0 | 1100 | $2,000 | $1.82 | 25d | 1 | 0.53mi |
| 5786 Neff Ave Detroit, MI | 3.0 | 1.5 | 1100 | $1,225 | $1.11 | 17d | 1 | 0.74mi |
| 5955 Guilford St Detroit, MI | 3.0 | 1.0 | 802 | $1,400 | $1.75 | 18d | 1 | 0.83mi |
| 3626 Courville St Detroit, MI | 3.0 | 1.0 | 1260 | $1,300 | $1.03 | 44d | 1 | 0.85mi |
| 4627 Bedford St Unit 1 Detroit, MI | 2.0 | 1.0 | 1050 | $945 | $0.90 | 21d | 1 | 0.85mi |
| 5783 Yorkshire Rd Detroit, MI | 2.0 | 1.0 | 1040 | $1,200 | $1.15 | 44d | 1 | 0.87mi |
| 5915 Farmbrook St Detroit, MI | 3.0 | 1.5 | 1000 | $1,250 | $1.25 | 25d | 1 | 0.87mi |
| 5028 Bedford St Detroit, MI | 3.0 | 1.0 | 1000 | $1,400 | $1.40 | 6d | 1 | 0.88mi |
| 5031 Bedford St Detroit, MI | 2.0 | 1.0 | 876 | $1,870 | $2.13 | 0d | 1 | 0.91mi |
| 6154 Woodhall St Detroit, MI | 2.0 | 1.0 | 1136 | $1,000 | $0.88 | 44d | 1 | 0.95mi |
| 6181 Neff Ave Detroit, MI | 3.0 | 1.0 | 1102 | $1,299 | $1.18 | 19d | 1 | 0.97mi |
| 6175 Marseilles St Detroit, MI | 3.0 | 1.0 | 1100 | $1,100 | $1.00 | 44d | 1 | 1.00mi |
| 5112 Haverhill St Unit 1 Detroit, MI | 2.0 | 1.0 | 1000 | $1,100 | $1.10 | 44d | 1 | 1.00mi |
| 6225 Oldtown St Detroit, MI | 3.0 | 1.0 | 1330 | $1,199 | $0.90 | 18d | 1 | 1.03mi |
| 6304 Bluehill St Detroit, MI | 3.0 | 1.0 | 1088 | $1,500 | $1.38 | 44d | 1 | 1.03mi |
| 6325 Neff Ave Detroit, MI | 3.0 | 1.0 | 1000 | $1,500 | $1.50 | 4d | 1 | 1.04mi |
| 19000 Chandler Park Dr Grosse Pointe, MI | 2.0 | 1.0 | 1374 | $2,195 | $1.60 | 0d | 1 | 1.06mi |
| 19000 Chandler Park Dr Grosse Pointe, MI | 2.0 | 1.0 | 1374 | $2,300 | $1.67 | 0d | 1 | 1.06mi |
| 5267 Haverhill St Detroit, MI | 3.0 | 1.5 | 1458 | $1,300 | $0.89 | 17d | 1 | 1.06mi |
| 5267 Haverhill St Detroit, MI | 3.0 | 1.5 | 1458 | $1,300 | $0.89 | 18d | 1 | 1.06mi |
| 6301 Lodewyck St Detroit, MI | 3.0 | 1.0 | 1084 | $1,300 | $1.20 | 13d | 1 | 1.08mi |
| 22144 Moross Rd Grosse Pointe, MI | 2.0 | 1.0 | 819 | $1,350 | $1.65 | 19d | 1 | 1.09mi |
| 22144 Moross Rd Grosse Pointe, MI | 2.0 | 1.0 | 819 | $1,350 | $1.65 | 4d | 1 | 1.09mi |
| 22148 Moross Rd Grosse Pointe, MI | 2.0 | 1.0 | 819 | $1,250 | $1.53 | 4d | 1 | 1.09mi |
| 22148 Moross Rd Grosse Pointe, MI | 2.0 | 1.0 | 819 | $1,250 | $1.53 | 18d | 1 | 1.09mi |
| 3651 Buckingham Ave Detroit, MI | 3.0 | 1.0 | 1320 | $1,300 | $0.98 | 18d | 1 | 1.11mi |
| 17710 Chester St Detroit, MI | 2.0 | 1.0 | 984 | $1,250 | $1.27 | 44d | 1 | 1.13mi |
| 17720 Chester St Detroit, MI | 2.0 | 1.0 | 986 | $1,250 | $1.27 | 44d | 1 | 1.13mi |
| 5574 Buckingham Ave Detroit, MI | 3.0 | 1.0 | 1430 | $1,450 | $1.01 | 5d | 1 | 1.15mi |
| 5235 Chatsworth St Detroit, MI | 2.0 | 1.0 | 900 | $1,050 | $1.17 | 44d | 1 | 1.20mi |
| 3625 Chatsworth St Detroit, MI | 3.0 | 1.5 | 1182 | $1,295 | $1.10 | 25d | 1 | 1.22mi |
| 542 Neff Ln Grosse Pointe, MI | 2.0 | 1.0 | 900 | $1,595 | $1.77 | 44d | 1 | 1.23mi |
| 9241 Boleyn St Detroit, MI | 3.0 | 1.0 | 1350 | $1,350 | $1.00 | 44d | 1 | 1.27mi |
| 19168 Berden St Grosse Pointe, MI | 3.0 | 1.0 | 1200 | $1,800 | $1.50 | 0d | 1 | 1.28mi |
| 509 Saint Clair Ave Grosse Pointe, MI | 2.0 | 1.0 | 1000 | $1,300 | $1.30 | 44d | 1 | 1.29mi |
| 4391 Nottingham Rd Unit 4393 Detroit, MI | 2.0 | 1.0 | 1038 | $950 | $0.92 | 6d | 1 | 1.30mi |
| 9635 Everts St Detroit, MI | 4.0 | 2.0 | 1450 | $1,650 | $1.14 | 44d | 1 | 1.31mi |
| 4151 Nottingham Rd Detroit, MI | 2.0 | 1.0 | 1022 | $1,275 | $1.25 | 18d | 1 | 1.32mi |
| 9313 Harvard Rd Detroit, MI | 3.0 | 1.5 | 1329 | $1,200 | $0.90 | 18d | 1 | 1.33mi |
Listing history 45 events
-
2026-06-21days on market $99,000 Active 29 DOM
-
2026-06-18days on market $99,000 Active 26 DOM
-
2026-06-17pricedays on market $99,000 Active 25 DOM
-
2026-06-15days on market $103,000 Active 23 DOM
-
2026-06-13days on market $103,000 Active 21 DOM
-
2026-06-13days on market $103,000 Active 20 DOM
-
2026-06-09days on market $103,000 Active 17 DOM
-
2026-06-08days on market $103,000 Active 16 DOM
-
2026-06-07days on market $103,000 Active 15 DOM
-
2026-06-04days on market $103,000 Active 12 DOM
-
2026-06-03days on market $103,000 Active 11 DOM
-
2026-06-02days on market $103,000 Active 10 DOM
-
2026-06-01days on market $103,000 Active 9 DOM
-
2026-05-31days on market $103,000 Active 8 DOM
-
2026-05-17historical $103,000
-
2026-01-07historical
-
2026-01-07historical
-
2025-11-04$99,000 Active
-
2025-11-03$99,000 Active
-
2025-10-26historical
-
2025-10-26historical
-
2025-08-30$109,000 Active
-
2025-08-30$109,000 Active
-
2025-08-25historical
-
2024-11-08soldstatus $55,000
-
2019-06-05historical
-
2019-06-05historical
-
2019-04-17soldstatus $71,500
-
2019-03-27$75,600 Active
-
2019-03-27$75,600 Active
-
2018-05-07soldstatus $49,430
-
2017-12-27soldstatus $27,500 Closed
-
2017-12-27soldstatus $27,500
-
2017-12-18status Pending
-
2017-12-05price $34,999
-
2017-11-26price $39,300
-
2017-11-15price $44,400
-
2017-11-05$50,000 Active
-
2017-11-05$34,999
-
2013-12-12soldstatus $8,500
-
2011-12-25historical
-
2010-12-24$69,000
-
2010-10-27historical
-
2010-04-26$74,900
-
1994-08-22soldstatus $21,000
ⓘ Source: listings_history table (triggers on properties + properties_extension) + one-shot
backfill from property_details.listing_events for pre-trigger history.
Tax reassessment forecast MI · Partial reset (capped growth)
- Current annual tax
- $3,922 · $327/mo
- Projected year-2 tax
- $3,922 · $327/mo
- Expected delta
- $0/yr ($0/mo · 0.0%)
ⓘ Screening estimate from a state-policy table — verify with the county assessor before closing.
Climate risk First Street
- Flood 1/10 Low FEMA zone X (unshaded) · 0% chance over 30 yrs
- Wildfire 1/10 Low
- Heat 3/10 Moderate 7 d/yr ≥96°F today · 14 d/yr by 30 yrs out
- Wind 2/10 Low
- Air quality 3/10 Moderate 3 unhealthy d/yr today · 4 by 30 yrs out
Nearby sold comps map
Loading sold comps map…
Walkable amenities ~0.75 mi
Loading nearby amenities…
Taxation est. · year 1
- Rental income
- $16,969
- − Mortgage interest
- −$5,546
- − Property taxes
- −$3,922
- − Insurance
- −$495
- − Repairs & maintenance
- −$1,358
- − Management
- −$1,358
- − Depreciation
- −$2,880
- Taxable income
- $1,412
- Est. tax owed @ 24.0%
- −$339
- After-tax cash flow
- $2,420/yr
For passive investors: Depreciation is non-cash, so a rental often shows a tax loss while cash-flowing — sheltering income. Rental losses are passive: they offset passive income freely, and up to $25,000/yr can offset ordinary (W-2) income if you actively participate and your MAGI is under $100k (phasing out to $0 by $150k); unused losses carry forward. On sale, claimed depreciation is recaptured at up to 25%, and gains may owe capital-gains tax (a 1031 exchange can defer both). Figures are a year-1 estimate at your 24.0% rate — not tax advice; consult a CPA.
Schools (NCES district)
- District
- Detroit Public Schools Community District
- NCES district ID
- 2601103
- Math proficiency
- 10% ▼ -2.00%
- Reading proficiency
- 24% ▲ 6.00%
- Median HH income
- $25,815
- Composite
- 13.06/100
- National rank
- #9564
- State rank
- #499 of 540 in MI
Livability — Detroit
- Score
- 73/100
- State rank
- #218
- US rank
- #5427
Category grades
Schools grade is shown separately in the Schools card above.
Census & demographics
- Census place
- Detroit, MI
- County
- Wayne County · 1,562,939 people
- City population
- 572,865
- Metro
- Detroit-Warren-Dearborn, MI
- Population (ZIP)
- 39,668
- Household income
- $44,856
- Rent vs Own
- Severe rent burden
- 2515.0
Population outlook (Wayne County) Hauer SSP2
- Today (2025)
- 1,675,273 people
- By 2030
- 1,620,300 · -3.3%
- By 2040
- 1,502,341 · -10.3%
- By 2050
- 1,384,039 · -17.4%
- By 2075
- 1,124,592 · -32.9%
- By 2100
- 881,193 · -47.4%
Race, ethnicity, and origin ACS 2023
- Neighborhood character
- Predominantly Black (88%)
- Race & ethnicity
- Black 88% White 8% Two or more races 3% Hispanic / Latino 1%
- Common ancestry
- Iranian 1% Romanian 1% Lithuanian 1%
- Foreign-born
- 1%
- Languages at home
- 97% English-only · Spanish 2%
Political lean MEDSL · Wayne
- 2024 margin
- Strong D (+29.0) · D 62.7% · R 33.7% · Other 3.6%
- 2008→2024 swing
- -20.5pp toward R · 2008: 49.5pp · 2024: 29.0pp
- All cycles
- 2024: D+29.0 2020: D+38.1 2016: D+37.3 2012: D+46.9 2008: D+49.5
Not yet ingested
- Civics
- —
Market trends
- HPI YoY
- ▼ -226.38%
- Current HPI
- 161.886
- Rent YoY
- ▲ 0.73%
- Metro
- Detroit-Warren-Dearborn, MI
- State GDP YoY
- ▲ 1.37%
- F500 in state
- 28
Industry mix (Fortune 500 HQ in MI)
| Industry | F500 HQs | Revenue |
|---|---|---|
| Automotive Parts | 3 | $48B |
|
||
| Automotive | 2 | $372B |
|
||
| Chemicals | 1 | $45B |
|
||
| Automotive Retail | 1 | $29B |
|
||
| Healthcare / Medical Devices | 1 | $23B |
|
||
| Automotive Technology | 1 | $20B |
|
||
Price history
+390.5% since first listed31 events — show timeline
- 2026-05-17 Coming Soon $103,000 MiRealSource-MiMLS
- 2026-01-07 Listing Removed — REALCOMP
- 2026-01-07 Listing Removed — MiRealSource-MiMLS
- 2025-11-04 Listed $99,000 REALCOMP
- 2025-11-03 Listed $99,000 MiRealSource-MiMLS
- 2025-10-26 Listing Removed — MiRealSource-MiMLS
- 2025-10-26 Listing Removed — REALCOMP
- 2025-08-30 Listed $109,000 MiRealSource-MiMLS
- 2025-08-30 Listed $109,000 REALCOMP
- 2025-08-25 Coming Soon — MiRealSource-MiMLS
- 2024-11-08 Sold (Public Records) $55,000 Public Records
- 2019-06-05 Listing Removed — REALCOMP
- 2019-06-05 Listing Removed — MiRealSource-MiMLS
- 2019-04-17 Sold (Public Records) $71,500 Public Records
- 2019-03-27 Listed $75,600 MiRealSource-MiMLS
- 2019-03-27 Listed $75,600 REALCOMP
- 2018-05-07 Sold (Public Records) $49,430 Public Records
- 2017-12-27 Sold (MLS) $27,500 REALCOMP
- 2017-12-27 Sold (MLS) $27,500 MiRealSource-MiMLS
- 2017-12-18 Pending — MiRealSource-MiMLS
- 2017-12-05 Price Changed $34,999 MiRealSource-MiMLS
- 2017-11-26 Price Changed $39,300 MiRealSource-MiMLS
- 2017-11-15 Price Changed $44,400 MiRealSource-MiMLS
- 2017-11-05 Listed $50,000 MiRealSource-MiMLS
- 2017-11-05 Listed $34,999 REALCOMP
- 2013-12-12 Sold (Public Records) $8,500 Public Records
- 2011-12-25 Listing Removed — MiRealSource-MiMLS
- 2010-12-24 Listed $69,000 MiRealSource-MiMLS
- 2010-10-27 Listing Removed — MiRealSource-MiMLS
- 2010-04-26 Listed $74,900 MiRealSource-MiMLS
- 1994-08-22 Sold (Public Records) $21,000 Public Records
Property tax history
+8.8%/yrLatest (2025): $3,922 · +81.6% YoY. Source: county tax records.
Cash-flow waterfall
monthlySold comps — $/sqft
last 12 mo · ≤1 miLoading sold comps…