 🏷️ Likely Rental
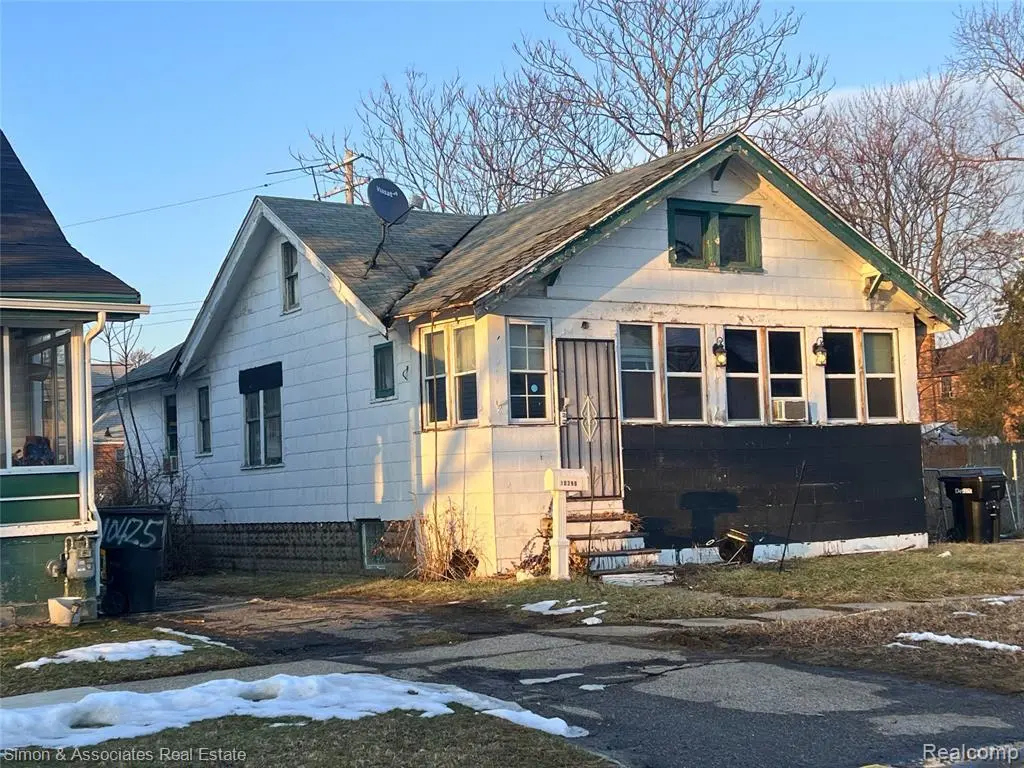
10398 Violetlawn St · Detroit, MI
Flood risk 1/10 · Minimal
- FEMA flood zone
- X (unshaded)
- Chance of flooding over 30 yrs
- 0.0%
- Est. flood insurance / yr
- $473 – $860
Fire risk 1/10 · Minimal
- Est. fire insurance / yr
- $784 – $1,456
Heat risk 3/10 · Minor
- Hot days now (above 97°F)
- 7 days/yr
- Hot days in 30 yrs
- 15 days/yr
Wind risk 2/10 · Minimal
- Chance of severe wind over 30 yrs
- —
Air-quality risk 3/10 · Minor
- Unhealthy air days now
- 2 days/yr
- Unhealthy air days in 30 yrs
- 5 days/yr
Risk factors via First Street. Map © Google.
Why this score? — see what drove the C- grade
The composite is a weighted blend of 9 inputs, each scored 0–100. Each bar is that input's sub-score; the figure is the points it added to the 100-point composite (weight × sub-score).
- Cash flow +15.0/30.0
- Appreciation +10.0/10.0
- ARV discount +7.5/15.0
- 1% rule +5.0/10.0
- DSCR +5.0/10.0
- Livability +3.7/5.0
- Rent growth +2.5/5.0
- Condition / age +2.5/5.0
- Schools +1.3/10.0
$19,900
🖨 Deal sheet 📄 Offer letter ✓ Due diligence
Listing remarks
Excellent investment opportunity at 10398 Violetlawn Street in Detroit featuring a tenant-occupied property with immediate income potential. This property is ideal for investors looking to expand their rental portfolio or add a cash-flowing asset in a growing Detroit market. Buyer will assume current occupancy at closing. The seller has never occupied the property, and the home is being sold strictly as-is. No repairs, warranties, or concessions will be provided by the seller. Purchasers are encouraged to perform their own due diligence regarding the property, tenancy, and condition prior to submitting an offer. Conveniently located near major roads, shopping centers, restaurants, schools,
Key facts
- 4,356 sq ft lot
- Built 1923
- Listed 37 days
Property features AI
Finance
- Other: Listed by Simon & Associates Real Estate
Exterior
- Parking: No garage
- Utilities: Public water; Public sewer
- Home design: Single-family residence; One and one-half story; Ground-level entry with steps
- Construction: Aluminum siding; Block foundation
- Exterior features: Paved road access; Lot dimensions approximately 45 x 100 (0.1 acre)
Interior
- Kitchen: Gas cooktop; Free-standing refrigerator
- Bedrooms: Total of 3 rooms (includes living spaces and bedrooms)
- Bathrooms: 1 full bathroom
- Heating & cooling: Forced air heating (natural gas); Window air conditioning units
- Interior features: Free-standing refrigerator; Gas cooktop; Unfinished basement
Neighborhood map
What this means for you Summary
Snapshot
- This is a 3-bed/1.0-bath single-family listed at $20k.
Deal economics
- At list price, monthly cash flow is $735 ($9k/yr) — positive.
- The deal already cash-flows at list — no discount required.
- Meets the 1% rule at list price ($1k rent vs $20k).
- Recommended offer: $19k (3.0% below list) — sets the bar for market timing.
- Cap rate 50.6% vs local median 10.2% in Detroit — top-decile yield for the area; either an underpriced asset or a hidden risk that comps aren't pricing in. Stress-test before assuming the spread holds.
Location & tenants
- Location reads 73/100 on livability (#218 in MI) — a middle-class / working-renter tenant base. Strengths: amenities A+, commute A+, cost of living A+; Watch: schools F, crime F, employment F.
- Detroit Public Schools Community District (urban): math 10% / reading 24% proficiency, ranked #499 of 540 in MI (top 92%) — low school quality limits family demand, transient renter base, plan for 1-2y turnover; 90% free/reduced lunch — lower-income household profile, screen leases tightly.
- Market conditions: 244 active listings in the ZIP; 25 comparable units currently listed for rent nearby; rentals lingering (median 44d on market — plan ~5-8 weeks vacancy on turnover, expect pricing pressure); 60% of comp listings sitting > 30 days — soft ceiling on asking rent; lower-income renter base — watch delinquency; 2,639 units permitted in Wayne County in 2024 (1,216 in 5+ unit buildings).
- This rent runs 38% of the median local income ($34k/yr) — at the standard rent-burdened threshold; future hikes will face affordability resistance.
Forward outlook
- In year one you build about $2k of equity ($138 loan paydown + $2k appreciation (10.0% local appreciation)).
- Wayne County population projected at -17% by 2050 — secular population decline; favor cash flow + early exit over multi-decade hold.
- At projected returns (10.0% appreciation + 3.0% rent growth), your $6k cash investment doubles in ~1 year — after that, you're playing with house money.
Negotiation context
- It's been on market 38 days — a 3% lower offer ($19k) is reasonable based on typical stale-listing flexibility.
- 4 sale attempts; this cycle's ask is 1989900% above the opening price — seller raised mid-cycle; expect resistance to lowballs.
Risks & watch-outs
- Watch-outs: built in 1923 — expect roof / HVAC / electrical / plumbing capex.
Questions for the listing agent
- It's been on market 38 days. Have you received any prior offers? Is the seller open to a 3% concession, seller financing, or rate buy-down credit?
- Built in 1923 — when were the roof, HVAC, electrical panel, plumbing, and water heater last replaced?
- Is there a deadline driving the sale (1031 exchange, divorce, estate, relocation)? That informs how much negotiation room exists.
- Schools are F-rated, which usually means shorter tenancies and higher turnover. Who's the typical renter profile here, and what's been the actual vacancy rate?
- Crime grade is F in this area — have there been break-ins, vandalism, or insurance claims at this property in the last 3 years? What carrier currently insures it and at what premium?
- What's the average days-on-market for RENTAL listings here right now (not sales)? A rising rental-DOM trend means longer vacancies and softer asking-rent achievability than the comps imply.
- What's the recent tenant-quality profile in this submarket — average credit score on applications, eviction rate, late-payment / NSF rate, and stable-employment percentage? A property-management company in the area should have these aggregated.
- How much new for-sale + rental construction is in the pipeline within 1–3 miles? Heavy new supply typically softens prices + rents 12–24 months out; constrained supply supports both.
Investment metrics
- 1% rule
- 5.55% ✓
- Cap rate
- 50.60%
- Cash-on-cash
- 158.23%
- DSCR
- 8.04
- GRM
- 1.5
CMA / ARV
- ARV (median comp)
- $47,245
- List price
- $19,900
- Delta
- -57.88%
- Verdict
- UNDERPRICED
- Comps
- 20 within 1.0 mi
Show comp detail 12 sales within ~0.75 mi
| Address | Dist | Beds/Ba | Sqft | Sold | Price | $/sf | Match |
|---|---|---|---|---|---|---|---|
| 11437 Manor St | 0.41mi | 3/1.0 | 1,006 (+5%) | 5mo | $53,900 | $54 | 69 |
| 10300 Orangelawn St | 0.13mi | 3/1.0 | 1,092 (+14%) | 4mo | $52,000 | $48 | 67 |
| 8691 Elmira St | 0.41mi | 3/1.0 | 1,001 (+4%) | 10mo | $35,000 | $35 | 66 |
| 11337 Steel St | 0.45mi | 3/1.0 | 880 (-8%) | 1mo | $35,000 | $40 | 64 |
| 9366 Steel St | 0.39mi | 3/1.0 | 900 (-6%) | 10mo | $59,000 | $66 | 64 |
| 9222 Hartwell St | 0.73mi | 3/1.0 | 1,000 (+4%) | 5mo | $70,000 | $70 | 54 |
| 11642 Griggs St | 0.46mi | 2/1.0 (-1) | 1,056 (+10%) | 7mo | $9,000 | $9 | 51 |
| 9614 Schaefer Hwy | 0.71mi | 3/1.0 | 909 (-5%) | 10mo | $60,000 | $66 | 50 |
| 11318 Littlefield St | 0.64mi | 2/1.0 (-1) | 877 (-9%) | 5mo | $57,500 | $66 | 46 |
| 11695 Kentucky St | 0.58mi | 2/1.5 (-1) | 912 (-5%) | 14mo | $25,000 | $27 | 46 |
| 11717 Kentucky St | 0.59mi | 2/1.0 (-1) | 1,034 (+8%) | 14mo | $13,000 | $13 | 43 |
| 9330 Hartwell St | 0.69mi | 3/1.0 | 1,089 (+13%) | 11mo | $62,500 | $57 | 36 |
Match score weights: distance 35% · size 25% · config 20% · recency 20%. Top-matched comps best support the ARV.
Projected returns pro-forma
10.0% appreciation · 3.0% rent growth · sell at horizon
- IRR
- —
- Equity multiple
- 11.35×
- Total profit
- $57,650
- Equity at exit
- $17,927
- IRR
- —
- Equity multiple
- 24.87×
- Total profit
- $133,003
- Equity at exit
- $38,661
Cash invested: $5,572 (down + closing). Projections, not guarantees.
Landlord ↔ Tenant lean methodology
- Overall (STATE)
- 62 Landlord-Friendly
- State Michigan
- 62 Landlord-Friendly · EVEN
- County
- — inherits STATE
- City
- — inherits STATE
ZIP-level market 48204
- Home prices YoY
- 18.5%
- Active inventory
- 244
- Price-to-rent
- 1.5×
Monthly cashflow live
- Estimated rent
- $1,104 high interval (Pro) →
- Mortgage (P&I)
- −$104
- Tax est. 1.5%
- −$25 /mo · $298/yr
- Insurance
- −$8
- HOA
- −$0
- Vacancy / Maint / Mgmt
- −$232
- Net cashflow
- $735
Break-even live
UW: 25.0% down · 7.5% · 30yr · 1.5% tax · 5.0% vac · 8.0% maint · 8.0% mgmt
Financing live
Cash to close
- Down payment
- $4,975
- Closing costs
- $597
- Reserves months
- —
- Total cash needed
- —
Loan-product check · same deal, 3 products live
Conventional
25% down · 7.5% · 30yr
- Down + closing
- —
- Monthly P&I
- —
- Monthly cashflow
- —
- DSCR
- —
- Eligible?
- —
Personal DTI + credit; lowest rate.
DSCR
20% down · 8.5% · 30yr
- Down + closing
- —
- Monthly P&I
- —
- Monthly cashflow
- —
- DSCR
- —
- Eligible?
- —
No personal income docs; deal must DSCR.
Hard money
10% down · 12.0% · 12mo
- Down + closing
- —
- Monthly P&I
- —
- Monthly cashflow
- —
- DSCR
- —
- Eligible?
- —
Short-term bridge; refi at stabilization.
Rent comps 25 comps
| Address | Beds | Baths | Sqft | Rent | $/sqft | DOM | Units | Dist |
|---|---|---|---|---|---|---|---|---|
| 10345 Crocuslawn Ave Unit 2 Detroit, MI | 2.0 | 1.0 | 850 | $950 | $1.12 | 43d | 1 | 0.07mi |
| 10303 Morley St #1 Detroit, MI | 2.0 | 1.0 | 950 | $950 | $1.00 | 43d | 1 | 0.15mi |
| 9558 Meyers Rd Detroit, MI | 3.0 | 1.0 | 950 | $1,150 | $1.21 | 43d | 1 | 0.20mi |
| 10002 Manor Unit 2 Detroit, MI | 3.0 | 1.0 | 1100 | $1,150 | $1.05 | 43d | 1 | 0.21mi |
| 10002 Manor Unit 1 Detroit, MI | 2.0 | 1.0 | 1000 | $1,050 | $1.05 | 43d | 1 | 0.21mi |
| 9353 Kentucky St Detroit, MI | 2.0 | 1.0 | 800 | $999 | $1.25 | 17d | 1 | 0.41mi |
| 12775 Plymouth Rd Unit 16 Detroit, MI | 2.0 | 1.0 | 1009 | $825 | $0.82 | 43d | 1 | 0.43mi |
| 9340 Hartwell St Detroit, MI | 3.0 | 1.0 | 1000 | $1,364 | $1.36 | 43d | 1 | 0.68mi |
| 9022 Northlawn St Detroit, MI | 2.0 | 1.0 | 1100 | $1,300 | $1.18 | 24d | 1 | 0.78mi |
| 13717 Keal St Detroit, MI | 2.0 | 1.0 | 799 | $1,000 | $1.25 | 43d | 1 | 0.80mi |
| 12468 Mendota St Detroit, MI | 2.0 | 1.0 | 1100 | $1,100 | $1.00 | 43d | 1 | 0.83mi |
| 12468 Mendota St Detroit, MI | 2.0 | 1.0 | 1100 | $1,000 | $0.91 | 24d | 1 | 0.83mi |
| 8283 Pinehurst St Unit 2 Detroit, MI | 2.0 | 1.0 | 1000 | $900 | $0.90 | 43d | 1 | 0.89mi |
| 8544 Cloverlawn St Detroit, MI | 2.0 | 1.0 | 800 | $800 | $1.00 | 17d | 1 | 1.00mi |
| 8353 Alpine St Detroit, MI | 2.0 | 1.0 | 1000 | $1,050 | $1.05 | 43d | 1 | 1.17mi |
| 9590 Marlowe St Detroit, MI | 2.0 | 1.0 | 877 | $1,430 | $1.63 | 43d | 1 | 1.25mi |
| 14740 W Chicago Unit B Detroit, MI | 2.0 | 1.0 | 900 | $845 | $0.94 | 43d | 1 | 1.32mi |
| 12032 Santa Rosa Dr Unit 1 Detroit, MI | 3.0 | 1.0 | 900 | $1,423 | $1.58 | 5d | 1 | 1.32mi |
| 9917 Woodside St Apt 1 Detroit, MI | 2.0 | 1.0 | 800 | $800 | $1.00 | 43d | 1 | 1.34mi |
| 12019 Stoepel St Detroit, MI | 2.0 | 1.0 | 1000 | $943 | $0.94 | 5d | 1 | 1.34mi |
| 12415 Monica St Detroit, MI | 2.0 | 1.0 | 1000 | $1,200 | $1.20 | 43d | 1 | 1.40mi |
| 12039 Lauder St Detroit, MI | 3.0 | 1.5 | 1000 | $1,500 | $1.50 | 24d | 1 | 1.44mi |
| 10015 Robson St Detroit, MI | 3.0 | 2.0 | 1000 | $1,400 | $1.40 | 18d | 1 | 1.45mi |
| 9789 Chenlot St Unit 1 Detroit, MI | 2.0 | 1.0 | 1000 | $1,000 | $1.00 | 5d | 1 | 1.48mi |
| 9386 Coyle St Detroit, MI | 3.0 | 1.0 | 1000 | $1,300 | $1.30 | 2d | 1 | 1.49mi |
Listing history 18 events
-
2026-06-15days on market $19,900 Active 38 DOM
-
2026-06-13days on market $19,900 Active 36 DOM
-
2026-06-13days on market $19,900 Active 35 DOM
-
2026-06-09days on market $19,900 Active 32 DOM
-
2026-06-08days on market $19,900 Active 31 DOM
-
2026-06-07days on market $19,900 Active 30 DOM
-
2026-06-04days on market $19,900 Active 27 DOM
-
2026-06-03days on market $19,900 Active 26 DOM
-
2026-06-02pricedays on market $19,900 Active 25 DOM
-
2026-06-01days on market $1 Active 24 DOM
-
2026-05-31days on market $1 Active 23 DOM
-
2026-05-09historical
-
2026-05-09historical
-
2026-05-08$1 Active
-
2026-05-08$1 Active
-
2026-04-07$20,000 Active
-
2026-04-07$20,000 Active
-
2026-04-04historical
ⓘ Source: listings_history table (triggers on properties + properties_extension) + one-shot
backfill from property_details.listing_events for pre-trigger history.
Climate risk First Street
- Flood 1/10 Low FEMA zone X (unshaded) · 0% chance over 30 yrs
- Wildfire 1/10 Low
- Heat 3/10 Moderate 7 d/yr ≥97°F today · 15 d/yr by 30 yrs out
- Wind 2/10 Low
- Air quality 3/10 Moderate 2 unhealthy d/yr today · 5 by 30 yrs out
Nearby sold comps map
Loading sold comps map…
Walkable amenities ~0.75 mi
Loading nearby amenities…
Taxation est. · year 1
- Rental income
- $13,249
- − Mortgage interest
- −$1,115
- − Property taxes
- −$298
- − Insurance
- −$100
- − Repairs & maintenance
- −$1,060
- − Management
- −$1,060
- − Depreciation
- −$579
- Taxable income
- $9,038
- Est. tax owed @ 24.0%
- −$2,169
- After-tax cash flow
- $6,648/yr
For passive investors: Depreciation is non-cash, so a rental often shows a tax loss while cash-flowing — sheltering income. Rental losses are passive: they offset passive income freely, and up to $25,000/yr can offset ordinary (W-2) income if you actively participate and your MAGI is under $100k (phasing out to $0 by $150k); unused losses carry forward. On sale, claimed depreciation is recaptured at up to 25%, and gains may owe capital-gains tax (a 1031 exchange can defer both). Figures are a year-1 estimate at your 24.0% rate — not tax advice; consult a CPA.
Schools (NCES district)
- District
- Detroit Public Schools Community District
- NCES district ID
- 2601103
- Math proficiency
- 10% ▼ -2.00%
- Reading proficiency
- 24% ▲ 6.00%
- Median HH income
- $25,815
- Composite
- 13.06/100
- National rank
- #9564
- State rank
- #499 of 540 in MI
Livability — Detroit
- Score
- 73/100
- State rank
- #218
- US rank
- #5427
Category grades
Schools grade is shown separately in the Schools card above.
Census & demographics
- Census place
- Detroit, MI
- County
- Wayne County · 1,562,939 people
- City population
- 572,865
- Metro
- Detroit-Warren-Dearborn, MI
- Population (ZIP)
- 20,696
- Household income
- $34,468
- Rent vs Own
- Severe rent burden
- 1418.0
Population outlook (Wayne County) Hauer SSP2
- Today (2025)
- 1,675,273 people
- By 2030
- 1,620,300 · -3.3%
- By 2040
- 1,502,341 · -10.3%
- By 2050
- 1,384,039 · -17.4%
- By 2075
- 1,124,592 · -32.9%
- By 2100
- 881,193 · -47.4%
Race, ethnicity, and origin ACS 2023
- Neighborhood character
- Predominantly Black (86%)
- Race & ethnicity
- Black 86% Two or more races 7% Hispanic / Latino 5% White 4% Native American 2%
- Hispanic origin (detail)
- Mexican 4%
- Common ancestry
- Hispanic 1% Romanian 1%
- Foreign-born
- 2% · Canada
- Languages at home
- 95% English-only · Spanish 4%
Political lean MEDSL · Wayne
- 2024 margin
- Strong D (+29.0) · D 62.7% · R 33.7% · Other 3.6%
- 2008→2024 swing
- -20.5pp toward R · 2008: 49.5pp · 2024: 29.0pp
- All cycles
- 2024: D+29.0 2020: D+38.1 2016: D+37.3 2012: D+46.9 2008: D+49.5
Not yet ingested
- Civics
- —
Market trends
- HPI YoY
- ▲ 36.51%
- Current HPI
- 234.0465
- Rent YoY
- —
- Metro
- Detroit-Warren-Dearborn, MI
- State GDP YoY
- ▲ 1.37%
- F500 in state
- 28
Industry mix (Fortune 500 HQ in MI)
| Industry | F500 HQs | Revenue |
|---|---|---|
| Automotive Parts | 3 | $48B |
|
||
| Automotive | 2 | $372B |
|
||
| Chemicals | 1 | $45B |
|
||
| Automotive Retail | 1 | $29B |
|
||
| Healthcare / Medical Devices | 1 | $23B |
|
||
| Automotive Technology | 1 | $20B |
|
||
Price history
-0.5% since first listed11 events — show timeline
- 2026-06-15 Listing Removed — REALCOMP
- 2026-06-15 Listing Removed — MiRealSource-MiMLS
- 2026-06-03 Price Changed $19,900 MiRealSource-MiMLS
- 2026-06-02 Price Changed $19,900 REALCOMP
- 2026-05-09 Listing Removed — MiRealSource-MiMLS
- 2026-05-09 Listing Removed — REALCOMP
- 2026-05-08 Listed $1 REALCOMP
- 2026-05-08 Listed $1 MiRealSource-MiMLS
- 2026-04-07 Listed $20,000 MiRealSource-MiMLS
- 2026-04-07 Listed $20,000 REALCOMP
- 2026-04-04 Coming Soon — MiRealSource-MiMLS
Property tax history
+4.2%/yrLatest (2025): $2,046 · +1.1% YoY. Source: county tax records.
Cash-flow waterfall
monthlySold comps — $/sqft
last 12 mo · ≤1 miLoading sold comps…