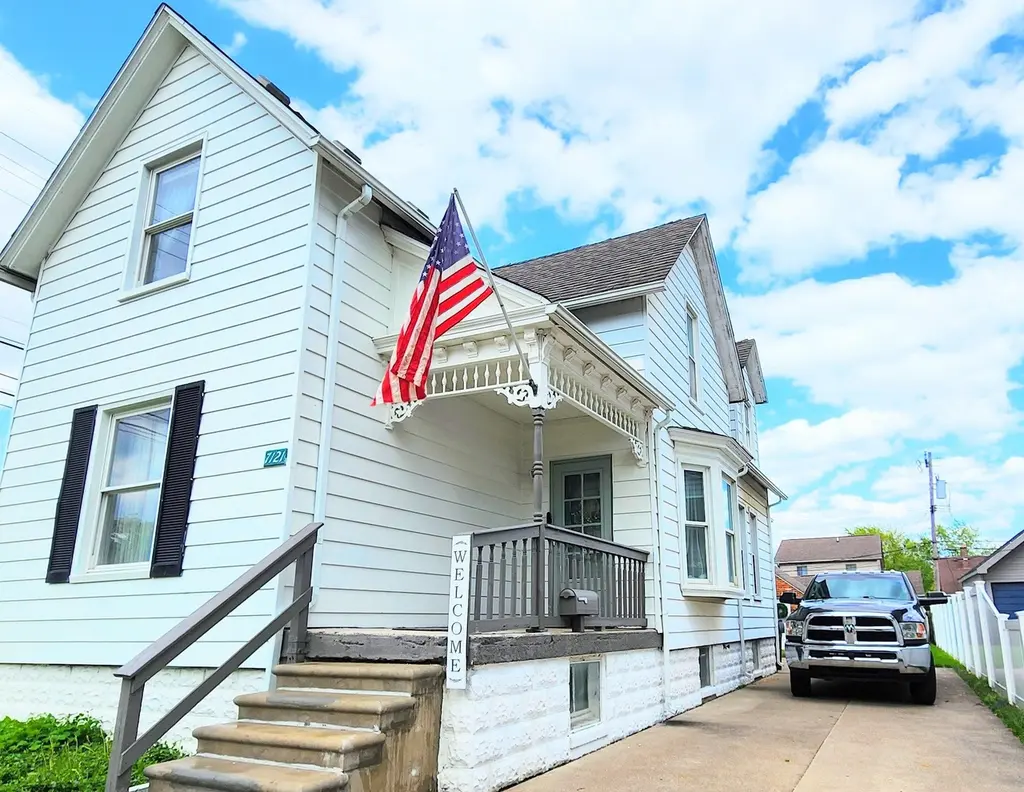
7121 Osage Dr · Allen Park, MI
Flood risk 1/10 · Minimal
- FEMA flood zone
- X (unshaded)
- Chance of flooding over 30 yrs
- 0.0%
- Est. flood insurance / yr
- $473 – $860
Fire risk 1/10 · Minimal
- Est. fire insurance / yr
- $784 – $1,456
Heat risk 3/10 · Minor
- Hot days now (above 96°F)
- 7 days/yr
- Hot days in 30 yrs
- 15 days/yr
Wind risk 2/10 · Minimal
- Chance of severe wind over 30 yrs
- —
Air-quality risk 3/10 · Minor
- Unhealthy air days now
- 2 days/yr
- Unhealthy air days in 30 yrs
- 4 days/yr
Risk factors via First Street. Map © Google.
Why this score? — see what drove the D- grade
The composite is a weighted blend of 9 inputs, each scored 0–100. Each bar is that input's sub-score; the figure is the points it added to the 100-point composite (weight × sub-score).
- Cash flow +11.1/30.0
- ARV discount +10.2/15.0
- Livability +4.5/5.0
- DSCR +3.2/10.0
- Schools +3.2/10.0
- 1% rule +2.8/10.0
- Rent growth +2.5/5.0
- Condition / age +2.5/5.0
- Appreciation +0.0/10.0
$219,900
🖨 Deal sheet (PDF) 📄 Offer letter ✓ Due diligence
Listing remarks
Better than NEW! Classic American Farmhouse close to Allen park Schools, updated with NEW driveway, NEW plumbing, NEW electrical, NEW carpeting and NEW luxury plank flooring, automatic garage door opener, newer roof and windows, but thoughtfully kept original woodwork and radiators, soaking tub and farmhouse sink in kitchen! Wonderful floor plan for entertaining, 4th bedroom is currently a home office / craft room. City Inspection has been done, and ready for new owners to love! Agent is co-owner.
Key facts
- New plumbing
- New carpeting
- Newer roof
Tags
Property features AI
Exterior
- Parking: Detached 2-car garage with garage door opener
- Utilities: Public water; Shared septic
- Home design: Single-family residence; Two levels
- Construction: Aluminum siding; Block foundation; Built with block basement
- Exterior features: Front porch; Cleared lot
Interior
- Kitchen: Refrigerator; Oven; Range; Microwave; Disposal
- Bathrooms: Two full bathrooms
- Heating & cooling: Hot water heating (natural gas); Ceiling fan(s)
- Interior features: Entrance foyer; Pantry; Bay windows; Window treatments; Full block basement with interior and exterior entry; partially finished
- Laundry & utility: Washer; Dryer; Gas water heater
Neighborhood map
What this means for you Summary
Snapshot
- This is a 4-bed/2.0-bath single-family listed at $220k.
Deal economics
- At list price, monthly cash flow is $-90 ($-1k/yr) — negative.
- To cash-flow at today's rent, offer at most $204k (7.2% below list).
- To meet the 1% rule (rent ≥ 1% of price), the offer needs to be $171k (22.2% below list).
- Recommended offer: $171k (22.2% below list) — sets the bar for 1% rule.
- Cap rate 5.8% vs local median 4.5% in Allen Park — meaningfully above typical; check what's discounted (condition, days-on-market, listing class) to confirm the premium yield is real.
Location & tenants
- Location reads 89/100 on livability (#9 in MI, #128 nationally) — a professional / high-income tenant draw. Strengths: amenities A+, commute A+, cost of living A+; Watch: schools C-.
- Allen Park Public Schools (suburban): math 24% / reading 46% proficiency, ranked #254 of 540 in MI (top 47%) — families likely to look elsewhere, expect single-tenant / working-renter base with shorter leases.
- Market conditions: 82 active listings in the ZIP; 8 comparable units currently listed for rent nearby; rentals leasing fast (median 12d on market — plan ~1-2 weeks tenant-placement turnaround); solid renter incomes; 2,639 units permitted in Wayne County in 2024 (1,216 in 5+ unit buildings).
Forward outlook
- Local home prices are declining (-3.0%/yr); year-one equity from $2k of loan paydown is wiped out by about $7k of value loss. Plan a longer hold.
- Wayne County population projected at -17% by 2050 — secular population decline; favor cash flow + early exit over multi-decade hold.
Negotiation context
- It's been on market 32 days — a 3% lower offer ($213k) is reasonable based on typical stale-listing flexibility.
- 8 sale attempts since 26y ago; this cycle's ask has dropped $20k (8%) from the opening price — seller is motivated, your offer sets the floor, not the list.
- Current owner paid $86k; list at $220k implies a 156% gain — meaningful room to come down on a strong offer.
Risks & watch-outs
- Watch-outs: built in 1938 — expect roof / HVAC / electrical / plumbing capex.
Questions for the listing agent
- What do current leases actually rent for vs. the listed asking? Can we see a recent rent roll and the last 12 months of T-12 income?
- It's been on market 32 days. Have you received any prior offers? Is the seller open to a 22% concession, seller financing, or rate buy-down credit?
- Built in 1938 — when were the roof, HVAC, electrical panel, plumbing, and water heater last replaced?
- Is there a deadline driving the sale (1031 exchange, divorce, estate, relocation)? That informs how much negotiation room exists.
- The area grade is low — what's the realistic commute time and amenity access for the typical tenant pool here? Any planned neighborhood developments (good or bad) we should know about?
- What's the average days-on-market for RENTAL listings here right now (not sales)? A rising rental-DOM trend means longer vacancies and softer asking-rent achievability than the comps imply.
- What's the recent tenant-quality profile in this submarket — average credit score on applications, eviction rate, late-payment / NSF rate, and stable-employment percentage? A property-management company in the area should have these aggregated.
- How much new for-sale + rental construction is in the pipeline within 1–3 miles? Heavy new supply typically softens prices + rents 12–24 months out; constrained supply supports both.
Investment metrics
- 1% rule
- 0.78% ✗
- Cap rate
- 5.80%
- Cash-on-cash
- -1.75%
- DSCR
- 0.92
- GRM
- 10.7
CMA / ARV
- ARV (median comp)
- $234,111
- List price
- $219,900
- Delta
- -6.07%
- Verdict
- FAIR
- Comps
- 20 within 1.0 mi
Show comp detail 12 sales within ~0.75 mi
| Address | Dist | Beds/Ba | Sqft | Sold | Price | $/sf | Match |
|---|---|---|---|---|---|---|---|
| 7169 Ziegler St | 0.50mi | 4/1.5 | 1,366 (0%) | 4mo | $164,000 | $120 | 72 |
| 6642 Shenandoah Ave | 0.26mi | 3/1.0 (-1) | 1,294 (-5%) | 6mo | $177,500 | $137 | 65 |
| 7510 Balfour Ave | 0.29mi | 3/2.0 (-1) | 1,501 (+10%) | 6mo | $200,000 | $133 | 60 |
| 15777 Mclain Ave | 0.47mi | 3/1.5 (-1) | 1,312 (-4%) | 6mo | $250,000 | $191 | 59 |
| 16207 Cleophus Ave | 0.54mi | 3/1.5 (-1) | 1,275 (-7%) | 1mo | $150,000 | $118 | 56 |
| 8027 Kolb Ave | 0.38mi | 3/1.5 (-1) | 1,527 (+12%) | 7mo | $210,000 | $138 | 50 |
| 6764 Jackson St | 0.61mi | 3/2.0 (-1) | 1,250 (-8%) | 4mo | $157,500 | $126 | 49 |
| 7861 Robinson Ave | 0.46mi | 3/1.5 (-1) | 1,527 (+12%) | 7mo | $140,000 | $92 | 46 |
| 17308 Helen St | 0.63mi | 3/2.0 (-1) | 1,526 (+12%) | 2mo | $246,000 | $161 | 44 |
| 6345 Kolb Ave | 0.56mi | 3/1.5 (-1) | 1,529 (+12%) | 5mo | $267,500 | $175 | 43 |
| 15573 Thomas Ave | 0.60mi | 3/2.0 (-1) | 1,189 (-13%) | 8mo | $225,000 | $189 | 39 |
| 6028 Jane Ave | 0.70mi | 3/1.5 (-1) | 1,185 (-13%) | 7mo | $192,000 | $162 | 33 |
Match score weights: distance 35% · size 25% · config 20% · recency 20%. Top-matched comps best support the ARV.
Projected returns pro-forma
-3.0% appreciation · 3.0% rent growth · sell at horizon
- IRR
- -19.2%
- Equity multiple
- 0.33×
- Total profit
- $-41,371
- Equity at exit
- $32,788
- IRR
- -11.9%
- Equity multiple
- 0.29×
- Total profit
- $-43,477
- Equity at exit
- $19,013
Cash invested: $61,572 (down + closing). Projections, not guarantees.
Landlord ↔ Tenant lean methodology
- Overall (STATE)
- 62 Landlord-Friendly
- State Michigan
- 62 Landlord-Friendly · EVEN
- County
- — inherits STATE
- City
- — inherits STATE
ZIP-level market 48101
- Active inventory
- 82
- Price-to-rent
- 10.7×
Monthly cashflow live
- Estimated rent
- $1,710 high interval (Pro) →
- Mortgage (P&I)
- −$1,153
- Tax from tax record
- −$196 /mo · $2,347/yr
- Insurance
- −$92
- HOA
- −$0
- Vacancy / Maint / Mgmt
- −$359
- Net cashflow
- $-90
Break-even live
Sensitivity live
| Price | -10% $35 | -5% $-27 | +0% $-90 | +5% $-152 | +10% $-214 |
|---|---|---|---|---|---|
| Rent | -10% $-225 | -5% $-157 | +0% $-90 | +5% $-22 | +10% $45 |
| Rate | -1.0pp $21 | -0.5pp $-34 | base $-90 | +0.5pp $-147 | +1.0pp $-205 |
UW: 25.0% down · 7.5% · 30yr · 1.5% tax · 5.0% vac · 8.0% maint · 8.0% mgmt
Financing live
Cash to close
- Down payment
- $54,975
- Closing costs
- $6,597
- Reserves months
- —
- Total cash needed
- —
Loan-product check · same deal, 3 products live
Conventional
25% down · 7.5% · 30yr
- Down + closing
- —
- Monthly P&I
- —
- Monthly cashflow
- —
- DSCR
- —
- Eligible?
- —
Personal DTI + credit; lowest rate.
DSCR
20% down · 8.5% · 30yr
- Down + closing
- —
- Monthly P&I
- —
- Monthly cashflow
- —
- DSCR
- —
- Eligible?
- —
No personal income docs; deal must DSCR.
Hard money
10% down · 12.0% · 12mo
- Down + closing
- —
- Monthly P&I
- —
- Monthly cashflow
- —
- DSCR
- —
- Eligible?
- —
Short-term bridge; refi at stabilization.
Rent comps 8 comps
| Address | Beds | Baths | Sqft | Rent | $/sqft | DOM | Units | Dist |
|---|---|---|---|---|---|---|---|---|
| 15806 Meyer Ave Allen Park, MI | 3.0 | 2.0 | 1100 | $1,650 | $1.50 | 2d | 1 | 0.82mi |
| 9725 Ruth Allen Park, MI | 3.0 | 1.5 | 1110 | $1,800 | $1.62 | 3d | 1 | 0.93mi |
| 5371 Culver St Dearborn Heights, MI | 3.0 | 1.0 | 980 | $1,450 | $1.48 | 2d | 1 | 1.16mi |
| 5371 Culver St Dearborn Heights, MI | 3.0 | 1.0 | 980 | $1,500 | $1.53 | 11d | 1 | 1.16mi |
| 9814 Quandt Ave Allen Park, MI | 3.0 | 2.0 | 1050 | $1,800 | $1.71 | 44d | 1 | 1.35mi |
| 9725 Fox Ave Allen Park, MI | 3.0 | 1.5 | 940 | $1,850 | $1.97 | 44d | 1 | 1.48mi |
| 4565 Fleming St Dearborn Heights, MI | 3.0 | 1.0 | 1200 | $1,600 | $1.33 | 11d | 1 | 1.48mi |
| 4704 Jackson St Dearborn Heights, MI | 3.0 | 1.0 | 1000 | $1,500 | $1.50 | 22d | 1 | 1.49mi |
Listing history 29 events
-
2026-06-17status $219,900 Pending 32 DOM
-
2026-06-16days on market $219,900 Active Under Contract 32 DOM
-
2026-06-15days on market $219,900 Active Under Contract 31 DOM
-
2026-06-13days on market $219,900 Active Under Contract 29 DOM
-
2026-06-13days on market $219,900 Active Under Contract 28 DOM
-
2026-06-09days on market $219,900 Active Under Contract 25 DOM
-
2026-06-08days on market $219,900 Active Under Contract 24 DOM
-
2026-06-07statusdays on market $219,900 Active Under Contract 23 DOM
-
2026-06-04days on market $219,900 Active 20 DOM
-
2026-06-03days on market $219,900 Active 19 DOM
-
2026-06-02days on market $219,900 Active 18 DOM
-
2026-06-01days on market $219,900 Active 17 DOM
-
2026-05-31pricedays on market $219,900 Active 16 DOM
-
2026-05-16$239,900 Active 501-char remark
-
2005-11-30historical
-
2005-09-30$149,900
-
2005-07-26historical
-
2005-06-28historical
-
2005-05-26$139,900
-
2005-05-26$149,900
-
2005-04-28historical
-
2005-04-28historical
-
2005-03-01$149,900
-
2005-02-28$149,900
-
2000-09-20soldstatus $86,000
-
2000-07-28soldstatus $86,000
-
2000-07-28soldstatus $86,000
-
2000-06-18$92,900
-
2000-06-18$92,900
ⓘ Source: listings_history table (triggers on properties + properties_extension) + one-shot
backfill from property_details.listing_events for pre-trigger history.
Tax reassessment forecast MI · Partial reset (capped growth)
- Current annual tax
- $2,347 · $196/mo
- Projected year-2 tax
- $2,867 · $239/mo
- Expected delta
- +$520/yr (+$43/mo · 22.1%)
ⓘ Screening estimate from a state-policy table — verify with the county assessor before closing.
Climate risk First Street
- Flood 1/10 Low FEMA zone X (unshaded) · 0% chance over 30 yrs
- Wildfire 1/10 Low
- Heat 3/10 Moderate 7 d/yr ≥96°F today · 15 d/yr by 30 yrs out
- Wind 2/10 Low
- Air quality 3/10 Moderate 2 unhealthy d/yr today · 4 by 30 yrs out
Nearby sold comps map
Loading sold comps map…
Walkable amenities ~0.75 mi
Loading nearby amenities…
Taxation est. · year 1
- Rental income
- $20,517
- − Mortgage interest
- −$12,318
- − Property taxes
- −$2,347
- − Insurance
- −$1,100
- − Repairs & maintenance
- −$1,641
- − Management
- −$1,641
- − Depreciation
- −$6,397
- Taxable loss
- −$4,928
- Est. tax savings @ 24.0%
- +$1,183
- After-tax cash flow
- $106/yr
For passive investors: Depreciation is non-cash, so a rental often shows a tax loss while cash-flowing — sheltering income. Rental losses are passive: they offset passive income freely, and up to $25,000/yr can offset ordinary (W-2) income if you actively participate and your MAGI is under $100k (phasing out to $0 by $150k); unused losses carry forward. On sale, claimed depreciation is recaptured at up to 25%, and gains may owe capital-gains tax (a 1031 exchange can defer both). Figures are a year-1 estimate at your 24.0% rate — not tax advice; consult a CPA.
Schools (NCES district)
- District
- Allen Park Public Schools
- NCES district ID
- 2602520
- Math proficiency
- 24% ▼ -14.00%
- Reading proficiency
- 46% ▼ -4.00%
- Median HH income
- $64,196
- Composite
- 31.62/100
- National rank
- #5941
- State rank
- #254 of 540 in MI
Livability — Allen Park
- Score
- 89/100
- State rank
- #9
- US rank
- #128
Category grades
Schools grade is shown separately in the Schools card above.
Census & demographics
- Census place
- Allen Park, MI
- County
- Wayne County · 1,562,939 people
- City population
- 27,925
- Metro
- Detroit-Warren-Dearborn, MI
- Population (ZIP)
- 27,925
- Household income
- $81,655
- Rent vs Own
- Severe rent burden
- 142.0
Population outlook (Wayne County) Hauer SSP2
- Today (2025)
- 1,675,273 people
- By 2030
- 1,620,300 · -3.3%
- By 2040
- 1,502,341 · -10.3%
- By 2050
- 1,384,039 · -17.4%
- By 2075
- 1,124,592 · -32.9%
- By 2100
- 881,193 · -47.4%
Race, ethnicity, and origin ACS 2023
- Neighborhood character
- Predominantly White (77%)
- Race & ethnicity
- White 77% Hispanic / Latino 13% Two or more races 8% Black 5% Asian 1%
- Hispanic origin (detail)
- Mexican 10%
- Common ancestry
- Romanian 14% Lithuanian 3% Slovak 3%
- Foreign-born
- 5% · Canada
- Languages at home
- 89% English-only · Spanish 7% Other Indo-European 2% Russian/Polish/Slavic 1%
Political lean MEDSL · Wayne
- 2024 margin
- Strong D (+29.0) · D 62.7% · R 33.7% · Other 3.6%
- 2008→2024 swing
- -20.5pp toward R · 2008: 49.5pp · 2024: 29.0pp
- All cycles
- 2024: D+29.0 2020: D+38.1 2016: D+37.3 2012: D+46.9 2008: D+49.5
Not yet ingested
- Civics
- —
Market trends
- HPI YoY
- ▼ -170.93%
- Current HPI
- 215.3923
- Rent YoY
- —
- Metro
- Detroit-Warren-Dearborn, MI
- State GDP YoY
- ▲ 1.37%
- F500 in state
- 28
Industry mix (Fortune 500 HQ in MI)
| Industry | F500 HQs | Revenue |
|---|---|---|
| Automotive Parts | 3 | $48B |
|
||
| Automotive | 2 | $372B |
|
||
| Chemicals | 1 | $45B |
|
||
| Automotive Retail | 1 | $29B |
|
||
| Healthcare / Medical Devices | 1 | $23B |
|
||
| Automotive Technology | 1 | $20B |
|
||
Price history
+136.7% since first listed19 events — show timeline
- 2026-06-17 Pending — REALCOMP
- 2026-06-05 Contingent — REALCOMP
- 2026-05-30 Price Changed $219,900 REALCOMP
- 2026-05-16 Listed $239,900 REALCOMP
- 2005-11-30 Listing Removed — REALCOMP
- 2005-09-30 Listed $149,900 REALCOMP
- 2005-07-26 Listing Removed — MiRealSource-MiMLS
- 2005-06-28 Listing Removed — REALCOMP
- 2005-05-26 Listed $149,900 REALCOMP
- 2005-05-26 Listed $139,900 MiRealSource-MiMLS
- 2005-04-28 Listing Removed — REALCOMP
- 2005-04-28 Listing Removed — MiRealSource-MiMLS
- 2005-03-01 Listed $149,900 REALCOMP
- 2005-02-28 Listed $149,900 MiRealSource-MiMLS
- 2000-09-20 Sold (Public Records) $86,000 Public Records
- 2000-07-28 Sold (MLS) $86,000 MiRealSource-MiMLS
- 2000-07-28 Sold (MLS) $86,000 REALCOMP
- 2000-06-18 Listed $92,900 MiRealSource-MiMLS
- 2000-06-18 Listed $92,900 REALCOMP
Property tax history
+3.0%/yrLatest (2025): $2,347 · +2.7% YoY. Source: county tax records.
Cash-flow waterfall
monthlySold comps — $/sqft
last 12 mo · ≤1 miLoading sold comps…