66 9th St E #1605 · St. Paul, MN
Flood risk No data
- FEMA flood zone
- —
- Chance of flooding over 30 yrs
- —
- Est. flood insurance / yr
- —
Fire risk No data
- Est. fire insurance / yr
- —
Heat risk No data
- Hot days now (above threshold)
- —
- Hot days in 30 yrs
- —
Wind risk No data
- Chance of severe wind over 30 yrs
- —
Air-quality risk No data
- Unhealthy air days now
- —
- Unhealthy air days in 30 yrs
- —
Risk factors via First Street. Map © Google.
Why this score? — see what drove the C- grade
The composite is a weighted blend of 9 inputs, each scored 0–100. Each bar is that input's sub-score; the figure is the points it added to the 100-point composite (weight × sub-score).
- Cash flow +16.6/30.0
- 1% rule +10.0/10.0
- ARV discount +7.5/15.0
- DSCR +5.2/10.0
- Rent growth +2.6/5.0
- Livability +2.5/5.0
- Condition / age +2.5/5.0
- Appreciation +2.4/10.0
- Schools +2.4/10.0
$98,500
🖨 Deal sheet 📄 Offer letter ✓ Due diligence
Listing remarks MLS
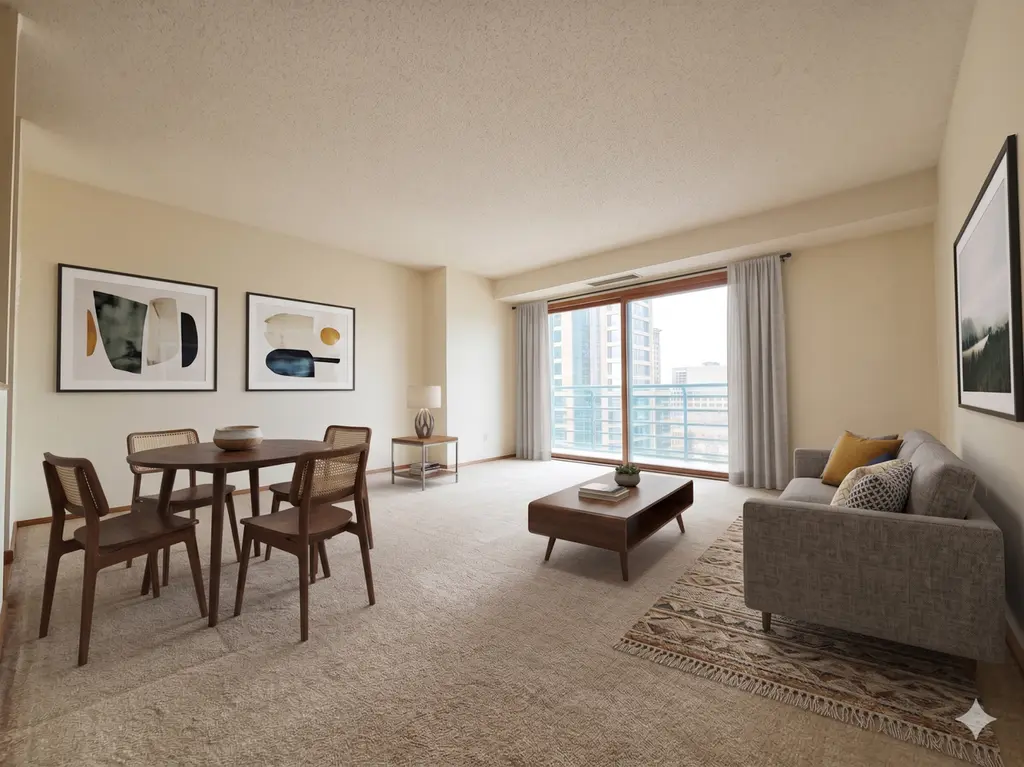
Experience true urban living at City Walk Condominiums in Downtown St. Paul where convenience, culture, and walkability come together in one of the Twin Cities' most connected locations. This isn't just a condo - it's a lifestyle in the heart of St. Paul where everything from dinner to concerts to river walks is just steps away! Lock and Leave, Walkable, Down-Town Living. This well-appointed condo offers a low-maintenance lifestyle with direct access to the Saint Paul Skyway System, allowing you to navigate miles of indoor walkways to dining, shopping, and services - ideal for year-round Minnesota living. Step outside your door and enjoy everything that makes downtown Saint Paul vibrant and livable. You’re just minutes from world-class entertainment at the Ordway Center for the Performing Arts, live events and NHL games at the Xcel Energy Center, and year-round community gatherings in Rice Park. The nearby Mississippi Riverfront offers scenic walking and biking trails, while Lowertown brings farmers markets, festivals, and a strong sense of community. Dining options are just steps away, including local favorites like Cossetta Alimentari, along with a variety of restaurants, cafés, and nightlife destinations that define the downtown experience. Commuting is simple with easy access to the METRO Green Line light rail, connecting both downtowns and the surrounding metro. Whether you’re heading to work, a game, or a night out, everything is within reach. Perfect for professionals, downsizers, or anyone seeking a vibrant, walkable lifestyle, this condo offers the opportunity to enjoy the best of Saint Paul with ease and convenience. This is a 1 Bedroom 1 Bathroom with beautiful West facing city views. Live where everything happens.
Key facts
- Downtown st paul
- $552 HOA
- Garage
Tags
Neighborhood map
What this means for you Summary
Snapshot
- This is a 1-bed/1.0-bath condo listed at $98k.
Deal economics
- At list price, monthly cash flow is $60 ($718/yr) — positive.
- The deal already cash-flows at list — no discount required.
- Meets the 1% rule at list price ($2k rent vs $98k).
- Recommended offer: $96k (3.0% below list) — sets the bar for market timing.
Location & tenants
- Location reads: area grade C — affects rentability + tenant quality, not the cash-flow math above.
- St. Paul Public School District (urban): math 21% / reading 33% proficiency, ranked #270 of 301 in MN (top 90%) — low school quality limits family demand, transient renter base, plan for 1-2y turnover; 64% free/reduced lunch — lower-income household profile, screen leases tightly.
- Market conditions: Rents flat; 77 active listings in the ZIP; 11 comparable units currently listed for rent nearby; rentals leasing fast (median 2d on market — plan ~1-2 weeks tenant-placement turnaround); 1,202 units permitted in Ramsey County in 2024 (880 in 5+ unit buildings).
- This rent runs 32% of the median local income ($65k/yr) — at the standard rent-burdened threshold; future hikes will face affordability resistance.
Forward outlook
- Local home prices are declining (-3.0%/yr); year-one equity from $681 of loan paydown is wiped out by about $3k of value loss. Plan a longer hold.
- Ramsey County population projected at +27% by 2050 — long-run rental-demand tailwind backs the buy-and-hold thesis.
Negotiation context
- It's been on market 59 days — a 3% lower offer ($96k) is reasonable based on typical stale-listing flexibility.
- 2 sale attempts since 20y ago with the ask held roughly flat each time — persistent listings suggest the price (not the market) is what's stuck; bring a comps-based counter.
Risks & watch-outs
- Watch-outs: HOA is 32% of rent.
Questions for the listing agent
- It's been on market 59 days. Have you received any prior offers? Is the seller open to a 3% concession, seller financing, or rate buy-down credit?
- What does the HOA fee cover, when was the last increase, and are there any pending special assessments or reserve-fund shortfalls?
- Any open or pending special assessments — roof, HVAC, plumbing, elevator, façade? What's the per-unit balance and payoff schedule, and is the seller paying it off at close or rolling it to the buyer?
- Is there a deadline driving the sale (1031 exchange, divorce, estate, relocation)? That informs how much negotiation room exists.
- What's the average days-on-market for RENTAL listings here right now (not sales)? A rising rental-DOM trend means longer vacancies and softer asking-rent achievability than the comps imply.
- What's the recent tenant-quality profile in this submarket — average credit score on applications, eviction rate, late-payment / NSF rate, and stable-employment percentage? A property-management company in the area should have these aggregated.
- How much new apartment / multifamily construction is in the pipeline within 1–3 miles? Heavy new supply (>2% of stock underway) typically softens rents 12–24 months out; light construction supports rent growth.
Investment metrics
- 1% rule
- 1.74% ✓
- Cap rate
- 7.02%
- Cash-on-cash
- 2.60%
- DSCR
- 1.12
- GRM
- 4.8
CMA / ARV
No comps found within radius.
Projected returns pro-forma
-3.0% appreciation · 0.2% rent growth · sell at horizon
- IRR
- -17.7%
- Equity multiple
- 0.40×
- Total profit
- $-16,454
- Equity at exit
- $14,687
- IRR
- -25.9%
- Equity multiple
- 0.06×
- Total profit
- $-26,044
- Equity at exit
- $8,516
Cash invested: $27,580 (down + closing). Projections, not guarantees.
Landlord ↔ Tenant lean methodology
- Overall (STATE)
- 46 Balanced
- State Minnesota
- 46 Balanced · D+2
- County
- — inherits STATE
- City
- — inherits STATE
ZIP-level market 55101
- Home prices YoY
- -2.1%
- Rents YoY
- 0.2%
- Active inventory
- 77
- Price-to-rent
- 4.8×
Monthly cashflow live
- Estimated rent
- $1,718 high interval (Pro) →
- Mortgage (P&I)
- −$517
- Tax from tax record
- −$188 /mo · $2,254/yr
- Insurance
- −$41
- HOA
- −$552
- Vacancy / Maint / Mgmt
- −$361
- Net cashflow
- $60
Break-even live
UW: 25.0% down · 7.5% · 30yr · 1.5% tax · 5.0% vac · 8.0% maint · 8.0% mgmt
Financing live
Cash to close
- Down payment
- $24,625
- Closing costs
- $2,955
- Reserves months
- —
- Total cash needed
- —
Loan-product check · same deal, 3 products live
Conventional
25% down · 7.5% · 30yr
- Down + closing
- —
- Monthly P&I
- —
- Monthly cashflow
- —
- DSCR
- —
- Eligible?
- —
Personal DTI + credit; lowest rate.
DSCR
20% down · 8.5% · 30yr
- Down + closing
- —
- Monthly P&I
- —
- Monthly cashflow
- —
- DSCR
- —
- Eligible?
- —
No personal income docs; deal must DSCR.
Hard money
10% down · 12.0% · 12mo
- Down + closing
- —
- Monthly P&I
- —
- Monthly cashflow
- —
- DSCR
- —
- Eligible?
- —
Short-term bridge; refi at stabilization.
Rent comps 11 comps
| Address | Beds | Baths | Sqft | Rent | $/sqft | DOM | Units | Dist |
|---|---|---|---|---|---|---|---|---|
| 101 10th St E Saint Paul, MN | 3.0 | 1.0–2.0 | 887 | $1,611 | $1.82 | 2d | 25 | 0.17mi |
| 141 4th St E Saint Paul, MN | 2.0 | 1.0–2.0 | 811 | $1,776 | $2.19 | 20d | 20 | 0.30mi |
| 333 Sibley St Saint Paul, MN | 3.0 | 1.0–2.0 | 1358 | $1,884 | $1.39 | 10d | 10 | 0.33mi |
| 111 Kellogg Blvd E Saint Paul, MN | 3.0 | 1.0–2.0 | 1000 | $1,749 | $1.75 | 1d | 20 | 0.34mi |
| 240 5th St E St Paul, MN | 2.0 | 1.0–2.0 | 949 | $2,038 | $2.15 | 2d | 10 | 0.39mi |
| 250 6th St E St Paul, MN | 2.0 | 1.0–2.0 | 980 | $2,108 | $2.15 | 1d | 16 | 0.39mi |
| 180 E Kellogg Blvd St Paul, MN | 3.0 | 1.0–2.5 | 1436 | $2,338 | $1.63 | 1d | 22 | 0.42mi |
| 253 Kellogg Blvd W Saint Paul, MN | 2.0 | 1.0–2.0 | 1208 | $2,226 | $1.84 | 2d | 12 | 0.45mi |
| 330 9th St E St Paul, MN | 1.0–2.0 | 1.0 | 978 | $1,445 | $1.48 | 3d | 3 | 0.48mi |
| 400 Spring St Saint Paul, MN | 1.0–2.0 | 1.0–2.0 | 1205 | $1,500 | $1.24 | 3d | 31 | 1.00mi |
| 255 Western Ave N Saint Paul, MN | 3.0 | 1.0–2.0 | 1049 | $2,181 | $2.08 | 1d | 23 | 1.07mi |
HOA detail condo
- Monthly dues
- $552 · $6,624/yr
- Assessments
- None detected in remarks — confirm with the listing agent.
Listing history 16 events
-
2026-06-18days on market $98,500 Active 59 DOM
-
2026-06-17days on market $98,500 Active 58 DOM
-
2026-06-16days on market $98,500 Active 57 DOM
-
2026-06-15days on market $98,500 Active 56 DOM
-
2026-06-13days on market $98,500 Active 54 DOM
-
2026-06-09days on market $98,500 Active 50 DOM
-
2026-06-08days on market $98,500 Active 49 DOM
-
2026-06-07days on market $98,500 Active 48 DOM
-
2026-06-04days on market $98,500 Active 45 DOM
-
2026-06-03days on market $98,500 Active 44 DOM
-
2026-06-02days on market $98,500 Active 43 DOM
-
2026-06-01days on market $98,500 Active 42 DOM
-
2026-05-31days on market $98,500 Active 41 DOM
-
2026-04-20$98,500 Active 1775-char remark
Show marketing remark (1775 chars)
Experience true urban living at City Walk Condominiums in Downtown St. Paul where convenience, culture, and walkability come together in one of the Twin Cities' most connected locations. This isn't just a condo - it's a lifestyle in the heart of St. Paul where everything from dinner to concerts to river walks is just steps away! Lock and Leave, Walkable, Down-Town Living. This well-appointed condo offers a low-maintenance lifestyle with direct access to the Saint Paul Skyway System, allowing you to navigate miles of indoor walkways to dining, shopping, and services - ideal for year-round Minnesota living. Step outside your door and enjoy everything that makes downtown Saint Paul vibrant and livable. You’re just minutes from world-class entertainment at the Ordway Center for the Performing Arts, live events and NHL games at the Xcel Energy Center, and year-round community gatherings in Rice Park. The nearby Mississippi Riverfront offers scenic walking and biking trails, while Lowertown brings farmers markets, festivals, and a strong sense of community. Dining options are just steps away, including local favorites like Cossetta Alimentari, along with a variety of restaurants, cafés, and nightlife destinations that define the downtown experience. Commuting is simple with easy access to the METRO Green Line light rail, connecting both downtowns and the surrounding metro. Whether you’re heading to work, a game, or a night out, everything is within reach. Perfect for professionals, downsizers, or anyone seeking a vibrant, walkable lifestyle, this condo offers the opportunity to enjoy the best of Saint Paul with ease and convenience. This is a 1 Bedroom 1 Bathroom with beautiful West facing city views. Live where everything happens.
-
2006-07-05historical
-
2006-05-02$135,000
ⓘ Source: listings_history table (triggers on properties + properties_extension) + one-shot
backfill from property_details.listing_events for pre-trigger history.
Tax reassessment forecast MN · Partial reset (capped growth)
- Current annual tax
- $2,254 · $188/mo
- Projected year-2 tax
- $2,254 · $188/mo
- Expected delta
- $0/yr ($0/mo · 0.0%)
ⓘ Screening estimate from a state-policy table — verify with the county assessor before closing.
Nearby sold comps map
Loading sold comps map…
Walkable amenities ~0.75 mi
Loading nearby amenities…
Taxation est. · year 1
- Rental income
- $20,617
- − Mortgage interest
- −$5,518
- − Property taxes
- −$2,254
- − Insurance
- −$492
- − Repairs & maintenance
- −$1,649
- − Management
- −$1,649
- − HOA
- −$6,624
- − Depreciation
- −$2,865
- Taxable loss
- −$436
- Est. tax savings @ 24.0%
- +$105
- After-tax cash flow
- $823/yr
For passive investors: Depreciation is non-cash, so a rental often shows a tax loss while cash-flowing — sheltering income. Rental losses are passive: they offset passive income freely, and up to $25,000/yr can offset ordinary (W-2) income if you actively participate and your MAGI is under $100k (phasing out to $0 by $150k); unused losses carry forward. On sale, claimed depreciation is recaptured at up to 25%, and gains may owe capital-gains tax (a 1031 exchange can defer both). Figures are a year-1 estimate at your 24.0% rate — not tax advice; consult a CPA.
Schools (NCES district)
- District
- St. Paul Public School District
- NCES district ID
- 2733840
- Math proficiency
- 21% ▼ -11.00%
- Reading proficiency
- 33% ▼ -7.00%
- Median HH income
- $48,316
- Composite
- 23.51/100
- National rank
- #7868
- State rank
- #270 of 301 in MN
Livability — St. Paul
No livability data for this city. (Only ~50 U.S. cities are tracked.)
Census & demographics
- Census place
- St. Paul, MN
- County
- Ramsey County · 542,837 people
- City population
- 280,599
- Metro
- Minneapolis-St. Paul-Bloomington, MN-WI
- Population (ZIP)
- 7,911
- Household income
- $64,863
- Rent vs Own
- Severe rent burden
- 1202.0
Population outlook (Ramsey County) Hauer SSP2
- Today (2025)
- 603,431 people
- By 2030
- 636,459 · +5.5%
- By 2040
- 700,596 · +16.1%
- By 2050
- 765,819 · +26.9%
- By 2075
- 929,297 · +54.0%
- By 2100
- 1,053,924 · +74.7%
Race, ethnicity, and origin ACS 2023
- Neighborhood character
- Predominantly White (67%)
- Race & ethnicity
- White 67% Asian 13% Black 10% Two or more races 6% Hispanic / Latino 3%
- Common ancestry
- Portuguese 8% Romanian 3% Italian 3%
- Foreign-born
- 11% · Canada, Vietnam, China
- Languages at home
- 86% English-only · Spanish 3% Other Asian/Pacific 3% Tagalog/Filipino 2%
Political lean MEDSL · Ramsey
- 2024 margin
- Solid D (+43.3) · D 70.5% · R 27.2% · Other 2.3%
- 2008→2024 swing
- +9.4pp toward D · 2008: 33.9pp · 2024: 43.3pp
- All cycles
- 2024: D+43.3 2020: D+45.4 2016: D+39.4 2012: D+35.3 2008: D+33.9
Not yet ingested
- Civics
- —
Market trends
- HPI YoY
- ▼ -5.29%
- Current HPI
- 248.1315
- Rent YoY
- ▲ 0.20%
- Metro
- Minneapolis-St. Paul-Bloomington, MN-WI
- State GDP YoY
- ▲ 2.41%
- F500 in state
- 34
Industry mix (Fortune 500 HQ in MN)
| Industry | F500 HQs | Revenue |
|---|---|---|
| Healthcare | 2 | $407B |
|
||
| Retail | 2 | $150B |
|
||
| Consumer Goods | 2 | $32B |
|
||
| Industrial Machinery | 2 | $6B |
|
||
| Agriculture | 1 | $40B |
|
||
| Healthcare / Medical Devices | 1 | $32B |
|
||
Price history
-27.0% since first listed3 events — show timeline
- 2026-04-20 Listed $98,500 NORTHSTARMLS as Distributed by MLS Grid
- 2006-07-05 Listing Removed — NORTHSTARMLS as Distributed by MLS Grid
- 2006-05-02 Listed $135,000 NORTHSTARMLS as Distributed by MLS Grid
Property tax history
+3.1%/yrLatest (2025): $2,254 · +10.2% YoY. Source: county tax records.
Cash-flow waterfall
monthlySold comps — $/sqft
last 12 mo · ≤1 miLoading sold comps…