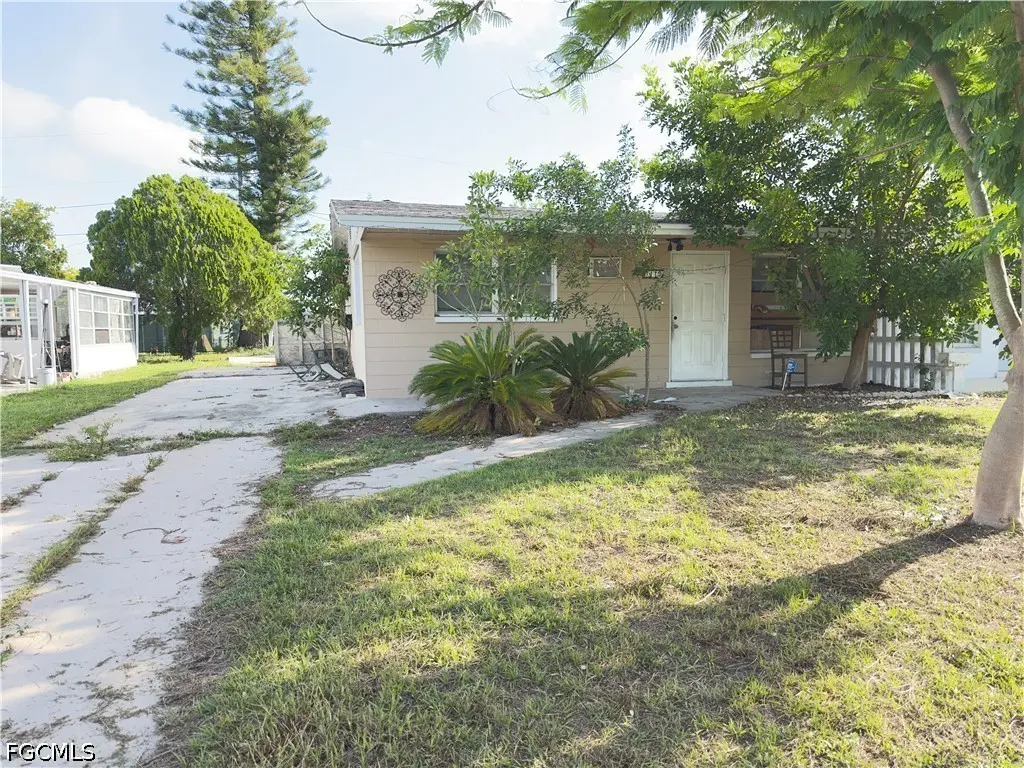
1119 Vineyard Pl · Lehigh Acres, FL
Flood risk 3/10 · Minor
- FEMA flood zone
- X (unshaded)
- Chance of flooding over 30 yrs
- 0.2%
- Est. flood insurance / yr
- $507 – $1,088
Fire risk 1/10 · Minimal
- Est. fire insurance / yr
- $947 – $1,759
Heat risk 10/10 · Severe
- Hot days now (above 107°F)
- 7 days/yr
- Hot days in 30 yrs
- 28 days/yr
Wind risk 10/10 · Severe
- Chance of severe wind over 30 yrs
- 99.0%
Air-quality risk 2/10 · Minimal
- Unhealthy air days now
- 1 days/yr
- Unhealthy air days in 30 yrs
- 2 days/yr
Risk factors via First Street. Map © Google.
Why this score? — see what drove the B+ grade
The composite is a weighted blend of 9 inputs, each scored 0–100. Each bar is that input's sub-score; the figure is the points it added to the 100-point composite (weight × sub-score).
- Cash flow +29.9/30.0
- ARV discount +15.0/15.0
- DSCR +10.0/10.0
- 1% rule +8.8/10.0
- Schools +4.1/10.0
- Livability +3.0/5.0
- Condition / age +2.5/5.0
- Rent growth +2.3/5.0
- Appreciation +0.0/10.0
$89,900
🖨 Deal sheet 📄 Offer letter ✓ Due diligence
Listing remarks
Handyman special in central Lehigh Acres. This could easily turn into a 2 bed 2 bath which would increase value significantly. 20 minutes away from Ft Myers and close by shopping and dinning centers.
Key facts
- Built 1966
- Listed 22 days
Property features AI
Finance
- Financial info: Pets allowed
- HOA & community: No association fee; Non-gated community
Exterior
- Utilities: Public water; Public sewer; Municipal irrigation; Cable service not available
- Home design: Single-story; Faces south; Resale property; Zoned RM-2
- Construction: Brick, block and concrete construction; Shingle roof; Built on foundation (details not specified)
- Exterior features: No notable exterior features listed; Attached guest house
Interior
- Flooring: Laminate flooring
- Bathrooms: 1 full bathroom
- Interior features: Single hung windows; Living/Dining room; Unfurnished
Neighborhood map
What this means for you Summary
Snapshot
- This is a 1-bed/1.0-bath townhouse listed at $90k.
Deal economics
- At list price, monthly cash flow is $334 ($4k/yr) — positive.
- The deal already cash-flows at list — no discount required.
- Meets the 1% rule at list price ($1k rent vs $90k).
- Recommended offer: $89k (1.5% below list) — sets the bar for market timing.
- Cap rate 10.7% vs local median 4.7% in Lehigh Acres — top-decile yield for the area; either an underpriced asset or a hidden risk that comps aren't pricing in. Stress-test before assuming the spread holds.
Location & tenants
- Location reads 59/100 on livability (#826 in FL) — a working-class tenant base; expect higher turnover. Strengths: cost of living A+, housing A+; Watch: crime C-, employment D+, schools D-.
- Lee (suburban): math 47% / reading 50% proficiency, ranked #42 of 73 in FL (top 58%) — families likely to look elsewhere, expect single-tenant / working-renter base with shorter leases.
- Market conditions: Rents soft (-0.8%/yr); 641 active listings in the ZIP; 4 comparable units currently listed for rent nearby; rentals at typical pace (median 24d on market — plan ~3-4 weeks tenant-placement turnaround); 15,411 units permitted in Lee County in 2024 (4,686 in 5+ unit buildings).
Forward outlook
- Local home prices are declining (-3.0%/yr); year-one equity from $622 of loan paydown is wiped out by about $3k of value loss. Plan a longer hold.
- Lee County population projected at +44% by 2050 — long-run rental-demand tailwind backs the buy-and-hold thesis.
Negotiation context
- It's been on market 22 days — a 2% lower offer ($89k) is reasonable based on typical stale-listing flexibility.
- Current owner paid $18k; list at $90k implies a 399% gain — meaningful room to come down on a strong offer.
Risks & watch-outs
- Climate carrying-cost: severe wind risk, 99% chance of damaging wind over 30y; extreme-heat days projected 7→28/yr by 2055 (HVAC capex compounding) — expect insurance premiums to compound above CPI over the hold.
Questions for the listing agent
- Built in 1966 — when were the roof, HVAC, electrical panel, plumbing, and water heater last replaced?
- Is there a deadline driving the sale (1031 exchange, divorce, estate, relocation)? That informs how much negotiation room exists.
- Schools are D-rated, which usually means shorter tenancies and higher turnover. Who's the typical renter profile here, and what's been the actual vacancy rate?
- What's the average days-on-market for RENTAL listings here right now (not sales)? A rising rental-DOM trend means longer vacancies and softer asking-rent achievability than the comps imply.
- What's the recent tenant-quality profile in this submarket — average credit score on applications, eviction rate, late-payment / NSF rate, and stable-employment percentage? A property-management company in the area should have these aggregated.
- How much new for-sale + rental construction is in the pipeline within 1–3 miles? Heavy new supply typically softens prices + rents 12–24 months out; constrained supply supports both.
Investment metrics
- 1% rule
- 1.38% ✓
- Cap rate
- 10.75%
- Cash-on-cash
- 15.90%
- DSCR
- 1.71
- GRM
- 6.0
CMA / ARV
- ARV (on-the-fly)
- $175,168
- Comps found
- 2
Show comp detail 2 sales within ~0.75 mi
| Address | Dist | Beds/Ba | Sqft | Sold | Price | $/sf | Match |
|---|---|---|---|---|---|---|---|
| 1116 Vineyard St | 0.12mi | 2/1.0 (+1) | 644 (0%) | 0mo | $175,000 | $272 | 89 |
| 1104 Vineyard St | 0.13mi | 1/1.0 | 595 (-8%) | 0mo | $126,000 | $212 | 81 |
Match score weights: distance 35% · size 25% · config 20% · recency 20%. Top-matched comps best support the ARV.
Projected returns pro-forma
-3.0% appreciation · 0.0% rent growth · sell at horizon
- IRR
- 3.3%
- Equity multiple
- 1.12×
- Total profit
- $3,064
- Equity at exit
- $13,404
- IRR
- 9.6%
- Equity multiple
- 1.64×
- Total profit
- $16,072
- Equity at exit
- $7,773
Cash invested: $25,172 (down + closing). Projections, not guarantees.
Landlord ↔ Tenant lean methodology
- Overall (STATE)
- 87 Strongly Landlord-Friendly
- State Florida
- 87 Strongly Landlord-Friendly · R+3
- County
- — inherits STATE
- City
- — inherits STATE
ZIP-level market 33936
- Home prices YoY
- -19.9%
- Rents YoY
- -0.8%
- Active inventory
- 641
- Price-to-rent
- 6.0×
Monthly cashflow live
- Estimated rent
- $1,245 medium interval (Pro) →
- Mortgage (P&I)
- −$471
- Tax from tax record
- −$141 /mo · $1,691/yr
- Insurance
- −$37
- HOA
- −$0
- Vacancy / Maint / Mgmt
- −$261
- Net cashflow
- $334
Break-even live
UW: 25.0% down · 7.5% · 30yr · 1.5% tax · 5.0% vac · 8.0% maint · 8.0% mgmt
Financing live
Cash to close
- Down payment
- $22,475
- Closing costs
- $2,697
- Reserves months
- —
- Total cash needed
- —
Loan-product check · same deal, 3 products live
Conventional
25% down · 7.5% · 30yr
- Down + closing
- —
- Monthly P&I
- —
- Monthly cashflow
- —
- DSCR
- —
- Eligible?
- —
Personal DTI + credit; lowest rate.
DSCR
20% down · 8.5% · 30yr
- Down + closing
- —
- Monthly P&I
- —
- Monthly cashflow
- —
- DSCR
- —
- Eligible?
- —
No personal income docs; deal must DSCR.
Hard money
10% down · 12.0% · 12mo
- Down + closing
- —
- Monthly P&I
- —
- Monthly cashflow
- —
- DSCR
- —
- Eligible?
- —
Short-term bridge; refi at stabilization.
Rent comps 4 comps
| Address | Beds | Baths | Sqft | Rent | $/sqft | DOM | Units | Dist |
|---|---|---|---|---|---|---|---|---|
| 907 Laredo Ave Lehigh Acres, FL | 1.0 | 1.0 | 636 | $1,000 | $1.57 | 23d | 1 | 0.27mi |
| 11 California Rd Lehigh Acres, FL | 1.0 | 1.0 | 683 | $1,450 | $2.12 | 23d | 1 | 0.37mi |
| 305 Bougainvillea Rd W Lehigh Acres, FL | 1.0 | 1.0 | 742 | $1,295 | $1.75 | 23d | 1 | 0.90mi |
| 1232 Village Lakes Blvd Lehigh Acres, FL | 1.0–2.0 | 1.0–2.0 | 734 | $1,127 | $1.54 | 14d | 17 | 1.45mi |
Listing history 16 events
-
2026-06-17days on market $89,900 Active 22 DOM
-
2026-06-16days on market $89,900 Active 21 DOM
-
2026-06-15price $89,900 Active 20 DOM
-
2026-06-15days on market $95,900 Active 20 DOM
-
2026-06-13days on market $95,900 Active 18 DOM
-
2026-06-10days on market $95,900 Active 15 DOM
-
2026-06-09days on market $95,900 Active 14 DOM
-
2026-06-08days on market $95,900 Active 13 DOM
-
2026-06-07days on market $95,900 Active 12 DOM
-
2026-06-03days on market $95,900 Active 8 DOM
-
2026-06-02days on market $95,900 Active 7 DOM
-
2026-06-02price $95,900 Active 6 DOM
-
2026-06-01days on market $99,900 Active 6 DOM
-
2026-05-31days on market $99,900 Active 5 DOM
-
2026-05-26$99,900 Active
-
1994-03-11soldstatus $18,000
ⓘ Source: listings_history table (triggers on properties + properties_extension) + one-shot
backfill from property_details.listing_events for pre-trigger history.
Tax reassessment forecast FL · Resets to sale price
- Current annual tax
- $1,691 · $141/mo
- Projected year-2 tax
- $1,691 · $141/mo
- Expected delta
- $0/yr ($0/mo · 0.0%)
ⓘ Screening estimate from a state-policy table — verify with the county assessor before closing.
Climate risk First Street
- Flood 3/10 Moderate FEMA zone X (unshaded) · 20% chance over 30 yrs
- Wildfire 1/10 Low
- Heat 10/10 Extreme 7 d/yr ≥107°F today · 28 d/yr by 30 yrs out
- Wind 10/10 Extreme 99% chance of damaging wind over 30 yrs
- Air quality 2/10 Low 1 unhealthy d/yr today · 2 by 30 yrs out
Nearby sold comps map
Loading sold comps map…
Walkable amenities ~0.75 mi
Loading nearby amenities…
Taxation est. · year 1
- Rental income
- $14,937
- − Mortgage interest
- −$5,036
- − Property taxes
- −$1,691
- − Insurance
- −$450
- − Repairs & maintenance
- −$1,195
- − Management
- −$1,195
- − Depreciation
- −$2,615
- Taxable income
- $2,756
- Est. tax owed @ 24.0%
- −$661
- After-tax cash flow
- $3,341/yr
For passive investors: Depreciation is non-cash, so a rental often shows a tax loss while cash-flowing — sheltering income. Rental losses are passive: they offset passive income freely, and up to $25,000/yr can offset ordinary (W-2) income if you actively participate and your MAGI is under $100k (phasing out to $0 by $150k); unused losses carry forward. On sale, claimed depreciation is recaptured at up to 25%, and gains may owe capital-gains tax (a 1031 exchange can defer both). Figures are a year-1 estimate at your 24.0% rate — not tax advice; consult a CPA.
Schools (NCES district)
- District
- Lee
- NCES district ID
- 1201080
- Math proficiency
- 47% ▼ -11.00%
- Reading proficiency
- 50% ▼ -4.00%
- Median HH income
- $49,518
- Composite
- 41.49/100
- National rank
- #3458
- State rank
- #42 of 73 in FL
Livability — Lehigh Acres
- Score
- 59/100
- State rank
- #826
- US rank
- #20055
Category grades
Schools grade is shown separately in the Schools card above.
Census & demographics
- Census place
- Lehigh Acres, FL
- County
- Lee County · 788,662 people
- City population
- 130,638
- Metro
- Cape Coral-Fort Myers, FL
- Population (ZIP)
- 27,967
- Household income
- $51,417
- Rent vs Own
- Severe rent burden
- 1027.0
Population outlook (Lee County) Hauer SSP2
- Today (2025)
- 871,946 people
- By 2030
- 955,468 · +9.6%
- By 2040
- 1,113,587 · +27.7%
- By 2050
- 1,256,891 · +44.1%
- By 2075
- 1,560,270 · +78.9%
- By 2100
- 1,726,848 · +98.0%
Race, ethnicity, and origin ACS 2023
- Neighborhood character
- Diverse neighborhood (Simpson 0.63)
- Race & ethnicity
- Hispanic / Latino 44% White 41% Two or more races 21% Black 9% Asian 1%
- Hispanic origin (detail)
- Mexican 7% Puerto Rican 9% Cuban 18% Dominican 2%
- Common ancestry
- Hispanic 3% Romanian 2% Lithuanian 1%
- Foreign-born
- 28% · Canada, Jamaica
- Languages at home
- 59% English-only · Spanish 36% French/Haitian/Cajun 3% Tagalog/Filipino 1%
Political lean MEDSL · Lee
- 2024 margin
- Strong R (+28.4) · D 35.5% · R 63.9%
- 2008→2024 swing
- -18.0pp toward R · 2008: -10.4pp · 2024: -28.4pp
- All cycles
- 2024: R+28.4 2020: R+19.2 2016: R+20.4 2012: R+16.6 2008: R+10.4
Not yet ingested
- Civics
- —
Market trends
- HPI YoY
- ▼ -86.78%
- Current HPI
- 348.8631
- Rent YoY
- ▼ -0.77%
- Metro
- Cape Coral-Fort Myers, FL
- State GDP YoY
- ▲ 3.28%
- F500 in state
- 36
Industry mix (Fortune 500 HQ in FL)
| Industry | F500 HQs | Revenue |
|---|---|---|
| Industrial Technology | 2 | $29B |
|
||
| Insurance | 2 | $17B |
|
||
| Retail | 1 | $60B |
|
||
| Technology Distribution | 1 | $58B |
|
||
| Homebuilding | 1 | $35B |
|
||
| Technology Manufacturing | 1 | $35B |
|
||
Price history
+455.0% since first listed2 events — show timeline
- 2026-05-26 Listed $99,900 FORTMLS
- 1994-03-11 Sold (Public Records) $18,000 Public Records
Property tax history
+10.9%/yrLatest (2025): $1,691 · +12.4% YoY. Source: county tax records.
Cash-flow waterfall
monthlySold comps — $/sqft
last 12 mo · ≤1 miLoading sold comps…