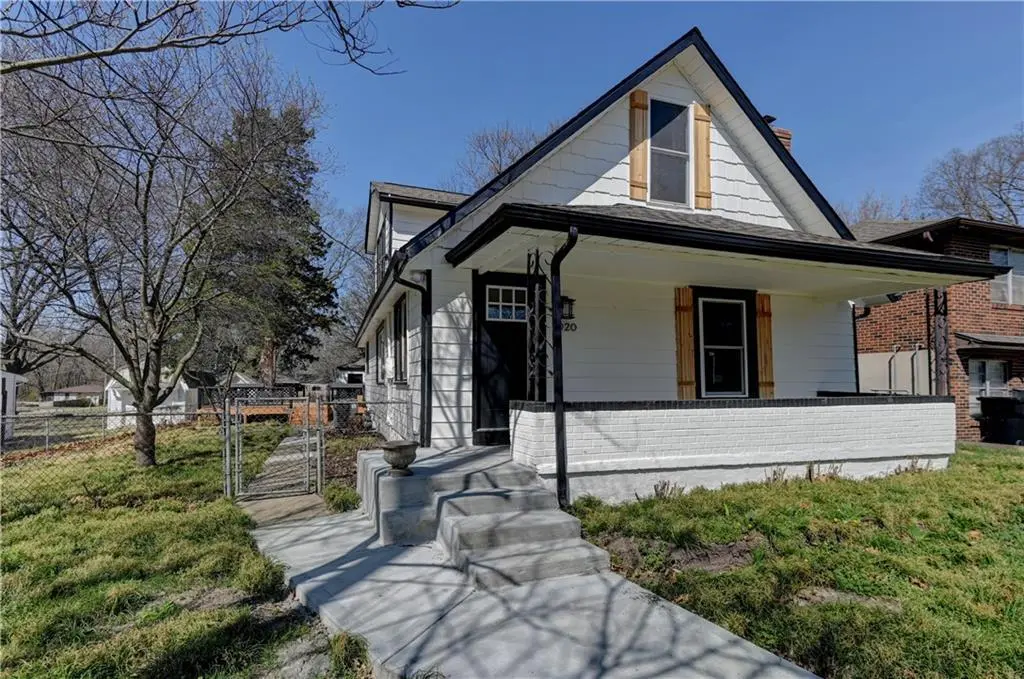
1020 S Mccoy St · Independence, MO
Flood risk 1/10 · Minimal
- FEMA flood zone
- X (unshaded)
- Chance of flooding over 30 yrs
- 0.0%
- Est. flood insurance / yr
- $473 – $860
Fire risk 1/10 · Minimal
- Est. fire insurance / yr
- $1,054 – $1,958
Heat risk 4/10 · Minor
- Hot days now (above 106°F)
- 7 days/yr
- Hot days in 30 yrs
- 17 days/yr
Wind risk 2/10 · Minimal
- Chance of severe wind over 30 yrs
- —
Air-quality risk 3/10 · Minor
- Unhealthy air days now
- 3 days/yr
- Unhealthy air days in 30 yrs
- 3 days/yr
Risk factors via First Street. Map © Google.
Why this score? — see what drove the D grade
The composite is a weighted blend of 9 inputs, each scored 0–100. Each bar is that input's sub-score; the figure is the points it added to the 100-point composite (weight × sub-score).
- ARV discount +15.0/15.0
- Cash flow +9.3/30.0
- Livability +4.1/5.0
- Rent growth +3.4/5.0
- Schools +2.7/10.0
- DSCR +2.6/10.0
- Condition / age +2.5/5.0
- 1% rule +1.9/10.0
- Appreciation +0.0/10.0
$215,000
🖨 Deal sheet (PDF) 📄 Offer letter ✓ Due diligence
Listing remarks
Fully renovated 3 bedroom home with lots of updates. The property has a 2 car detached garage and a separate workshop. Living room, dining room, primary bedroom, new kitchen on main floor. Additional living area, two bedrooms and a full bathroom on 2nd floor.
Key facts
- New kitchen
- Separate workshop
- Detached garage
Tags
Property features AI
Finance
- Other: Living area reported as 2,768 total; Above-grade finished area reported as 1,664; Below-grade finished area reported as 1,104; Age estimated between 76 and 100 years
- HOA & community: No association fees
Exterior
- Parking: Detached 2-car garage
- Utilities: Public water; Public sewer
- Home design: Single-family residence; Bungalow style, 2 stories; Residential property
- Construction: Frame construction; Composition roof; Has basement
- Exterior features: Not in a flood plain; Lot approximately 9,322 square feet
Interior
- Kitchen: Kitchen on main level
- Bedrooms: Three bedrooms (one on main level, two on second level)
- Bathrooms: Two full bathrooms (one on main level, one on second level)
- Heating & cooling: Natural gas heating; Electric cooling
- Interior features: Unfinished basement with sump pump; Breakfast room; Fireplace serving dining room, family room, great room, kitchen, and living room (1 total)
Neighborhood map
What this means for you Summary
Snapshot
- This is a 3-bed/2.0-bath single-family listed at $215k.
Deal economics
- At list price, monthly cash flow is $-156 ($-2k/yr) — negative.
- To cash-flow at today's rent, offer at most $188k (12.8% below list).
- To meet the 1% rule (rent ≥ 1% of price), the offer needs to be $148k (31.3% below list).
- Recommended offer: $148k (31.3% below list) — sets the bar for 1% rule.
Location & tenants
- Location reads 82/100 on livability (#10 in MO, #1,296 nationally) — a professional / high-income tenant draw. Strengths: amenities A+, commute A+, cost of living A+; Watch: employment D+, crime F.
- Independence 30 (suburban): math 26% / reading 38% proficiency, ranked #252 of 324 in MO (top 78%) — families likely to look elsewhere, expect single-tenant / working-renter base with shorter leases.
- Zoned schools: Santa Fe Trail Elem. (math 37% / reading 47%, grade F, #481 of 1,115 statewide, top 46%, 386 students, 76% FRL); Bridger Middle (math 32% / reading 38%, grade F, #240 of 391 statewide, top 62%, 770 students, 65% FRL); William Chrisman High (math 21% / reading 45%, grade F, #351 of 521 statewide, top 68%, 1,406 students, 66% FRL).
- Market conditions: Rents rising (+3.8%/yr); 127 active listings in the ZIP; 14 comparable units currently listed for rent nearby; rentals at typical pace (median 18d on market — plan ~3-4 weeks tenant-placement turnaround); 4,002 units permitted in Jackson County in 2024 (2,271 in 5+ unit buildings).
- This rent runs 36% of the median local income ($49k/yr) — at the standard rent-burdened threshold; future hikes will face affordability resistance.
Forward outlook
- Local home prices are declining (-3.0%/yr); year-one equity from $1k of loan paydown is wiped out by about $6k of value loss. Plan a longer hold.
- Jackson County population projected at +4% by 2050 — modest demand growth; plan on rents tracking national, not racing it.
Negotiation context
- Only 4 days on market — expect competitive offers; lowballing is unlikely to land.
- 4 sale attempts with the ask held roughly flat each time — persistent listings suggest the price (not the market) is what's stuck; bring a comps-based counter.
Risks & watch-outs
- Watch-outs: built in 1940 — expect roof / HVAC / electrical / plumbing capex.
Questions for the listing agent
- What do current leases actually rent for vs. the listed asking? Can we see a recent rent roll and the last 12 months of T-12 income?
- Built in 1940 — when were the roof, HVAC, electrical panel, plumbing, and water heater last replaced?
- Is there a deadline driving the sale (1031 exchange, divorce, estate, relocation)? That informs how much negotiation room exists.
- Crime grade is F in this area — have there been break-ins, vandalism, or insurance claims at this property in the last 3 years? What carrier currently insures it and at what premium?
- The area grade is low — what's the realistic commute time and amenity access for the typical tenant pool here? Any planned neighborhood developments (good or bad) we should know about?
- What's the average days-on-market for RENTAL listings here right now (not sales)? A rising rental-DOM trend means longer vacancies and softer asking-rent achievability than the comps imply.
- What's the recent tenant-quality profile in this submarket — average credit score on applications, eviction rate, late-payment / NSF rate, and stable-employment percentage? A property-management company in the area should have these aggregated.
- How much new for-sale + rental construction is in the pipeline within 1–3 miles? Heavy new supply typically softens prices + rents 12–24 months out; constrained supply supports both.
Investment metrics
- 1% rule
- 0.69% ✗
- Cap rate
- 5.42%
- Cash-on-cash
- -3.10%
- DSCR
- 0.86
- GRM
- 12.1
CMA / ARV
- ARV (median comp)
- $268,576
- List price
- $215,000
- Delta
- -21.81%
- Verdict
- UNDERPRICED
- Comps
- 20 within 1.0 mi
Show comp detail 12 sales within ~0.75 mi
| Address | Dist | Beds/Ba | Sqft | Sold | Price | $/sf | Match |
|---|---|---|---|---|---|---|---|
| 611 W 23rd St | 0.14mi | 2/1.0 (-1) | 1,520 (-9%) | 2mo | $144,900 | $95 | 69 |
| 1201 W 25th St | 0.54mi | 3/2.0 | 1,628 (-2%) | 4mo | $229,900 | $141 | 68 |
| 1110 24th St | 0.45mi | 3/2.5 | 1,747 (+5%) | 3mo | $245,900 | $141 | 66 |
| 926 S Washington St | 0.36mi | 3/1.0 | 1,558 (-6%) | 5mo | $168,000 | $108 | 64 |
| 1223 S Osage St | 0.33mi | 2/2.0 (-1) | 1,786 (+7%) | 7mo | $140,000 | $78 | 62 |
| 1123 S Liberty St | 0.36mi | 4/2.5 (+1) | 1,484 (-11%) | 0mo | $207,000 | $139 | 58 |
| 809 S Crysler Ave | 0.50mi | 2/2.0 (-1) | 1,547 (-7%) | 5mo | $150,000 | $97 | 56 |
| 1104 W 27th St S | 0.69mi | 3/2.0 | 1,553 (-7%) | 4mo | $190,000 | $122 | 54 |
| 421 S Main St | 0.63mi | 2/1.0 (-1) | 1,748 (+5%) | 3mo | $199,900 | $114 | 50 |
| 219 E South Ave | 0.57mi | 3/2.0 | 1,464 (-12%) | 6mo | $194,900 | $133 | 48 |
| 229 E Elm St | 0.74mi | 3/2.0 | 1,536 (-8%) | 6mo | $234,990 | $153 | 48 |
| 1525 W Lexington Ave | 0.72mi | 3/1.5 | 1,860 (+12%) | 1mo | $279,900 | $150 | 44 |
Match score weights: distance 35% · size 25% · config 20% · recency 20%. Top-matched comps best support the ARV.
Projected returns pro-forma
-3.0% appreciation · 3.79% rent growth · sell at horizon
- IRR
- -20.8%
- Equity multiple
- 0.28×
- Total profit
- $-43,640
- Equity at exit
- $32,057
- IRR
- -12.7%
- Equity multiple
- 0.23×
- Total profit
- $-46,141
- Equity at exit
- $18,589
Cash invested: $60,200 (down + closing). Projections, not guarantees.
Landlord ↔ Tenant lean methodology
- Overall (STATE)
- 81 Strongly Landlord-Friendly
- State Missouri
- 81 Strongly Landlord-Friendly · R+10
- County
- — inherits STATE
- City
- — inherits STATE
ZIP-level market 64050
- Home prices YoY
- -15.5%
- Rents YoY
- 3.8%
- Active inventory
- 127
- Price-to-rent
- 12.1×
Monthly cashflow live
- Estimated rent
- $1,476 high interval (Pro) →
- Mortgage (P&I)
- −$1,127
- Tax from tax record
- −$105 /mo · $1,258/yr
- Insurance
- −$90
- HOA
- −$0
- Vacancy / Maint / Mgmt
- −$310
- Net cashflow
- $-156
Break-even live
Sensitivity live
| Price | -10% $-34 | -5% $-95 | +0% $-156 | +5% $-216 | +10% $-277 |
|---|---|---|---|---|---|
| Rent | -10% $-272 | -5% $-214 | +0% $-156 | +5% $-97 | +10% $-39 |
| Rate | -1.0pp $-47 | -0.5pp $-101 | base $-156 | +0.5pp $-211 | +1.0pp $-268 |
UW: 25.0% down · 7.5% · 30yr · 1.5% tax · 5.0% vac · 8.0% maint · 8.0% mgmt
Financing live
Cash to close
- Down payment
- $53,750
- Closing costs
- $6,450
- Reserves months
- —
- Total cash needed
- —
Loan-product check · same deal, 3 products live
Conventional
25% down · 7.5% · 30yr
- Down + closing
- —
- Monthly P&I
- —
- Monthly cashflow
- —
- DSCR
- —
- Eligible?
- —
Personal DTI + credit; lowest rate.
DSCR
20% down · 8.5% · 30yr
- Down + closing
- —
- Monthly P&I
- —
- Monthly cashflow
- —
- DSCR
- —
- Eligible?
- —
No personal income docs; deal must DSCR.
Hard money
10% down · 12.0% · 12mo
- Down + closing
- —
- Monthly P&I
- —
- Monthly cashflow
- —
- DSCR
- —
- Eligible?
- —
Short-term bridge; refi at stabilization.
Rent comps 14 comps
| Address | Beds | Baths | Sqft | Rent | $/sqft | DOM | Units | Dist |
|---|---|---|---|---|---|---|---|---|
| 1404 S Osage St Independence, MO | 4.0 | 2.0 | 1300 | $1,750 | $1.35 | 16d | 1 | 0.41mi |
| 1502 S Pleasant St Independence, MO | 3.0 | 2.0 | 1200 | $1,399 | $1.17 | 45d | 1 | 0.44mi |
| 2342 S Crysler Ave Independence, MO | 3.0 | 2.0 | 1400 | $1,395 | $1.00 | 0d | 1 | 0.56mi |
| 2356 S Crysler Ave Independence, MO | 3.0 | 2.0 | 1881 | $1,653 | $0.88 | 25d | 1 | 0.57mi |
| 11709 E Winner Rd Independence, MO | 3.0 | 1.5 | 1300 | $1,195 | $0.92 | 18d | 1 | 0.87mi |
| 802 S Logan Ave Independence, MO | 2.0 | 2.0 | 1500 | $1,100 | $0.73 | 0d | 1 | 1.01mi |
| 124 S Forest Ave Independence, MO | 2.0 | 1.0 | 1092 | $999 | $0.91 | 0d | 1 | 1.06mi |
| 718 E Gudgell Ave Independence, MO | 4.0 | 2.0 | 1624 | $1,775 | $1.09 | 18d | 1 | 1.15mi |
| 315 S Crane St Unit A Independence, MO | 3.0 | 1.0 | 1150 | $1,250 | $1.09 | 25d | 1 | 1.22mi |
| 315 S Crane St Unit A Independence, MO | 3.0 | 1.0 | 1150 | $1,250 | $1.09 | 45d | 1 | 1.22mi |
| 11418 E 13th St S Independence, MO | 2.0 | 1.0 | 1760 | $1,100 | $0.62 | 45d | 1 | 1.24mi |
| 2256 S Sterling Ave Independence, MO | 3.0 | 1.5 | 1284 | $1,399 | $1.09 | 18d | 1 | 1.27mi |
| 2110 S Sterling Ave Independence, MO | 3.0 | 2.0 | 1722 | $1,849 | $1.07 | 18d | 1 | 1.27mi |
| 10817 E 19th Ter S Independence, MO | 3.0 | 1.0 | 1428 | $1,801 | $1.26 | 18d | 1 | 1.44mi |
Listing history 13 events
-
2026-06-07statusdays on market $215,000 Pending 4 DOM
-
2026-06-05days on market $215,000 Active 3 DOM
-
2026-06-03days on market $215,000 Active 2 DOM
-
2026-06-02pricedays on market $215,000 Active 1 DOM
-
2026-05-14status Active 259-char remark
-
2026-05-12status Pending 259-char remark
-
2026-05-06status Active 259-char remark
-
2026-04-26historical 259-char remark
-
2026-04-23price $210,000 259-char remark
-
2026-04-13price $220,000 259-char remark
-
2026-04-01$230,000 Active 259-char remark
-
2025-10-01soldstatus
-
1987-09-25soldstatus
ⓘ Source: listings_history table (triggers on properties + properties_extension) + one-shot
backfill from property_details.listing_events for pre-trigger history.
Tax reassessment forecast MO · Resets to sale price
- Current annual tax
- $1,258 · $105/mo
- Projected year-2 tax
- $2,086 · $174/mo
- Expected delta
- +$828/yr (+$69/mo · 65.8%)
ⓘ Screening estimate from a state-policy table — verify with the county assessor before closing.
Climate risk First Street
- Flood 1/10 Low FEMA zone X (unshaded) · 0% chance over 30 yrs
- Wildfire 1/10 Low
- Heat 4/10 Moderate 7 d/yr ≥106°F today · 17 d/yr by 30 yrs out
- Wind 2/10 Low
- Air quality 3/10 Moderate 3 unhealthy d/yr today · 3 by 30 yrs out
Nearby sold comps map
Loading sold comps map…
Walkable amenities ~0.75 mi
Loading nearby amenities…
Taxation est. · year 1
- Rental income
- $17,717
- − Mortgage interest
- −$12,043
- − Property taxes
- −$1,258
- − Insurance
- −$1,075
- − Repairs & maintenance
- −$1,417
- − Management
- −$1,417
- − Depreciation
- −$6,255
- Taxable loss
- −$5,748
- Est. tax savings @ 24.0%
- +$1,380
- After-tax cash flow
- $-487/yr
For passive investors: Depreciation is non-cash, so a rental often shows a tax loss while cash-flowing — sheltering income. Rental losses are passive: they offset passive income freely, and up to $25,000/yr can offset ordinary (W-2) income if you actively participate and your MAGI is under $100k (phasing out to $0 by $150k); unused losses carry forward. On sale, claimed depreciation is recaptured at up to 25%, and gains may owe capital-gains tax (a 1031 exchange can defer both). Figures are a year-1 estimate at your 24.0% rate — not tax advice; consult a CPA.
Schools (NCES district)
- District
- Independence 30
- NCES district ID
- 2915480
- Math proficiency
- 26% ▼ -8.00%
- Reading proficiency
- 38% ▼ -5.00%
- Median HH income
- $41,843
- Composite
- 27.04/100
- National rank
- #7054
- State rank
- #252 of 324 in MO
Livability — Independence
- Score
- 82/100
- State rank
- #10
- US rank
- #1296
Category grades
Schools grade is shown separately in the Schools card above.
Census & demographics
- Census place
- Independence, MO
- County
- Jackson County · 687,798 people
- City population
- 117,675
- Metro
- Kansas City, MO-KS
- Population (ZIP)
- 21,079
- Household income
- $48,834
- Rent vs Own
- Severe rent burden
- 972.0
Population outlook (Jackson County) Hauer SSP2
- Today (2025)
- 719,589 people
- By 2030
- 731,456 · +1.6%
- By 2040
- 746,689 · +3.8%
- By 2050
- 749,289 · +4.1%
- By 2075
- 736,227 · +2.3%
- By 2100
- 668,210 · -7.1%
Race, ethnicity, and origin ACS 2023
- Neighborhood character
- Predominantly White (72%)
- Race & ethnicity
- White 72% Hispanic / Latino 11% Two or more races 9% Black 7% Pacific Islander 1%
- Hispanic origin (detail)
- Mexican 8%
- Common ancestry
- Italian 4% Serbian 2% Lithuanian 1%
- Foreign-born
- 5% · Canada
- Languages at home
- 91% English-only · Spanish 7% Other Asian/Pacific 1%
Political lean MEDSL · Jackson
- 2024 margin
- D (+19.3) · D 58.9% · R 39.5% · Other 1.6%
- 2008→2024 swing
- -6.1pp toward R · 2008: 25.4pp · 2024: 19.3pp
- All cycles
- 2024: D+19.3 2020: D+22.0 2016: D+16.6 2012: D+19.0 2008: D+25.4
Not yet ingested
- Civics
- —
Market trends
- HPI YoY
- ▼ -56.24%
- Current HPI
- 305.796
- Rent YoY
- ▲ 3.79%
- Metro
- Kansas City, MO-KS
- State GDP YoY
- ▲ 1.84%
- F500 in state
- 20
Industry mix (Fortune 500 HQ in MO)
| Industry | F500 HQs | Revenue |
|---|---|---|
| Healthcare | 1 | $163B |
|
||
| Insurance | 1 | $21B |
|
||
| Industrial Technology | 1 | $17B |
|
||
| Retail | 1 | $16B |
|
||
| Industrial Distribution | 1 | $10B |
|
||
| Utilities | 1 | $9B |
|
||
Price history
-6.5% since first listed12 events — show timeline
- 2026-06-05 Pending — Heartland MLS as Distributed by MLS Grid
- 2026-06-01 Listed $215,000 Heartland MLS as Distributed by MLS Grid
- 2026-05-27 Listing Removed — Heartland MLS as Distributed by MLS Grid
- 2026-05-14 Relisted — Heartland MLS as Distributed by MLS Grid
- 2026-05-12 Pending — Heartland MLS as Distributed by MLS Grid
- 2026-05-06 Relisted — Heartland MLS as Distributed by MLS Grid
- 2026-04-26 Listing Removed — Heartland MLS as Distributed by MLS Grid
- 2026-04-23 Price Changed $210,000 Heartland MLS as Distributed by MLS Grid
- 2026-04-13 Price Changed $220,000 Heartland MLS as Distributed by MLS Grid
- 2026-04-01 Listed $230,000 Heartland MLS as Distributed by MLS Grid
- 2025-10-01 Sold (Public Records) — Public Records
- 1987-09-25 Sold (Public Records) — Public Records
Property tax history
+0.6%/yrLatest (2025): $1,258 · +65.6% YoY. Source: county tax records.
Cash-flow waterfall
monthlySold comps — $/sqft
last 12 mo · ≤1 miLoading sold comps…