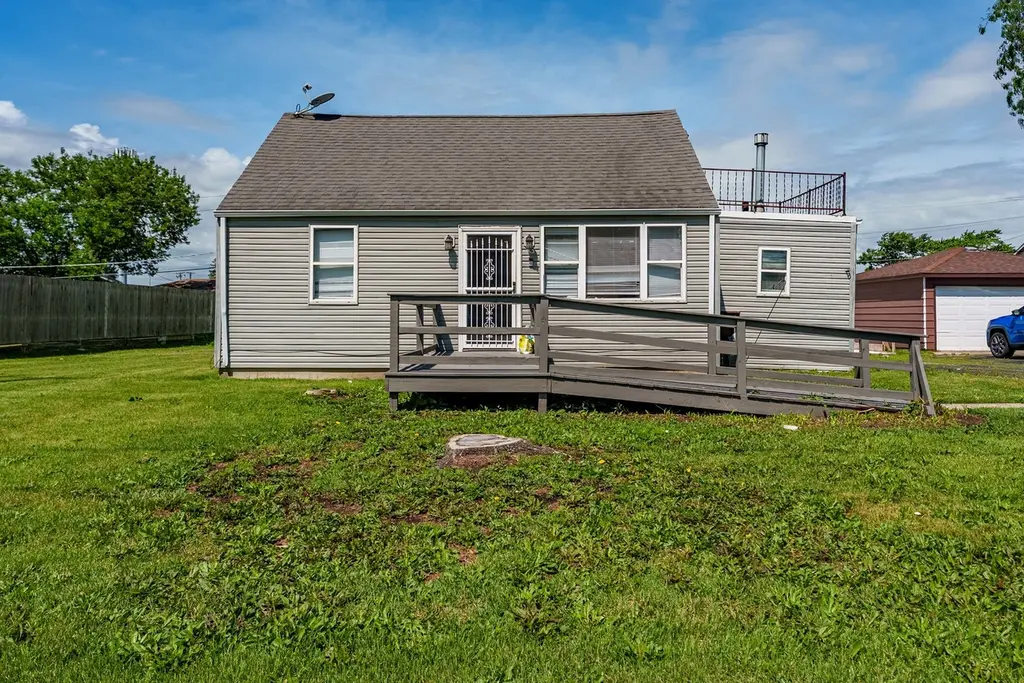
8638 Central Ave · Burbank, IL
Flood risk 4/10 · Minor
- FEMA flood zone
- X (unshaded)
- Chance of flooding over 30 yrs
- 0.22%
- Est. flood insurance / yr
- $473 – $860
Fire risk 1/10 · Minimal
- Est. fire insurance / yr
- $804 – $1,492
Heat risk 3/10 · Minor
- Hot days now (above 100°F)
- 7 days/yr
- Hot days in 30 yrs
- 15 days/yr
Wind risk 2/10 · Minimal
- Chance of severe wind over 30 yrs
- 0.0%
Air-quality risk 3/10 · Minor
- Unhealthy air days now
- 4 days/yr
- Unhealthy air days in 30 yrs
- 4 days/yr
Risk factors via First Street. Map © Google.
Why this score? — see what drove the C- grade
The composite is a weighted blend of 9 inputs, each scored 0–100. Each bar is that input's sub-score; the figure is the points it added to the 100-point composite (weight × sub-score).
- Cash flow +16.4/30.0
- ARV discount +13.8/15.0
- 1% rule +5.4/10.0
- DSCR +5.1/10.0
- Livability +3.9/5.0
- Rent growth +2.5/5.0
- Condition / age +2.5/5.0
- Schools +1.8/10.0
- Appreciation +0.0/10.0
$219,900
🖨 Deal sheet 📄 Offer letter ✓ Due diligence
Listing remarks MLS
This cozy and affordable home offers a welcoming layout with **three bedrooms and one bathroom**. The first floor features two comfortable bedrooms along with the full bathroom, while the **expansive upstairs bedroom** provides extra flexibility and includes access to a **large private balcony**-perfect for relaxing or entertaining. Enjoy the ample backyard space, offering plenty of room for gardening, gatherings, or play.
Key facts
- Spacious backyard
- Private driveway
- Generously sized lot
Tags
Property features AI
Finance
- Other: Parcel number available
- Financial info: Special service area: No
- HOA & community: No master association fee required
Exterior
- Parking: Space for 4 vehicles; Driveway parking; Asphalt surface; Unassigned parking; Other parking features
- Utilities: Lake Michigan and public water available; Public sewer
- Home design: Detached single-family home; 1.5-story design; Fee simple ownership; Rehab completed in 2020; Disability access available
- Construction: Aluminum and vinyl siding; Built approximately 71-80 years ago; Built before 1978
- Exterior features: Lot approx. 80 x 127; Less than 0.25 acre lot; Commuter bus access
Interior
- Kitchen: Kitchen on main level (approx. 10 x 11)
- Bedrooms: 3 bedrooms (Master bedroom on second level, approx. 15 x 27); Bedroom 2 on main level (approx. 11 x 10, carpet); Bedroom 3 on main level (approx. 12 x 10, carpet)
- Flooring: Carpet in multiple bedrooms and living room; Other flooring in kitchen
- Bathrooms: 1 full bathroom
- Heating & cooling: Baseboard heating; Window air conditioning units
- Interior features: 5 total rooms; Utility room on main level; Dining room; Family room; Living room on main level (approx. 11 x 15)
- Laundry & utility: Laundry room; Utility room on main level (approx. 10 x 11)
Neighborhood map
What this means for you Summary
Snapshot
- This is a 3-bed/1.5-bath single-family listed at $220k.
Deal economics
- At list price, monthly cash flow is $126 ($2k/yr) — positive.
- The deal already cash-flows at list — no discount required.
- Meets the 1% rule at list price ($2k rent vs $220k).
- Cap rate 7.0% vs local median 5.4% in Burbank — meaningfully above typical; check what's discounted (condition, days-on-market, listing class) to confirm the premium yield is real.
Location & tenants
- Location reads 78/100 on livability (#132 in IL, #2,422 nationally) — a middle-class / working-renter tenant base. Strengths: commute A+, housing A+, employment A-; Watch: health & safety C-, schools D-, amenities F.
- Reavis Twp Hsd 220 (suburban): math 18% / reading 21% proficiency, ranked #420 of 620 in IL (top 68%) — low school quality limits family demand, transient renter base, plan for 1-2y turnover.
- Market conditions: 51 active listings in the ZIP; 13 comparable units currently listed for rent nearby; rentals leasing fast (median 7d on market — plan ~1-2 weeks tenant-placement turnaround); 6,272 units permitted in Cook County in 2024 (4,658 in 5+ unit buildings).
Forward outlook
- Local home prices are declining (-3.0%/yr); year-one equity from $2k of loan paydown is wiped out by about $7k of value loss. Plan a longer hold.
Negotiation context
- Only 1 days on market — expect competitive offers; lowballing is unlikely to land.
- 4 sale attempts since 7y ago with the ask held roughly flat each time — persistent listings suggest the price (not the market) is what's stuck; bring a comps-based counter.
Risks & watch-outs
- Watch-outs: built in 1951 — expect roof / HVAC / electrical / plumbing capex.
Questions for the listing agent
- Built in 1951 — when were the roof, HVAC, electrical panel, plumbing, and water heater last replaced?
- Is there a deadline driving the sale (1031 exchange, divorce, estate, relocation)? That informs how much negotiation room exists.
- Schools are D-rated, which usually means shorter tenancies and higher turnover. Who's the typical renter profile here, and what's been the actual vacancy rate?
- What's the average days-on-market for RENTAL listings here right now (not sales)? A rising rental-DOM trend means longer vacancies and softer asking-rent achievability than the comps imply.
- What's the recent tenant-quality profile in this submarket — average credit score on applications, eviction rate, late-payment / NSF rate, and stable-employment percentage? A property-management company in the area should have these aggregated.
- How much new for-sale + rental construction is in the pipeline within 1–3 miles? Heavy new supply typically softens prices + rents 12–24 months out; constrained supply supports both.
Investment metrics
- 1% rule
- 1.04% ✓
- Cap rate
- 6.98%
- Cash-on-cash
- 2.46%
- DSCR
- 1.11
- GRM
- 8.0
CMA / ARV
- ARV (on-the-fly)
- $255,606
- Comps found
- 12
Show comp detail 12 sales within ~0.75 mi
| Address | Dist | Beds/Ba | Sqft | Sold | Price | $/sf | Match |
|---|---|---|---|---|---|---|---|
| 8617 Major Ave | 0.09mi | 3/1.0 | 1,056 (-7%) | 2mo | $295,000 | $279 | 81 |
| 5640 W 84th St | 0.32mi | 3/2.0 | 1,114 (-2%) | 2mo | $242,600 | $218 | 79 |
| 5500 W 83rd Pl | 0.40mi | 3/3.0 | 1,200 (+6%) | 2mo | $392,000 | $327 | 63 |
| 5312 Kimball Pl | 0.50mi | 3/2.0 | 1,217 (+8%) | 1mo | $275,000 | $226 | 61 |
| 8736 S 51st Ave | 0.64mi | 3/1.5 | 1,082 (-4%) | 2mo | $250,000 | $231 | 61 |
| 5192 Otto Pl | 0.67mi | 3/1.5 | 1,200 (+6%) | 2mo | $250,000 | $208 | 57 |
| 6024 W 87th St | 0.56mi | 2/1.0 (-1) | 1,215 (+7%) | 2mo | $182,100 | $150 | 53 |
| 5252 W 89th St | 0.53mi | 3/1.0 | 1,288 (+14%) | 3mo | $289,000 | $224 | 48 |
| 5831 W 89th St | 0.49mi | 4/1.5 (+1) | 1,294 (+14%) | 2mo | $290,000 | $224 | 46 |
| 8930 Mcvicker Ave | 0.72mi | 3/1.5 | 1,260 (+11%) | 2mo | $370,000 | $294 | 45 |
| 8204 Austin Ave | 0.74mi | 4/1.0 (+1) | 1,242 (+10%) | 1mo | $215,300 | $173 | 41 |
| 5707 W 90th Pl | 0.55mi | 4/2.5 (+1) | 1,300 (+15%) | 1mo | $350,000 | $269 | 40 |
Match score weights: distance 35% · size 25% · config 20% · recency 20%. Top-matched comps best support the ARV.
Projected returns pro-forma
-3.0% appreciation · 3.0% rent growth · sell at horizon
- IRR
- -12.3%
- Equity multiple
- 0.55×
- Total profit
- $-27,452
- Equity at exit
- $32,788
- IRR
- -3.1%
- Equity multiple
- 0.79×
- Total profit
- $-12,993
- Equity at exit
- $19,013
Cash invested: $61,572 (down + closing). Projections, not guarantees.
Landlord ↔ Tenant lean methodology
- Overall (STATE)
- 43 Moderately Tenant-Leaning
- State Illinois
- 43 Moderately Tenant-Leaning · D+7
- County
- — inherits STATE
- City
- — inherits STATE
ZIP-level market 60459
- Active inventory
- 51
- Price-to-rent
- 8.0×
Monthly cashflow live
- Estimated rent
- $2,292 high interval (Pro) →
- Mortgage (P&I)
- −$1,153
- Tax from tax record
- −$440 /mo · $5,275/yr
- Insurance
- −$92
- HOA
- −$0
- Vacancy / Maint / Mgmt
- −$481
- Net cashflow
- $126
Break-even live
UW: 25.0% down · 7.5% · 30yr · 1.5% tax · 5.0% vac · 8.0% maint · 8.0% mgmt
Financing live
Cash to close
- Down payment
- $54,975
- Closing costs
- $6,597
- Reserves months
- —
- Total cash needed
- —
Loan-product check · same deal, 3 products live
Conventional
25% down · 7.5% · 30yr
- Down + closing
- —
- Monthly P&I
- —
- Monthly cashflow
- —
- DSCR
- —
- Eligible?
- —
Personal DTI + credit; lowest rate.
DSCR
20% down · 8.5% · 30yr
- Down + closing
- —
- Monthly P&I
- —
- Monthly cashflow
- —
- DSCR
- —
- Eligible?
- —
No personal income docs; deal must DSCR.
Hard money
10% down · 12.0% · 12mo
- Down + closing
- —
- Monthly P&I
- —
- Monthly cashflow
- —
- DSCR
- —
- Eligible?
- —
Short-term bridge; refi at stabilization.
Rent comps 13 comps
| Address | Beds | Baths | Sqft | Rent | $/sqft | DOM | Units | Dist |
|---|---|---|---|---|---|---|---|---|
| 5217 W 87th St Unit 2 Oak Lawn, IL | 3.0 | 1.0 | 1200 | $1,800 | $1.50 | 7d | 1 | 0.42mi |
| 5834 W 89th Pl Oak Lawn, IL | 3.0 | 1.0 | 1100 | $2,150 | $1.95 | 22d | 1 | 0.48mi |
| 6101 W 82nd Pl Burbank, IL | 3.0 | 2.0 | 1071 | $2,900 | $2.71 | 1d | 1 | 0.80mi |
| 6048 W 79th St Unit 3 Burbank, IL | 3.0 | 1.0 | 1200 | $2,100 | $1.75 | 5d | 1 | 1.12mi |
| 6101 W 94th St Unit A2 Oak Lawn, IL | 2.0 | 2.0 | 1100 | $1,900 | $1.73 | 5d | 1 | 1.14mi |
| 9517 Minnick Ave Oak Lawn, IL | 2.0 | 2.0 | 900 | $2,000 | $2.22 | 5d | 1 | 1.15mi |
| 7732 Lotus Ave Burbank, IL | 3.0 | 1.0 | 1056 | $2,475 | $2.34 | 22d | 1 | 1.17mi |
| 7732 Lotus Ave Burbank, IL | 3.0 | 1.0 | 1065 | $2,475 | $2.32 | 24d | 1 | 1.17mi |
| 9522 S 53rd Ave Unit 3S Oak Lawn, IL | 2.0 | 1.0 | 900 | $2,150 | $2.39 | 24d | 1 | 1.18mi |
| 9522 S 53rd Ave Unit 1N Oak Lawn, IL | 2.0 | 1.0 | 900 | $2,150 | $2.39 | 10d | 1 | 1.18mi |
| 9154 Ridgeland Ave Oak Lawn, IL | 3.0 | 1.0 | 816 | $2,300 | $2.82 | 14d | 1 | 1.21mi |
| 7847 Melvina Ave Burbank, IL | 3.0 | 1.0 | 1056 | $3,900 | $3.69 | 1d | 1 | 1.22mi |
| 5100 W 96th St Oak Lawn, IL | 2.0 | 2.0 | 1380 | $2,350 | $1.70 | 3d | 1 | 1.31mi |
Listing history 3 events
-
2026-06-18remarks 667-char remark
-
2026-06-17remarks 567-char remark
-
2026-06-17$219,900 Active 1 DOM
ⓘ Source: listings_history table (triggers on properties + properties_extension) + one-shot
backfill from property_details.listing_events for pre-trigger history.
Tax reassessment forecast IL · Partial reset (capped growth)
- Current annual tax
- $5,275 · $440/mo
- Projected year-2 tax
- $5,275 · $440/mo
- Expected delta
- $0/yr ($0/mo · 0.0%)
ⓘ Screening estimate from a state-policy table — verify with the county assessor before closing.
Climate risk First Street
- Flood 4/10 Moderate FEMA zone X (unshaded) · 22% chance over 30 yrs
- Wildfire 1/10 Low
- Heat 3/10 Moderate 7 d/yr ≥100°F today · 15 d/yr by 30 yrs out
- Wind 2/10 Low 0% chance of damaging wind over 30 yrs
- Air quality 3/10 Moderate 4 unhealthy d/yr today · 4 by 30 yrs out
Nearby sold comps map
Loading sold comps map…
Walkable amenities ~0.75 mi
Loading nearby amenities…
Taxation est. · year 1
- Rental income
- $27,504
- − Mortgage interest
- −$12,318
- − Property taxes
- −$5,275
- − Insurance
- −$1,100
- − Repairs & maintenance
- −$2,200
- − Management
- −$2,200
- − Depreciation
- −$6,397
- Taxable loss
- −$1,986
- Est. tax savings @ 24.0%
- +$477
- After-tax cash flow
- $1,992/yr
For passive investors: Depreciation is non-cash, so a rental often shows a tax loss while cash-flowing — sheltering income. Rental losses are passive: they offset passive income freely, and up to $25,000/yr can offset ordinary (W-2) income if you actively participate and your MAGI is under $100k (phasing out to $0 by $150k); unused losses carry forward. On sale, claimed depreciation is recaptured at up to 25%, and gains may owe capital-gains tax (a 1031 exchange can defer both). Figures are a year-1 estimate at your 24.0% rate — not tax advice; consult a CPA.
Schools (NCES district)
- District
- Reavis Twp Hsd 220
- NCES district ID
- 1733270
- Math proficiency
- 18% ▼ -3.00%
- Reading proficiency
- 21% ▼ -4.00%
- Median HH income
- $54,732
- Composite
- 17.94/100
- National rank
- #8994
- State rank
- #420 of 620 in IL
Livability — Burbank
- Score
- 78/100
- State rank
- #132
- US rank
- #2422
Category grades
Schools grade is shown separately in the Schools card above.
Census & demographics
- Census place
- Burbank, IL
- City population
- 28,822
- Population (ZIP)
- 28,822
Population outlook (Cook County) Hauer SSP2
- Today (2025)
- 5,347,519 people
- By 2030
- 5,357,703 · +0.2%
- By 2040
- 5,324,924 · -0.4%
- By 2050
- 5,230,762 · -2.2%
- By 2075
- 4,785,735 · -10.5%
- By 2100
- 4,188,836 · -21.7%
Race, ethnicity, and origin ACS 2023
- Neighborhood character
- Diverse neighborhood (Simpson 0.56)
- Race & ethnicity
- Hispanic / Latino 50% White 44% Two or more races 21% Asian 3% Black 1%
- Hispanic origin (detail)
- Mexican 45% Puerto Rican 2%
- Common ancestry
- Romanian 17% Armenian 1% Iranian 1%
- Foreign-born
- 32% · Canada, Jamaica, Vietnam
- Languages at home
- 40% English-only · Spanish 39% Russian/Polish/Slavic 12% Arabic 5%
Political lean MEDSL · Cook
- 2024 margin
- Solid D (+42.0) · D 70.4% · R 28.4% · Other 1.2%
- 2008→2024 swing
- -11.4pp toward R · 2008: 53.4pp · 2024: 42.0pp
- All cycles
- 2024: D+42.0 2020: D+50.3 2016: D+53.0 2012: D+49.4 2008: D+53.4
Not yet ingested
- Civics
- —
Market trends
- HPI YoY
- ▼ -188.56%
- Current HPI
- 223.2294
- Rent YoY
- —
- Metro
- —
- State GDP YoY
- ▲ 1.59%
- F500 in state
- 60
Industry mix (Fortune 500 HQ in IL)
| Industry | F500 HQs | Revenue |
|---|---|---|
| Insurance | 4 | $201B |
|
||
| Consumer Goods | 4 | $87B |
|
||
| Industrial Machinery | 3 | $64B |
|
||
| Healthcare | 2 | $55B |
|
||
| Retail / Pharmacy | 1 | $148B |
|
||
| Agriculture / Food | 1 | $86B |
|
||
Price history
+216.4% since first listed13 events — show timeline
- 2026-06-17 Listed $219,900 MRED as Distributed by MLS Grid
- 2025-11-21 Sold (Public Records) $200,000 Public Records
- 2025-11-10 Sold (MLS) $200,000 MRED as Distributed by MLS Grid
- 2025-10-15 Contingent — MRED as Distributed by MLS Grid
- 2025-09-29 Price Changed $220,000 MRED as Distributed by MLS Grid
- 2025-09-12 Listed $230,000 MRED as Distributed by MLS Grid
- 2019-11-14 Sold (Public Records) $60,000 Public Records
- 2019-10-08 Sold (MLS) $60,000 MRED as Distributed by MLS Grid
- 2019-09-24 Contingent — MRED as Distributed by MLS Grid
- 2019-08-22 Relisted — MRED as Distributed by MLS Grid
- 2019-08-11 Pending — MRED as Distributed by MLS Grid
- 2019-08-11 Listed $109,900 MRED as Distributed by MLS Grid
- 1997-01-03 Sold (Public Records) $69,500 Public Records
Property tax history
+4.5%/yrLatest (2023): $5,275 · +4.6% YoY. Source: county tax records.
Cash-flow waterfall
monthlySold comps — $/sqft
last 12 mo · ≤1 miLoading sold comps…