8946 6th Ave · Jacksonville, FL
Flood risk 6/10 · Moderate
- FEMA flood zone
- X (unshaded)
- Chance of flooding over 30 yrs
- 0.68%
- Est. flood insurance / yr
- $507 – $1,088
Fire risk 1/10 · Minimal
- Est. fire insurance / yr
- $947 – $1,759
Heat risk 9/10 · Severe
- Hot days now (above 107°F)
- 7 days/yr
- Hot days in 30 yrs
- 20 days/yr
Wind risk 9/10 · Severe
- Chance of severe wind over 30 yrs
- 99.0%
Air-quality risk 4/10 · Minor
- Unhealthy air days now
- 6 days/yr
- Unhealthy air days in 30 yrs
- 6 days/yr
Risk factors via First Street. Map © Google.
Why this score? — see what drove the F grade
The composite is a weighted blend of 9 inputs, each scored 0–100. Each bar is that input's sub-score; the figure is the points it added to the 100-point composite (weight × sub-score).
- Cash flow +13.9/30.0
- DSCR +4.2/10.0
- Livability +4.2/5.0
- Schools +3.9/10.0
- 1% rule +2.9/10.0
- Condition / age +2.5/5.0
- Rent growth +2.2/5.0
- ARV discount +0.0/15.0
- Appreciation +0.0/10.0
$185,000
🖨 Deal sheet (PDF) 📄 Offer letter ✓ Due diligence
Listing remarks
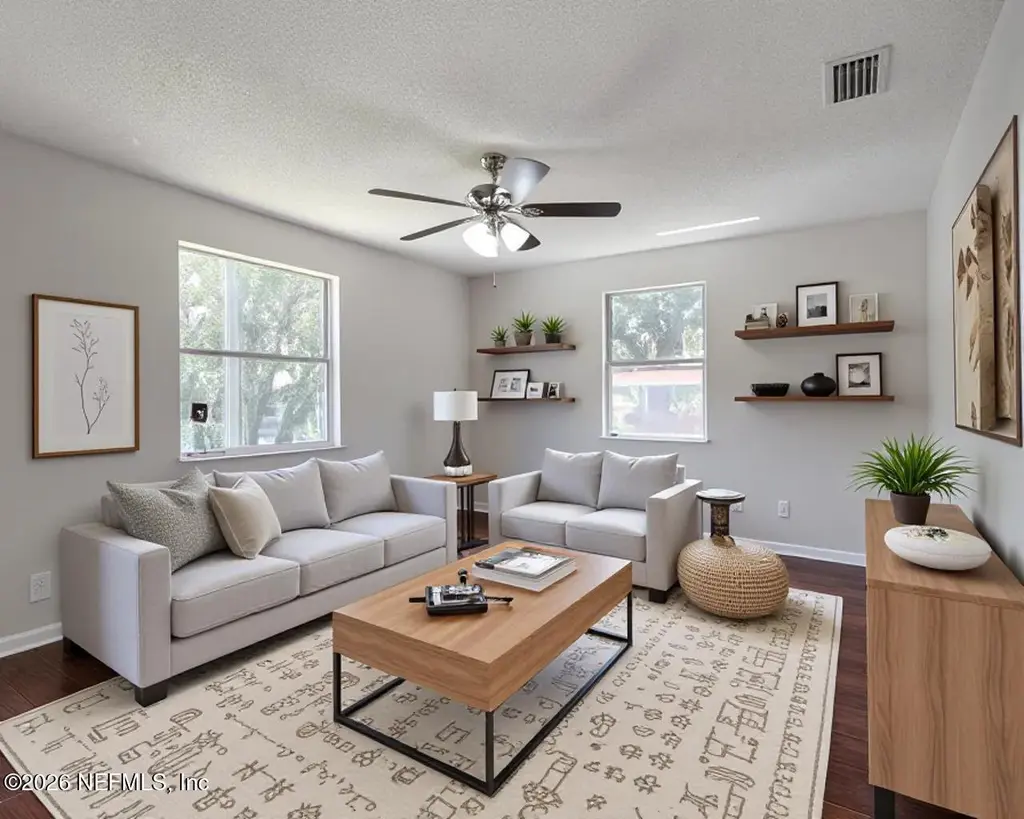
Welcome home to this beautifully remodeled 3-bedroom, 2-bath block stucco home nestled in the desirable Riverview neighborhood! Offering 1,196 sq ft of refreshed living space, this charming property combines modern updates with timeless durability. Step inside to discover a stylish remodeled interior featuring updated finishes, an inviting layout, and bright living spaces designed for comfortable everyday living. The spacious kitchen flows seamlessly into the main living areas, creating the ideal setting for entertaining family and friends. Enjoy peace of mind with a roof replaced in 2013, plus the convenience of city water and septic. Built in 1988, this home offers solid block constructio
Key facts
- 4,791 sq ft lot
- Garage
- Built 1988
Property features AI
Finance
- HOA & community: Not a senior community
Exterior
- Parking: Attached garage (1 car); On-street parking; Off-street parking
- Utilities: Septic tank; Electricity connected; Water connected; Sewer connected
- Home design: Single family residence; One level, entry at level 1
- Construction: Block and stucco construction; Shingle roof
- Exterior features: Back yard with wood fencing; City street frontage; Asphalt road surface
Interior
- Kitchen: Electric range; Refrigerator
- Bedrooms: 3 bedrooms
- Flooring: Carpet; Tile; Vinyl
- Bathrooms: 2 full bathrooms
- Heating & cooling: Central heating (electric); Central air conditioning (electric)
- Interior features: Ceiling fans; Eat-in kitchen; Primary bathroom with tub and shower
- Laundry & utility: Washer hookup; Electric dryer hookup; Laundry area in garage
Neighborhood map
What this means for you Summary
Snapshot
- This is a 3-bed/2.0-bath single-family listed at $185k.
Deal economics
- At list price, monthly cash flow is $22 ($263/yr) — positive.
- The deal already cash-flows at list — no discount required.
- To meet the 1% rule (rent ≥ 1% of price), the offer needs to be $145k (21.4% below list).
- Recommended offer: $145k (21.4% below list) — sets the bar for 1% rule.
- Cap rate 6.4% vs local median 3.9% in Jacksonville — top-decile yield for the area; either an underpriced asset or a hidden risk that comps aren't pricing in. Stress-test before assuming the spread holds.
Location & tenants
- Location reads 83/100 on livability (#50 in FL, #911 nationally) — a professional / high-income tenant draw. Strengths: amenities A+, commute A+, housing A+.
- Duval (urban): math 46% / reading 45% proficiency, ranked #48 of 73 in FL (top 66%) — families likely to look elsewhere, expect single-tenant / working-renter base with shorter leases.
- Zoned schools: Grasp Academy (math 18% / reading 14%, grade F, #2,130 of 2,144 statewide, top 99%, 271 students, 52% FRL); Jean Ribault Middle School (math 28% / reading 24%, grade F, #506 of 571 statewide, top 89%, 679 students, 78% FRL); Jean Ribault High School (math 22% / reading 25%, grade F, #533 of 667 statewide, top 80%, 1,385 students, 71% FRL) — zoned schools average 67% FRL vs 49% district-wide (17 pts higher); higher-poverty schools than district average — tighter screening recommended.
- Zoned-school proficiency averages 22% at this address vs 46% district-wide (-24 pts) — the specific schools serving this property underperform the Duval average; the district grade overstates school quality for this exact location.
- Market conditions: Rents soft (-1.4%/yr); 294 active listings in the ZIP; 38 comparable units currently listed for rent nearby; rentals at typical pace (median 26d on market — plan ~3-4 weeks tenant-placement turnaround); lower-income renter base — watch delinquency; 6,503 units permitted in Duval County in 2024 (1,131 in 5+ unit buildings).
- This rent runs 42% of the median local income ($41k/yr) — at the standard rent-burdened threshold; future hikes will face affordability resistance.
Forward outlook
- Local home prices are declining (-3.0%/yr); year-one equity from $1k of loan paydown is wiped out by about $6k of value loss. Plan a longer hold.
- Duval County population projected at +19% by 2050 — long-run rental-demand tailwind backs the buy-and-hold thesis.
Negotiation context
- It's been on market 24 days — a 2% lower offer ($182k) is reasonable based on typical stale-listing flexibility.
- Current owner paid $50k; list at $185k implies a 274% gain — meaningful room to come down on a strong offer.
Risks & watch-outs
- Climate carrying-cost: major flood risk; severe wind risk, 99% chance of damaging wind over 30y; extreme-heat days projected 7→20/yr by 2055 (HVAC capex compounding) — expect insurance premiums to compound above CPI over the hold.
Questions for the listing agent
- Is there a deadline driving the sale (1031 exchange, divorce, estate, relocation)? That informs how much negotiation room exists.
- Schools are B-rated — typically a magnet for longer-tenancy family renters. What's the average tenant stay here, and is there a school-zone premium baked into asking?
- The area grade is low — what's the realistic commute time and amenity access for the typical tenant pool here? Any planned neighborhood developments (good or bad) we should know about?
- What's the average days-on-market for RENTAL listings here right now (not sales)? A rising rental-DOM trend means longer vacancies and softer asking-rent achievability than the comps imply.
- What's the recent tenant-quality profile in this submarket — average credit score on applications, eviction rate, late-payment / NSF rate, and stable-employment percentage? A property-management company in the area should have these aggregated.
- How much new for-sale + rental construction is in the pipeline within 1–3 miles? Heavy new supply typically softens prices + rents 12–24 months out; constrained supply supports both.
Investment metrics
- 1% rule
- 0.79% ✗
- Cap rate
- 6.44%
- Cash-on-cash
- 0.51%
- DSCR
- 1.02
- GRM
- 10.6
CMA / ARV
- ARV (on-the-fly)
- $157,872
- Comps found
- 12
Show comp detail 12 sales within ~0.75 mi
| Address | Dist | Beds/Ba | Sqft | Sold | Price | $/sf | Match |
|---|---|---|---|---|---|---|---|
| 9027 5th Ave | 0.11mi | 3/2.0 | 1,209 (+1%) | 2mo | $243,020 | $201 | 92 |
| 9124 5th Ave | 0.20mi | 3/1.0 | 1,220 (+2%) | 2mo | $180,000 | $148 | 81 |
| 8956 5th Ave | 0.05mi | 3/1.0 | 1,284 (+7%) | 4mo | $80,000 | $62 | 78 |
| 9062 2nd Ave | 0.23mi | 2/2.0 (-1) | 1,232 (+3%) | 2mo | $149,900 | $122 | 78 |
| 8951 6th Ave | 0.03mi | 2/1.0 (-1) | 1,122 (-6%) | 3mo | $108,000 | $96 | 77 |
| 9070 3rd Ave | 0.20mi | 3/2.0 | 1,300 (+9%) | 1mo | $170,000 | $131 | 76 |
| 9224 10th Ave | 0.37mi | 4/2.0 (+1) | 1,170 (-2%) | 0mo | $169,000 | $144 | 74 |
| 1819 Clyde St | 0.48mi | 3/1.0 | 1,204 (+1%) | 3mo | $137,000 | $114 | 70 |
| 9166 3rd Ave | 0.30mi | 4/2.0 (+1) | 1,352 (+13%) | 3mo | $178,000 | $132 | 57 |
| 8608 2nd Ave | 0.41mi | 3/2.0 | 1,045 (-13%) | 4mo | $155,000 | $148 | 57 |
| 6805 Restlawn Dr | 0.71mi | 3/2.0 | 1,134 (-5%) | 2mo | $139,999 | $123 | 56 |
| 1436 Forest Hills Rd | 0.72mi | 3/1.0 | 1,322 (+10%) | 0mo | $182,000 | $138 | 44 |
Match score weights: distance 35% · size 25% · config 20% · recency 20%. Top-matched comps best support the ARV.
Projected returns pro-forma
-3.0% appreciation · 0.0% rent growth · sell at horizon
- IRR
- -18.6%
- Equity multiple
- 0.36×
- Total profit
- $-32,913
- Equity at exit
- $27,584
- IRR
- -17.5%
- Equity multiple
- 0.16×
- Total profit
- $-43,618
- Equity at exit
- $15,995
Cash invested: $51,800 (down + closing). Projections, not guarantees.
Landlord ↔ Tenant lean methodology
- Overall (STATE)
- 87 Strongly Landlord-Friendly
- State Florida
- 87 Strongly Landlord-Friendly · R+3
- County
- — inherits STATE
- City
- — inherits STATE
ZIP-level market 32208
- Home prices YoY
- -33.6%
- Rents YoY
- -1.4%
- Active inventory
- 294
- Price-to-rent
- 10.6×
Monthly cashflow live
- Estimated rent
- $1,454 high interval (Pro) →
- Mortgage (P&I)
- −$970
- Tax from tax record
- −$79 /mo · $953/yr
- Insurance
- −$77
- HOA
- −$0
- Vacancy / Maint / Mgmt
- −$305
- Net cashflow
- $22
Break-even live
Sensitivity live
| Price | -10% $127 | -5% $74 | +0% $22 | +5% $-30 | +10% $-83 |
|---|---|---|---|---|---|
| Rent | -10% $-93 | -5% $-35 | +0% $22 | +5% $79 | +10% $137 |
| Rate | -1.0pp $115 | -0.5pp $69 | base $22 | +0.5pp $-26 | +1.0pp $-75 |
UW: 25.0% down · 7.5% · 30yr · 1.5% tax · 5.0% vac · 8.0% maint · 8.0% mgmt
Financing live
Cash to close
- Down payment
- $46,250
- Closing costs
- $5,550
- Reserves months
- —
- Total cash needed
- —
Loan-product check · same deal, 3 products live
Conventional
25% down · 7.5% · 30yr
- Down + closing
- —
- Monthly P&I
- —
- Monthly cashflow
- —
- DSCR
- —
- Eligible?
- —
Personal DTI + credit; lowest rate.
DSCR
20% down · 8.5% · 30yr
- Down + closing
- —
- Monthly P&I
- —
- Monthly cashflow
- —
- DSCR
- —
- Eligible?
- —
No personal income docs; deal must DSCR.
Hard money
10% down · 12.0% · 12mo
- Down + closing
- —
- Monthly P&I
- —
- Monthly cashflow
- —
- DSCR
- —
- Eligible?
- —
Short-term bridge; refi at stabilization.
Rent comps 38 comps
| Address | Beds | Baths | Sqft | Rent | $/sqft | DOM | Units | Dist |
|---|---|---|---|---|---|---|---|---|
| 9017 6th Ave Jacksonville, FL | 2.0 | 1.0 | 1038 | $1,098 | $1.06 | 25d | 1 | 0.09mi |
| 9032 8th Ave Jacksonville, FL | 3.0 | 2.0 | 1300 | $1,500 | $1.15 | 25d | 1 | 0.13mi |
| 9050 7th Ave Jacksonville, FL | 3.0 | 1.0 | 896 | $1,485 | $1.66 | 25d | 1 | 0.13mi |
| 9037 6th Ave Jacksonville, FL | 3.0 | 2.0 | 1156 | $1,400 | $1.21 | 25d | 1 | 0.14mi |
| 8973 4th Ave Jacksonville, FL | 3.0 | 2.0 | 1230 | $1,438 | $1.17 | 16d | 1 | 0.15mi |
| 8721 4th Ave Jacksonville, FL | 3.0 | 1.5 | 1344 | $1,399 | $1.04 | 25d | 1 | 0.26mi |
| 8918 1st Ave Jacksonville, FL | 3.0 | 2.0 | 1435 | $1,321 | $0.92 | 18d | 1 | 0.26mi |
| 9131 4th Ave Jacksonville, FL | 3.0 | 2.0 | 1209 | $1,496 | $1.24 | 23d | 1 | 0.27mi |
| 8663 5th Ave Jacksonville, FL | 2.0 | 1.0 | 720 | $1,045 | $1.45 | 25d | 1 | 0.28mi |
| 9141 12th Ave Jacksonville, FL | 3.0 | 2.0 | 1209 | $1,598 | $1.32 | 22d | 1 | 0.34mi |
| 8642 2nd Ave Jacksonville, FL | 3.0 | 2.0 | 1074 | $1,245 | $1.16 | 3d | 1 | 0.37mi |
| 9279 6th Ave Jacksonville, FL | 3.0 | 2.0 | 1150 | $1,245 | $1.08 | 6d | 1 | 0.38mi |
| 8617 3rd Ave Jacksonville, FL | 3.0 | 1.0 | 1048 | $1,200 | $1.15 | 12d | 1 | 0.39mi |
| 9148 13th Ave Jacksonville, FL | 3.0 | 1.0 | 1126 | $1,136 | $1.01 | 5d | 1 | 0.40mi |
| 8910 Adams Ave Jacksonville, FL | 4.0 | 2.0 | 1250 | $1,225 | $0.98 | 4d | 1 | 0.40mi |
| 9124 Adams Ave Jacksonville, FL | 3.0 | 3.0 | 1207 | $1,800 | $1.49 | 25d | 1 | 0.45mi |
| 9346 10th Ave Jacksonville, FL | 3.0 | 1.0 | 985 | $1,825 | $1.85 | 25d | 1 | 0.50mi |
| 9131 Jefferson Ave Jacksonville, FL | 3.0 | 1.0 | 910 | $1,350 | $1.48 | 5d | 1 | 0.53mi |
| 3015 Lansdell Dr Jacksonville, FL | 3.0 | 1.0 | 1150 | $1,350 | $1.17 | 25d | 1 | 0.57mi |
| 1975 Rugby Rd Jacksonville, FL | 2.0 | 1.0 | 992 | $1,100 | $1.11 | 9d | 1 | 0.59mi |
| 3250 Soutel Dr Jacksonville, FL | 3.0 | 2.0 | 1352 | $1,525 | $1.13 | 25d | 1 | 0.65mi |
| 2389 Hilly Rd Jacksonville, FL | 3.0 | 1.0 | 908 | $1,650 | $1.82 | 25d | 1 | 0.71mi |
| 3344 Soutel Dr Jacksonville, FL | 3.0 | 1.0 | 1142 | $1,325 | $1.16 | 25d | 1 | 0.78mi |
| 9565 Carbondale Dr W Unit B Jacksonville, FL | 3.0 | 2.0 | 1400 | $2,000 | $1.43 | 25d | 1 | 0.84mi |
| 2534 Aubrey Ave Jacksonville, FL | 4.0 | 2.0 | 759 | $1,250 | $1.65 | 25d | 1 | 0.91mi |
| 7927 Reid Ave Jacksonville, FL | 3.0 | 1.0 | 1055 | $1,500 | $1.42 | 25d | 1 | 0.93mi |
| 2312 Palmdale St Jacksonville, FL | 3.0 | 2.0 | 972 | $1,231 | $1.27 | 25d | 1 | 0.93mi |
| 1021 Lake Forest Blvd Jacksonville, FL | 3.0 | 1.0 | 1393 | $1,290 | $0.93 | 4d | 1 | 0.97mi |
| 8253 Lexington Dr Jacksonville, FL | 3.0 | 1.0 | 910 | $1,330 | $1.46 | 25d | 1 | 1.05mi |
| 915 Wayne St Jacksonville, FL | 4.0 | 2.0 | 1220 | $1,313 | $1.08 | 4d | 1 | 1.07mi |
| 912 Saratoga Blvd Jacksonville, FL | 3.0 | 1.0 | 930 | $1,250 | $1.34 | 25d | 1 | 1.08mi |
| 2818 Palmdale St Jacksonville, FL | 4.0 | 2.5 | 1484 | $1,900 | $1.28 | 25d | 1 | 1.10mi |
| 1010 Edgewood Ave W Jacksonville, FL | 4.0 | 2.0 | 1450 | $1,250 | $0.86 | 16d | 1 | 1.18mi |
| 1010 Edgewood Ave W Jacksonville, FL | 4.0 | 2.0 | 1450 | $1,250 | $0.86 | 25d | 1 | 1.18mi |
| 3848 Soutel Dr Jacksonville, FL | 3.0 | 2.0 | 1230 | $1,541 | $1.25 | 9d | 1 | 1.19mi |
| 1000 Island Point Dr Jacksonville, FL | 1.0–3.0 | 1.0–2.0 | 949 | $1,684 | $1.77 | 4d | 9 | 1.42mi |
| 8516 Bermuda Rd Jacksonville, FL | 3.0 | 2.0 | 1492 | $1,625 | $1.09 | 22d | 1 | 1.42mi |
| 5903 Droad St Jacksonville, FL | 3.0 | 1.0 | 1161 | $1,400 | $1.21 | 4d | 1 | 1.43mi |
Listing history 17 events
-
2026-06-21days on market $185,000 Active 24 DOM
-
2026-06-18days on market $185,000 Active 21 DOM
-
2026-06-17days on market $185,000 Active 20 DOM
-
2026-06-16days on market $185,000 Active 19 DOM
-
2026-06-15days on market $185,000 Active 18 DOM
-
2026-06-13days on market $185,000 Active 16 DOM
-
2026-06-13pricedays on market $185,000 Active 15 DOM
-
2026-06-10days on market $190,000 Active 12 DOM
-
2026-06-08days on market $190,000 Active 11 DOM
-
2026-06-07days on market $190,000 Active 10 DOM
-
2026-06-05days on market $190,000 Active 7 DOM
-
2026-06-03days on market $190,000 Active 6 DOM
-
2026-06-02days on market $190,000 Active 5 DOM
-
2026-06-01days on market $190,000 Active 4 DOM
-
2026-05-31days on market $190,000 Active 3 DOM
-
2026-05-28$190,000 Active
-
1988-06-01soldstatus $49,500
ⓘ Source: listings_history table (triggers on properties + properties_extension) + one-shot
backfill from property_details.listing_events for pre-trigger history.
Tax reassessment forecast FL · Resets to sale price
- Current annual tax
- $953 · $79/mo
- Projected year-2 tax
- $1,536 · $128/mo
- Expected delta
- +$582/yr (+$49/mo · 61.0%)
ⓘ Screening estimate from a state-policy table — verify with the county assessor before closing.
Climate risk First Street
- Flood 6/10 Major FEMA zone X (unshaded) · 68% chance over 30 yrs
- Wildfire 1/10 Low
- Heat 9/10 Extreme 7 d/yr ≥107°F today · 20 d/yr by 30 yrs out
- Wind 9/10 Extreme 99% chance of damaging wind over 30 yrs
- Air quality 4/10 Moderate 6 unhealthy d/yr today · 6 by 30 yrs out
Nearby sold comps map
Loading sold comps map…
Walkable amenities ~0.75 mi
Loading nearby amenities…
Taxation est. · year 1
- Rental income
- $17,448
- − Mortgage interest
- −$10,363
- − Property taxes
- −$953
- − Insurance
- −$925
- − Repairs & maintenance
- −$1,396
- − Management
- −$1,396
- − Depreciation
- −$5,382
- Taxable loss
- −$2,967
- Est. tax savings @ 24.0%
- +$712
- After-tax cash flow
- $975/yr
For passive investors: Depreciation is non-cash, so a rental often shows a tax loss while cash-flowing — sheltering income. Rental losses are passive: they offset passive income freely, and up to $25,000/yr can offset ordinary (W-2) income if you actively participate and your MAGI is under $100k (phasing out to $0 by $150k); unused losses carry forward. On sale, claimed depreciation is recaptured at up to 25%, and gains may owe capital-gains tax (a 1031 exchange can defer both). Figures are a year-1 estimate at your 24.0% rate — not tax advice; consult a CPA.
Schools (NCES district)
- District
- Duval
- NCES district ID
- 1200480
- Math proficiency
- 46% ▼ -11.00%
- Reading proficiency
- 45% ▼ -4.00%
- Median HH income
- $48,987
- Composite
- 38.97/100
- National rank
- #4076
- State rank
- #48 of 73 in FL
Livability — Jacksonville
- Score
- 83/100
- State rank
- #50
- US rank
- #911
Category grades
Schools grade is shown separately in the Schools card above.
Census & demographics
- Census place
- Jacksonville, FL
- County
- Duval County · 1,015,274 people
- City population
- 979,034
- Metro
- Jacksonville, FL
- Population (ZIP)
- 32,699
- Household income
- $41,324
- Rent vs Own
- Severe rent burden
- 1765.0
Population outlook (Duval County) Hauer SSP2
- Today (2025)
- 1,013,010 people
- By 2030
- 1,059,228 · +4.6%
- By 2040
- 1,141,439 · +12.7%
- By 2050
- 1,205,258 · +19.0%
- By 2075
- 1,324,282 · +30.7%
- By 2100
- 1,319,620 · +30.3%
Race, ethnicity, and origin ACS 2023
- Neighborhood character
- Predominantly Black (77%)
- Race & ethnicity
- Black 77% White 16% Two or more races 4% Hispanic / Latino 3%
- Common ancestry
- Italian 1%
- Foreign-born
- 2% · Canada
- Languages at home
- 97% English-only · Spanish 2%
Political lean MEDSL · Duval
- 2024 margin
- Toss-up / Even · D 48.7% · R 50.1% · Other 1.2%
- 2008→2024 swing
- +0.4pp no change · 2008: -1.9pp · 2024: -1.5pp
- All cycles
- 2024: R+1.5 2020: D+3.8 2016: R+1.5 2012: R+3.6 2008: R+1.9
Not yet ingested
- Civics
- —
Market trends
- HPI YoY
- ▼ -110.56%
- Current HPI
- 217.9706
- Rent YoY
- ▼ -1.36%
- Metro
- Jacksonville, FL
- State GDP YoY
- ▲ 3.28%
- F500 in state
- 36
Industry mix (Fortune 500 HQ in FL)
| Industry | F500 HQs | Revenue |
|---|---|---|
| Industrial Technology | 2 | $29B |
|
||
| Insurance | 2 | $17B |
|
||
| Retail | 1 | $60B |
|
||
| Technology Distribution | 1 | $58B |
|
||
| Homebuilding | 1 | $35B |
|
||
| Technology Manufacturing | 1 | $35B |
|
||
Price history
+283.8% since first listed2 events — show timeline
- 2026-05-28 Listed $190,000 realMLS
- 1988-06-01 Sold (Public Records) $49,500 Public Records
Property tax history
+2.2%/yrLatest (2025): $953 · +23.5% YoY. Source: county tax records.
Cash-flow waterfall
monthlySold comps — $/sqft
last 12 mo · ≤1 miLoading sold comps…