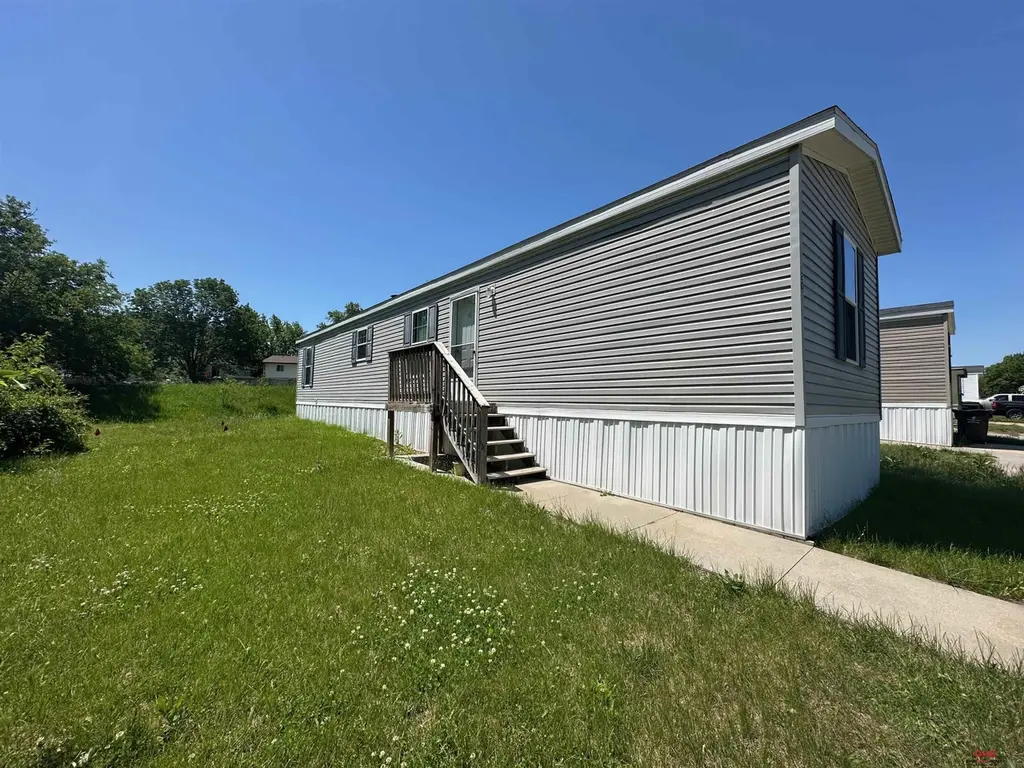
201 W Treehaven Dr · Lincoln, NE
Flood risk 1/10 · Minimal
- FEMA flood zone
- X (unshaded)
- Chance of flooding over 30 yrs
- 0.0%
- Est. flood insurance / yr
- $507 – $1,088
Fire risk 1/10 · Minimal
- Est. fire insurance / yr
- $1,161 – $2,155
Heat risk 3/10 · Minor
- Hot days now (above 105°F)
- 7 days/yr
- Hot days in 30 yrs
- 16 days/yr
Wind risk 2/10 · Minimal
- Chance of severe wind over 30 yrs
- —
Air-quality risk 1/10 · Minimal
- Unhealthy air days now
- 0 days/yr
- Unhealthy air days in 30 yrs
- 0 days/yr
Risk factors via First Street. Map © Google.
Why this score? — see what drove the C+ grade
The composite is a weighted blend of 9 inputs, each scored 0–100. Each bar is that input's sub-score; the figure is the points it added to the 100-point composite (weight × sub-score).
- Cash flow +27.3/30.0
- 1% rule +10.0/10.0
- DSCR +9.5/10.0
- Schools +4.4/10.0
- Livability +4.2/5.0
- Condition / age +3.8/5.0
- Rent growth +3.5/5.0
- ARV discount +0.0/15.0
- Appreciation +0.0/10.0
$45,000
🖨 Deal sheet 📄 Offer letter ✓ Due diligence
Listing remarks
Great opportunity for affordable living in Contempo Park! This well-maintained mobile home, built in 2018 and lovingly cared for by its original owner, offers comfortable and low-maintenance living. Featuring 2 bedrooms and 2 bathrooms, the home boasts a functional layout with plenty of natural light and inviting living spaces. Enjoy the convenience of two off-street parking spaces, and all appliances, including the washer and dryer, are included with the sale. Don’t miss your chance to own this charming property!
Key facts
- Built 2018
- Listed 24 days
Property features AI
Finance
- Other: Living area listed as 784 square feet
- HOA & community: Homeowners association with a monthly fee of $633
Exterior
- Parking: No garage
- Utilities: Public water; Public sewer
- Home design: Residential mobile home; Not new / not a model; Single-story (main floor living); Built in 2018
- Construction: No foundation specified
- Exterior features: Deck
Interior
- Bedrooms: Master bedroom on the main floor; Second bedroom on the main floor
- Bathrooms: Two full bathrooms, both on the main floor
- Heating & cooling: Natural gas forced-air heating; Central air conditioning
- Interior features: No fireplaces; No basement
Neighborhood map
What this means for you Summary
Snapshot
- This is a 2-bed/2.0-bath manufactured listed at $45k. Condition is rated good.
Deal economics
- At list price, monthly cash flow is $130 ($2k/yr) — positive.
- The deal already cash-flows at list — no discount required.
- Meets the 1% rule at list price ($1k rent vs $45k).
- Recommended offer: $44k (1.5% below list) — sets the bar for market timing.
- Cap rate 9.8% vs local median 3.0% in Lincoln — top-decile yield for the area; either an underpriced asset or a hidden risk that comps aren't pricing in. Stress-test before assuming the spread holds.
Location & tenants
- Location reads 85/100 on livability (#5 in NE, #545 nationally) — a professional / high-income tenant draw. Strengths: amenities A+, cost of living A+, housing A+; Watch: crime D+.
- Lincoln Public Schools (urban): math 50% / reading 53% proficiency, ranked #59 of 111 in NE (top 53%) — acceptable for families but not a draw, mixed tenant base, ~2y average lease.
- Zoned schools: Belmont Elementary School (math 34% / reading 44%, grade F, #371 of 502 statewide, top 74%, 814 students, 0% FRL); Goodrich Middle School (math 38% / reading 36%, grade F, #99 of 128 statewide, top 79%, 877 students, 78% FRL); Lincoln Northeast High School (math 34% / reading 36%, grade F, #207 of 261 statewide, top 79%, 1,812 students, 62% FRL).
- Zoned-school proficiency averages 37% at this address vs 52% district-wide (-14 pts) — the specific schools serving this property underperform the Lincoln Public Schools average; the district grade overstates school quality for this exact location.
- Market conditions: Rents rising fast (+4.0%/yr); 366 active listings in the ZIP; 18 comparable units currently listed for rent nearby; rentals at typical pace (median 21d on market — plan ~3-4 weeks tenant-placement turnaround); 1,940 units permitted in Lancaster County in 2024 (895 in 5+ unit buildings).
Forward outlook
- Local home prices are declining (-3.0%/yr); year-one equity from $311 of loan paydown is wiped out by about $1k of value loss. Plan a longer hold.
- Lancaster County population projected at +37% by 2050 — long-run rental-demand tailwind backs the buy-and-hold thesis.
- At projected returns (-3.0% appreciation + 4.0% rent growth), your $13k cash investment doubles in ~8 years — after that, you're playing with house money.
Negotiation context
- It's been on market 25 days — a 2% lower offer ($44k) is reasonable based on typical stale-listing flexibility.
Risks & watch-outs
- Watch-outs: HOA is 47% of rent.
Questions for the listing agent
- What does the HOA fee cover, when was the last increase, and are there any pending special assessments or reserve-fund shortfalls?
- Is there a deadline driving the sale (1031 exchange, divorce, estate, relocation)? That informs how much negotiation room exists.
- Schools are A-rated — typically a magnet for longer-tenancy family renters. What's the average tenant stay here, and is there a school-zone premium baked into asking?
- Crime grade is D in this area — have there been break-ins, vandalism, or insurance claims at this property in the last 3 years? What carrier currently insures it and at what premium?
- What's the average days-on-market for RENTAL listings here right now (not sales)? A rising rental-DOM trend means longer vacancies and softer asking-rent achievability than the comps imply.
- What's the recent tenant-quality profile in this submarket — average credit score on applications, eviction rate, late-payment / NSF rate, and stable-employment percentage? A property-management company in the area should have these aggregated.
- How much new for-sale + rental construction is in the pipeline within 1–3 miles? Heavy new supply typically softens prices + rents 12–24 months out; constrained supply supports both.
Investment metrics
- 1% rule
- 3.02% ✓
- Cap rate
- 9.77%
- Cash-on-cash
- 12.42%
- DSCR
- 1.55
- GRM
- 2.8
CMA / ARV
- ARV (on-the-fly)
- $32,928
- Comps found
- 3
Show comp detail 3 sales within ~0.75 mi
| Address | Dist | Beds/Ba | Sqft | Sold | Price | $/sf | Match |
|---|---|---|---|---|---|---|---|
| 205 W Treehaven Dr | 0.01mi | 2/2.0 | 840 (+7%) | 2mo | $37,000 | $44 | 86 |
| 3619 NW Palm Ct | 0.13mi | 2/1.0 | 784 (0%) | 9mo | $26,000 | $33 | 83 |
| 3619 NW Magnolia Ct | 0.25mi | 2/2.0 | 840 (+7%) | 19mo | $35,000 | $42 | 61 |
Match score weights: distance 35% · size 25% · config 20% · recency 20%. Top-matched comps best support the ARV.
Projected returns pro-forma
-3.0% appreciation · 4.04% rent growth · sell at horizon
- IRR
- 5.6%
- Equity multiple
- 1.23×
- Total profit
- $2,864
- Equity at exit
- $6,710
- IRR
- 17.6%
- Equity multiple
- 2.66×
- Total profit
- $20,882
- Equity at exit
- $3,891
Cash invested: $12,600 (down + closing). Projections, not guarantees.
Landlord ↔ Tenant lean methodology
- Overall (STATE)
- 83 Strongly Landlord-Friendly
- State Nebraska
- 83 Strongly Landlord-Friendly · R+13
- County
- — inherits STATE
- City
- — inherits STATE
ZIP-level market 68521
- Home prices YoY
- -34.1%
- Rents YoY
- 4.0%
- Active inventory
- 366
- Price-to-rent
- 2.8×
Monthly cashflow live
- Estimated rent
- $1,360 high interval (Pro) →
- Mortgage (P&I)
- −$236
- Tax est. 1.5%
- −$56 /mo · $675/yr
- Insurance
- −$19
- HOA
- −$633
- Vacancy / Maint / Mgmt
- −$286
- Net cashflow
- $130
Break-even live
UW: 25.0% down · 7.5% · 30yr · 1.5% tax · 5.0% vac · 8.0% maint · 8.0% mgmt
Financing live
Cash to close
- Down payment
- $11,250
- Closing costs
- $1,350
- Reserves months
- —
- Total cash needed
- —
Loan-product check · same deal, 3 products live
Conventional
25% down · 7.5% · 30yr
- Down + closing
- —
- Monthly P&I
- —
- Monthly cashflow
- —
- DSCR
- —
- Eligible?
- —
Personal DTI + credit; lowest rate.
DSCR
20% down · 8.5% · 30yr
- Down + closing
- —
- Monthly P&I
- —
- Monthly cashflow
- —
- DSCR
- —
- Eligible?
- —
No personal income docs; deal must DSCR.
Hard money
10% down · 12.0% · 12mo
- Down + closing
- —
- Monthly P&I
- —
- Monthly cashflow
- —
- DSCR
- —
- Eligible?
- —
Short-term bridge; refi at stabilization.
Rent comps 18 comps
| Address | Beds | Baths | Sqft | Rent | $/sqft | DOM | Units | Dist |
|---|---|---|---|---|---|---|---|---|
| 2900 N 1st St Lincoln, NE | 2.0–3.0 | 1.0–2.0 | 1061 | $945 | $0.89 | 43d | 3 | 0.33mi |
| 2700 N 1st St #2 Lincoln, NE | 2.0 | 1.0 | 897 | $1,095 | $1.22 | 21d | 1 | 0.49mi |
| 4441 N 1st St Lincoln, NE | 3.0 | 1.0–2.0 | 853 | $1,490 | $1.75 | 13d | 39 | 0.50mi |
| North Pointe Villas Lincoln, NE | 3.0 | 1.0–2.0 | 1022 | $1,919 | $1.88 | 13d | 25 | 0.55mi |
| 2636 N 4th St Unit 2636 Lincoln, NE | 3.0 | 2.0 | 1060 | $1,595 | $1.50 | 43d | 1 | 0.65mi |
| 2635 N 5th St Unit 2635 Lincoln, NE | 3.0 | 2.0 | 1060 | $1,595 | $1.50 | 43d | 1 | 0.66mi |
| 830 Judson St Lincoln, NE | 3.0 | 1.0 | 816 | $1,700 | $2.08 | 43d | 1 | 0.69mi |
| 4231 N 7th St Lincoln, NE | 1.0 | 1.0 | 772 | $1,049 | $1.36 | 13d | 7 | 0.71mi |
| 535 W Saunders Ave Unit 3 Lincoln, NE | 2.0 | 1.0 | 889 | $945 | $1.06 | 43d | 1 | 0.78mi |
| 2521 N 9th St Lincoln, NE | 1.0–2.0 | 1.0–2.0 | 700 | $999 | $1.43 | 13d | 4 | 0.86mi |
| 4420 N 7th St Lincoln, NE | 1.0–2.0 | 1.0–2.0 | 881 | $1,092 | $1.24 | 13d | 17 | 0.86mi |
| 4730 Innovation Dr Lincoln, NE | 2.0 | 1.0–2.5 | 873 | $1,800 | $2.06 | 13d | 1 | 0.88mi |
| 3201 N 12th St Lincoln, NE | 3.0 | 1.0 | 928 | $1,250 | $1.35 | 13d | 1 | 0.97mi |
| 1205 Adams St Lincoln, NE | 2.0 | 1.0 | 875 | $1,350 | $1.54 | 43d | 1 | 1.01mi |
| 5265 NW 12th St Lincoln, NE | 2.0 | 1.0–2.0 | 932 | $1,895 | $2.03 | 13d | 15 | 1.36mi |
| 1501 Superior St Lincoln, NE | 1.0–2.0 | 1.0–2.0 | 818 | $1,211 | $1.48 | 13d | 11 | 1.39mi |
| 1800 Knox St Unit 1830 Lincoln, NE | 2.0 | 1.0 | 857 | $975 | $1.14 | 21d | 1 | 1.43mi |
| 1800 Knox St Unit 1800-26 Lincoln, NE | 2.0 | 1.0 | 857 | $1,075 | $1.25 | 43d | 1 | 1.43mi |
HOA detail
- Monthly dues
- $633 · $7,596/yr
Listing history 16 events
-
2026-06-18days on market $45,000 Active 25 DOM
-
2026-06-17days on market $45,000 Active 24 DOM
-
2026-06-16days on market $45,000 Active 23 DOM
-
2026-06-15days on market $45,000 Active 22 DOM
-
2026-06-14days on market $45,000 Active 20 DOM
-
2026-06-10days on market $45,000 Active 17 DOM
-
2026-06-09days on market $45,000 Active 16 DOM
-
2026-06-08days on market $45,000 Active 15 DOM
-
2026-06-07days on market $45,000 Active 14 DOM
-
2026-06-05days on market $45,000 Active 11 DOM
-
2026-06-03days on market $45,000 Active 10 DOM
-
2026-06-02days on market $45,000 Active 9 DOM
-
2026-06-01days on market $45,000 Active 8 DOM
-
2026-05-31days on market $45,000 Active 7 DOM
-
2026-05-30statusdays on market $45,000 Active 6 DOM
-
2026-05-24$45,000 New
ⓘ Source: listings_history table (triggers on properties + properties_extension) + one-shot
backfill from property_details.listing_events for pre-trigger history.
Climate risk First Street
- Flood 1/10 Low FEMA zone X (unshaded) · 0% chance over 30 yrs
- Wildfire 1/10 Low
- Heat 3/10 Moderate 7 d/yr ≥105°F today · 16 d/yr by 30 yrs out
- Wind 2/10 Low
- Air quality 1/10 Low 0 unhealthy d/yr today · 0 by 30 yrs out
Nearby sold comps map
Loading sold comps map…
Walkable amenities ~0.75 mi
Loading nearby amenities…
Taxation est. · year 1
- Rental income
- $16,320
- − Mortgage interest
- −$2,521
- − Property taxes
- −$675
- − Insurance
- −$225
- − Repairs & maintenance
- −$1,306
- − Management
- −$1,306
- − HOA
- −$7,596
- − Depreciation
- −$1,309
- Taxable income
- $1,383
- Est. tax owed @ 24.0%
- −$332
- After-tax cash flow
- $1,233/yr
For passive investors: Depreciation is non-cash, so a rental often shows a tax loss while cash-flowing — sheltering income. Rental losses are passive: they offset passive income freely, and up to $25,000/yr can offset ordinary (W-2) income if you actively participate and your MAGI is under $100k (phasing out to $0 by $150k); unused losses carry forward. On sale, claimed depreciation is recaptured at up to 25%, and gains may owe capital-gains tax (a 1031 exchange can defer both). Figures are a year-1 estimate at your 24.0% rate — not tax advice; consult a CPA.
Condition & rehab AI · 28 photos
This well-maintained mobile home offers a good investment opportunity with minor cosmetic updates needed to enhance its resale and rental value.
Repairs flagged
- Minor Kitchen cabinets — Aesthetic upgrade needed.
- Minor Bathroom fixtures — Update to modernize space.
- Minor Exterior siding — Some discoloration, touch-up needed.
- Minor Interior walls — Painting and touch-up needed for fresh look.
Value-add opportunities
- Both Painting and updating kitchen cabinets — Enhances curb appeal and interior aesthetics.
- Both Updating bathroom fixtures and tile — Improves functionality and appearance.
- Both Landscaping and curb appeal improvements — Enhances overall property value and appeal.
- Both Upgrading appliances — Modernizes the home and improves functionality.
Renovation cost estimate screening
| Repair item | Severity | Est. cost |
|---|---|---|
| Kitchen cabinets · Aesthetic upgrade needed. | Minor | $500–3,000 |
| Bathroom fixtures · Update to modernize space. | Minor | $500–3,000 |
| Exterior siding · Some discoloration, touch-up needed. | Minor | $500–3,000 |
| Interior walls · Painting and touch-up needed for fresh look. | Minor | $500–3,000 |
| Total estimated repair cost · 4 items | $2,000–12,000 |
Value-add ROI direction
- Both Painting and updating kitchen cabinets — Enhances curb appeal and interior aesthetics. ↑
- Both Updating bathroom fixtures and tile — Improves functionality and appearance. ↑
- Both Landscaping and curb appeal improvements — Enhances overall property value and appeal. ↑
- Both Upgrading appliances — Modernizes the home and improves functionality. ↑
ⓘ Cost ranges are severity-bucket heuristics (US national rule-of-thumb). Get contractor quotes + a written scope before underwriting a rehab budget.
Schools (NCES district)
- District
- Lincoln Public Schools
- NCES district ID
- 3172840
- Math proficiency
- 50% ▼ -6.00%
- Reading proficiency
- 53% ▼ -3.00%
- Median HH income
- $50,273
- Composite
- 44.05/100
- National rank
- #2880
- State rank
- #59 of 111 in NE
Livability — Lincoln
- Score
- 85/100
- State rank
- #5
- US rank
- #545
Category grades
Schools grade is shown separately in the Schools card above.
Census & demographics
- Census place
- Lincoln, NE
- County
- Lancaster County · 291,509 people
- City population
- 291,509
- Metro
- Lincoln, NE
- Population (ZIP)
- 37,050
- Household income
- $67,483
- Rent vs Own
- Severe rent burden
- 1500.0
Population outlook (Lancaster County) Hauer SSP2
- Today (2025)
- 352,806 people
- By 2030
- 377,899 · +7.1%
- By 2040
- 428,582 · +21.5%
- By 2050
- 483,103 · +36.9%
- By 2075
- 632,390 · +79.2%
- By 2100
- 759,513 · +115.3%
Race, ethnicity, and origin ACS 2023
- Neighborhood character
- Predominantly White (70%)
- Race & ethnicity
- White 70% Hispanic / Latino 12% Asian 8% Two or more races 7% Black 5%
- Hispanic origin (detail)
- Mexican 7%
- Common ancestry
- Romanian 2% Arab 2% Italian 2%
- Foreign-born
- 15% · Vietnam, Canada, United Kingdom
- Languages at home
- 78% English-only · Spanish 9% Vietnamese 6% Arabic 3%
Political lean MEDSL · Lancaster
- 2024 margin
- Toss-up / Even · D 51.4% · R 47.1% · Other 1.5%
- 2008→2024 swing
- -0.7pp no change · 2008: 5.0pp · 2024: 4.3pp
- All cycles
- 2024: D+4.3 2020: D+7.8 2016: D+0.1 2012: R+1.0 2008: D+5.0
Not yet ingested
- Civics
- —
Market trends
- HPI YoY
- ▼ -124.30%
- Current HPI
- 239.8394
- Rent YoY
- ▲ 4.04%
- Metro
- Lincoln, NE
- State GDP YoY
- ▲ 0.68%
- F500 in state
- 2
Industry mix (Fortune 500 HQ in NE)
| Industry | F500 HQs | Revenue |
|---|---|---|
| Conglomerate | 1 | $371B |
|
||
Price history
1 event — show timeline
- 2026-05-24 Listed $45,000 GPRMLS
Cash-flow waterfall
monthlySold comps — $/sqft
last 12 mo · ≤1 miLoading sold comps…