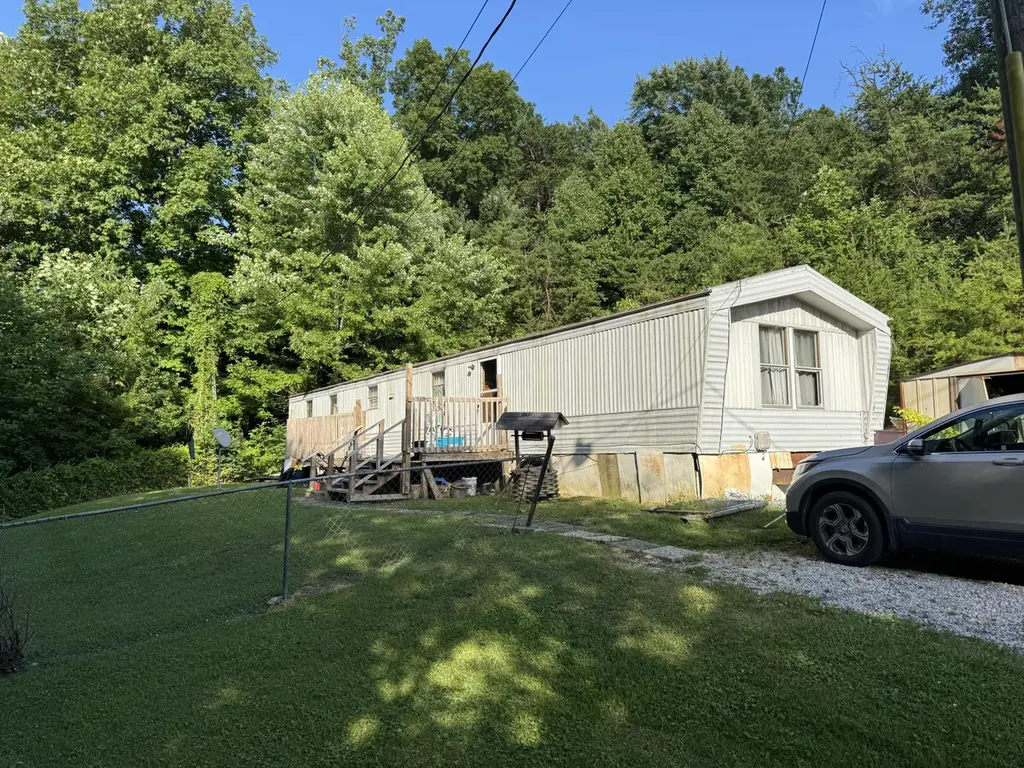
116 Boggs Rd · London, KY
Flood risk 1/10 · Minimal
- FEMA flood zone
- X (unshaded)
- Chance of flooding over 30 yrs
- 0.0%
- Est. flood insurance / yr
- $507 – $1,088
Fire risk 5/10 · Moderate
- Est. fire insurance / yr
- $839 – $1,559
Heat risk 4/10 · Minor
- Hot days now (above 100°F)
- 7 days/yr
- Hot days in 30 yrs
- 18 days/yr
Wind risk 2/10 · Minimal
- Chance of severe wind over 30 yrs
- 3.0%
Air-quality risk 1/10 · Minimal
- Unhealthy air days now
- 0 days/yr
- Unhealthy air days in 30 yrs
- 0 days/yr
Risk factors via First Street. Map © Google.
Why this score? — see what drove the B grade
The composite is a weighted blend of 9 inputs, each scored 0–100. Each bar is that input's sub-score; the figure is the points it added to the 100-point composite (weight × sub-score).
- Cash flow +30.0/30.0
- 1% rule +10.0/10.0
- DSCR +10.0/10.0
- ARV discount +7.5/15.0
- Schools +4.4/10.0
- Livability +3.4/5.0
- Rent growth +2.5/5.0
- Condition / age +2.5/5.0
- Appreciation +0.0/10.0
$60,000
🖨 Deal sheet 📄 Offer letter ✓ Due diligence
Listing remarks
Singlewide trailer 16 x 70 being SOLD AS-IS. All appliances included. Both sheds included.
Key facts
- 0.68 acre lot
- Built 1999
- Listed 7 days
Property features AI
Finance
- Other: Building area approximately 1,120; Lot about 0.68 acre (public records)
Exterior
- Parking: Off-street parking
- Utilities: Public water; Septic tank; Electricity connected; Phone connected; Sewer connected; Water connected
- Home design: Manufactured house; Single-story
- Construction: Aluminum siding; Other foundation type
- Exterior features: Shed(s); Secluded lot
Interior
- Kitchen: Includes refrigerator and range
- Bedrooms: 2 total rooms (includes bedrooms and living areas)
- Flooring: Carpet; Vinyl
- Bathrooms: 2 full bathrooms
- Heating & cooling: Electric forced-air heating
- Interior features: Refrigerator; Range
- Laundry & utility: No specific laundry appliances listed
Neighborhood map
What this means for you Summary
Snapshot
- This is a 2-bed/2.0-bath manufactured listed at $60k.
Deal economics
- At list price, monthly cash flow is $356 ($4k/yr) — positive.
- The deal already cash-flows at list — no discount required.
- Meets the 1% rule at list price ($976 rent vs $60k).
- Cap rate 13.4% vs local median 2.2% in London — top-decile yield for the area; either an underpriced asset or a hidden risk that comps aren't pricing in. Stress-test before assuming the spread holds.
Location & tenants
- Location reads 68/100 on livability (#202 in KY) — a middle-class / working-renter tenant base. Strengths: cost of living A+, housing A+, health & safety B+; Watch: employment D+, amenities F, commute F.
- Laurel County (town): math 51% / reading 56% proficiency, ranked #8 of 165 in KY (top 5%) — acceptable for families but not a draw, mixed tenant base, ~2y average lease.
- Zoned schools: Hunter Hills Elementary School (math 57% / reading 67%, grade B, #24 of 676 statewide, top 4%, 568 students, 81% FRL); South Laurel Middle School (math 36% / reading 50%, grade D-, #43 of 217 statewide, top 21%, 979 students, 70% FRL); South Laurel High School (math 37% / reading 42%, grade F, #40 of 254 statewide, top 19%, 1,108 students, 66% FRL).
- Market conditions: 173 active listings in the ZIP; 16 units permitted in Laurel County in 2024 (0 in 5+ unit buildings).
Forward outlook
- Local home prices are declining (-3.0%/yr); year-one equity from $415 of loan paydown is wiped out by about $2k of value loss. Plan a longer hold.
- At projected returns (-3.0% appreciation + 3.0% rent growth), your $17k cash investment doubles in ~5 years — after that, you're playing with house money.
Negotiation context
- Only 7 days on market — expect competitive offers; lowballing is unlikely to land.
Risks & watch-outs
- Climate carrying-cost: moderate wildfire risk — expect insurance premiums to compound above CPI over the hold.
Questions for the listing agent
- Is there a deadline driving the sale (1031 exchange, divorce, estate, relocation)? That informs how much negotiation room exists.
- Schools are D-rated, which usually means shorter tenancies and higher turnover. Who's the typical renter profile here, and what's been the actual vacancy rate?
- What's the average days-on-market for RENTAL listings here right now (not sales)? A rising rental-DOM trend means longer vacancies and softer asking-rent achievability than the comps imply.
- What's the recent tenant-quality profile in this submarket — average credit score on applications, eviction rate, late-payment / NSF rate, and stable-employment percentage? A property-management company in the area should have these aggregated.
- How much new for-sale + rental construction is in the pipeline within 1–3 miles? Heavy new supply typically softens prices + rents 12–24 months out; constrained supply supports both.
Investment metrics
- 1% rule
- 1.63% ✓
- Cap rate
- 13.42%
- Cash-on-cash
- 25.45%
- DSCR
- 2.13
- GRM
- 5.1
CMA / ARV
No comps found within radius.
Projected returns pro-forma
-3.0% appreciation · 3.0% rent growth · sell at horizon
- IRR
- 19.0%
- Equity multiple
- 1.77×
- Total profit
- $12,990
- Equity at exit
- $8,946
- IRR
- 27.4%
- Equity multiple
- 3.42×
- Total profit
- $40,597
- Equity at exit
- $5,188
Cash invested: $16,800 (down + closing). Projections, not guarantees.
Landlord ↔ Tenant lean methodology
- Overall (STATE)
- 83 Strongly Landlord-Friendly
- State Kentucky
- 83 Strongly Landlord-Friendly · R+16
- County
- — inherits STATE
- City
- — inherits STATE
ZIP-level market 40744
- Home prices YoY
- -13.0%
- Active inventory
- 173
- Price-to-rent
- 5.1×
Monthly cashflow live
- Estimated rent
- $976 medium interval (Pro) →
- Mortgage (P&I)
- −$315
- Tax est. 1.5%
- −$75 /mo · $900/yr
- Insurance
- −$25
- HOA
- −$0
- Vacancy / Maint / Mgmt
- −$205
- Net cashflow
- $356
Break-even live
UW: 25.0% down · 7.5% · 30yr · 1.5% tax · 5.0% vac · 8.0% maint · 8.0% mgmt
Financing live
Cash to close
- Down payment
- $15,000
- Closing costs
- $1,800
- Reserves months
- —
- Total cash needed
- —
Loan-product check · same deal, 3 products live
Conventional
25% down · 7.5% · 30yr
- Down + closing
- —
- Monthly P&I
- —
- Monthly cashflow
- —
- DSCR
- —
- Eligible?
- —
Personal DTI + credit; lowest rate.
DSCR
20% down · 8.5% · 30yr
- Down + closing
- —
- Monthly P&I
- —
- Monthly cashflow
- —
- DSCR
- —
- Eligible?
- —
No personal income docs; deal must DSCR.
Hard money
10% down · 12.0% · 12mo
- Down + closing
- —
- Monthly P&I
- —
- Monthly cashflow
- —
- DSCR
- —
- Eligible?
- —
Short-term bridge; refi at stabilization.
Listing history 7 events
-
2026-06-18days on market $60,000 Active 7 DOM
-
2026-06-17days on market $60,000 Active 6 DOM
-
2026-06-16days on market $60,000 Active 5 DOM
-
2026-06-15days on market $60,000 Active 4 DOM
-
2026-06-13days on market $60,000 Active 2 DOM
-
2026-06-12remarks 90-char remark
-
2026-06-12$60,000 Active 1 DOM
ⓘ Source: listings_history table (triggers on properties + properties_extension) + one-shot
backfill from property_details.listing_events for pre-trigger history.
Climate risk First Street
- Flood 1/10 Low FEMA zone X (unshaded) · 0% chance over 30 yrs
- Wildfire 5/10 Major
- Heat 4/10 Moderate 7 d/yr ≥100°F today · 18 d/yr by 30 yrs out
- Wind 2/10 Low 3% chance of damaging wind over 30 yrs
- Air quality 1/10 Low 0 unhealthy d/yr today · 0 by 30 yrs out
Nearby sold comps map
Loading sold comps map…
Walkable amenities ~0.75 mi
Loading nearby amenities…
Taxation est. · year 1
- Rental income
- $11,712
- − Mortgage interest
- −$3,361
- − Property taxes
- −$900
- − Insurance
- −$300
- − Repairs & maintenance
- −$937
- − Management
- −$937
- − Depreciation
- −$1,745
- Taxable income
- $3,531
- Est. tax owed @ 24.0%
- −$848
- After-tax cash flow
- $3,429/yr
For passive investors: Depreciation is non-cash, so a rental often shows a tax loss while cash-flowing — sheltering income. Rental losses are passive: they offset passive income freely, and up to $25,000/yr can offset ordinary (W-2) income if you actively participate and your MAGI is under $100k (phasing out to $0 by $150k); unused losses carry forward. On sale, claimed depreciation is recaptured at up to 25%, and gains may owe capital-gains tax (a 1031 exchange can defer both). Figures are a year-1 estimate at your 24.0% rate — not tax advice; consult a CPA.
Schools (NCES district)
- District
- Laurel County
- NCES district ID
- 2103210
- Math proficiency
- 51% ▼ -9.00%
- Reading proficiency
- 56% ▼ -11.00%
- Median HH income
- $36,577
- Composite
- 44.39/100
- National rank
- #2814
- State rank
- #8 of 165 in KY
Livability — London
- Score
- 68/100
- State rank
- #202
- US rank
- #10028
Category grades
Schools grade is shown separately in the Schools card above.
Census & demographics
- Population (ZIP)
- 20,104
Population outlook (Laurel County) Hauer SSP2
- Today (2025)
- 62,602 people
- By 2030
- 63,310 · +1.1%
- By 2040
- 63,706 · +1.8%
- By 2050
- 62,705 · +0.2%
- By 2075
- 58,574 · -6.4%
- By 2100
- 50,888 · -18.7%
Race, ethnicity, and origin ACS 2023
- Neighborhood character
- Predominantly White (94%)
- Race & ethnicity
- White 94% Two or more races 4% Hispanic / Latino 1%
- Common ancestry
- Italian 2% Serbian 1% Romanian 1%
- Foreign-born
- 2% · China, Canada
- Languages at home
- 98% English-only · Chinese 1% Spanish 0%
Political lean MEDSL · Laurel
- 2024 margin
- Solid R (+69.9) · D 14.5% · R 84.3% · Other 1.2%
- 2008→2024 swing
- -11.9pp toward R · 2008: -58.0pp · 2024: -69.9pp
- All cycles
- 2024: R+69.9 2020: R+66.7 2016: R+69.1 2012: R+63.6 2008: R+58.0
Not yet ingested
- Civics
- —
Market trends
- HPI YoY
- ▼ -40.52%
- Current HPI
- 270.3876
- Rent YoY
- —
- Metro
- —
- State GDP YoY
- ▲ 1.81%
- F500 in state
- 4
Industry mix (Fortune 500 HQ in KY)
| Industry | F500 HQs | Revenue |
|---|---|---|
| Healthcare | 1 | $118B |
|
||
| Food / Beverage | 1 | $7B |
|
||
Price history
1 event — show timeline
- 2026-06-11 Listed $60,000 ImagineMLS
Cash-flow waterfall
monthlySold comps — $/sqft
last 12 mo · ≤1 miLoading sold comps…