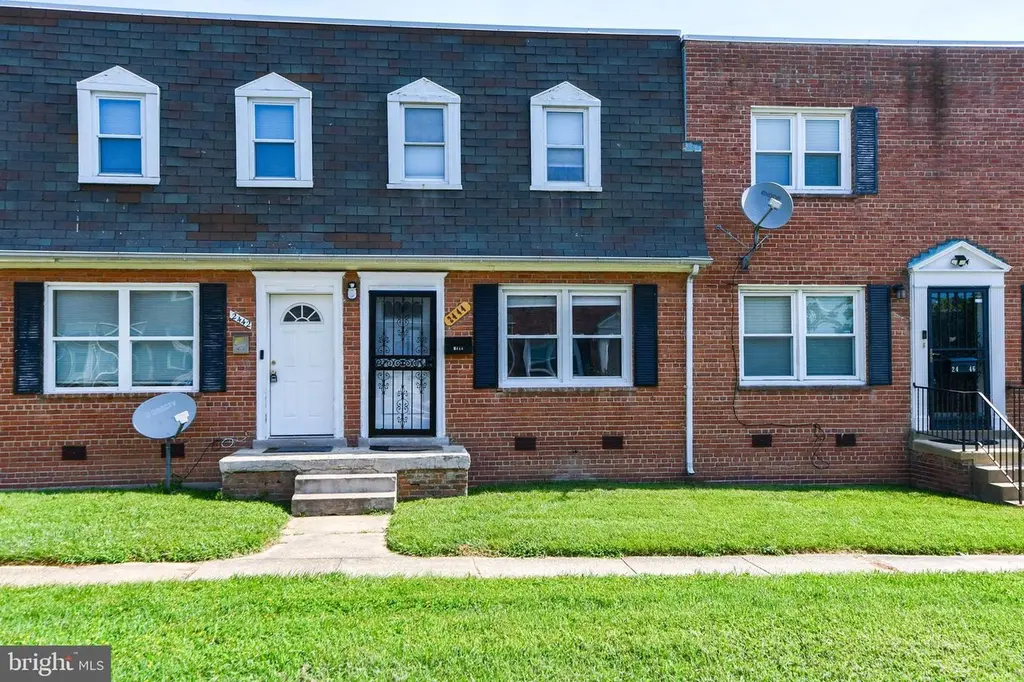
2444 Iverson St · Hillcrest Heights, MD
Flood risk 1/10 · Minimal
- FEMA flood zone
- X (unshaded)
- Chance of flooding over 30 yrs
- 0.0%
- Est. flood insurance / yr
- $507 – $1,088
Fire risk 1/10 · Minimal
- Est. fire insurance / yr
- $755 – $1,403
Heat risk 7/10 · Major
- Hot days now (above 103°F)
- 7 days/yr
- Hot days in 30 yrs
- 16 days/yr
Wind risk 4/10 · Minor
- Chance of severe wind over 30 yrs
- 19.0%
Air-quality risk 3/10 · Minor
- Unhealthy air days now
- 2 days/yr
- Unhealthy air days in 30 yrs
- 3 days/yr
Risk factors via First Street. Map © Google.
Why this score? — see what drove the C grade
The composite is a weighted blend of 9 inputs, each scored 0–100. Each bar is that input's sub-score; the figure is the points it added to the 100-point composite (weight × sub-score).
- Cash flow +20.9/30.0
- ARV discount +10.5/15.0
- 1% rule +7.4/10.0
- DSCR +6.7/10.0
- Livability +3.9/5.0
- Condition / age +2.5/5.0
- Rent growth +1.8/5.0
- Schools +1.7/10.0
- Appreciation +0.0/10.0
$135,000
🖨 Deal sheet 📄 Offer letter ✓ Due diligence
Listing remarks MLS
Recently updated two level condo for sale! Unit offers two sizable bedrooms, one full bath, dining area, spacious living room which is ideal for entertaining or just simple every day living. Conveniently located near shopping, and public transportation.
Key facts
- $252 HOA
- Built 1950
- Listed 76 days
Neighborhood map
What this means for you Summary
Snapshot
- This is a 2-bed/1.0-bath townhouse listed at $135k.
Deal economics
- At list price, monthly cash flow is $188 ($2k/yr) — positive.
- The deal already cash-flows at list — no discount required.
- Meets the 1% rule at list price ($2k rent vs $135k).
- Recommended offer: $127k (6.0% below list) — sets the bar for market timing.
- Cap rate 8.0% vs local median 4.4% in Hillcrest Heights — top-decile yield for the area; either an underpriced asset or a hidden risk that comps aren't pricing in. Stress-test before assuming the spread holds.
Location & tenants
- Location reads 77/100 on livability (#79 in MD, #2,942 nationally) — a middle-class / working-renter tenant base. Strengths: commute A+, housing A+, employment B+; Watch: health & safety C-, crime F, amenities F.
- Prince George'S County Public Schools (suburban): math 8% / reading 24% proficiency, ranked #21 of 24 in MD (top 88%) — low school quality limits family demand, transient renter base, plan for 1-2y turnover.
- Market conditions: Rents soft (-2.9%/yr); 139 active listings in the ZIP; 40 comparable units currently listed for rent nearby; rentals leasing fast (median 12d on market — plan ~1-2 weeks tenant-placement turnaround); solid renter incomes; 1,481 units permitted in Prince George's County in 2024 (0 in 5+ unit buildings).
Forward outlook
- Local home prices are declining (-3.0%/yr); year-one equity from $933 of loan paydown is wiped out by about $4k of value loss. Plan a longer hold.
- Prince George's County population projected at +18% by 2050 — long-run rental-demand tailwind backs the buy-and-hold thesis.
Negotiation context
- It's been on market 77 days — a 6% lower offer ($127k) is reasonable based on typical stale-listing flexibility.
- 6 sale attempts since 11y ago with the ask held roughly flat each time — persistent listings suggest the price (not the market) is what's stuck; bring a comps-based counter.
- Current owner paid $91k; 48% above their basis — modest negotiation headroom, anchor on the comps not their cost.
Risks & watch-outs
- Watch-outs: built in 1950 — expect roof / HVAC / electrical / plumbing capex.
- Climate carrying-cost: extreme-heat days projected 7→16/yr by 2055 (HVAC capex compounding) — expect insurance premiums to compound above CPI over the hold.
Questions for the listing agent
- It's been on market 77 days. Have you received any prior offers? Is the seller open to a 6% concession, seller financing, or rate buy-down credit?
- Built in 1950 — when were the roof, HVAC, electrical panel, plumbing, and water heater last replaced?
- What does the HOA fee cover, when was the last increase, and are there any pending special assessments or reserve-fund shortfalls?
- Why hasn't it sold? Are there any deal-killer items the seller is aware of (foundation, flood, title, zoning, code violations)?
- Is there a deadline driving the sale (1031 exchange, divorce, estate, relocation)? That informs how much negotiation room exists.
- Schools are B-rated — typically a magnet for longer-tenancy family renters. What's the average tenant stay here, and is there a school-zone premium baked into asking?
- Crime grade is F in this area — have there been break-ins, vandalism, or insurance claims at this property in the last 3 years? What carrier currently insures it and at what premium?
- What's the average days-on-market for RENTAL listings here right now (not sales)? A rising rental-DOM trend means longer vacancies and softer asking-rent achievability than the comps imply.
- What's the recent tenant-quality profile in this submarket — average credit score on applications, eviction rate, late-payment / NSF rate, and stable-employment percentage? A property-management company in the area should have these aggregated.
- How much new for-sale + rental construction is in the pipeline within 1–3 miles? Heavy new supply typically softens prices + rents 12–24 months out; constrained supply supports both.
Investment metrics
- 1% rule
- 1.24% ✓
- Cap rate
- 7.96%
- Cash-on-cash
- 5.96%
- DSCR
- 1.27
- GRM
- 6.7
CMA / ARV
- ARV (median comp)
- $144,654
- List price
- $135,000
- Delta
- -6.67%
- Verdict
- FAIR
- Comps
- 20 within 1.0 mi
Show comp detail 12 sales within ~0.75 mi
| Address | Dist | Beds/Ba | Sqft | Sold | Price | $/sf | Match |
|---|---|---|---|---|---|---|---|
| 3902 25th Ave | 0.06mi | 2/1.0 | 768 (0%) | 1mo | $130,000 | $169 | 96 |
| 2540 Iverson St | 0.09mi | 2/1.0 | 768 (0%) | 0mo | $85,000 | $111 | 96 |
| 2551 Colebrooke Dr | 0.11mi | 2/1.0 | 768 (0%) | 2mo | $140,000 | $182 | 93 |
| 3879 26th Ave | 0.15mi | 2/1.0 | 768 (0%) | 1mo | $128,000 | $167 | 92 |
| 4003 25th Ave | 0.05mi | 2/1.0 | 792 (+3%) | 1mo | $93,000 | $117 | 92 |
| 3802 26th Ave #16 | 0.17mi | 2/1.0 | 762 (-1%) | 3mo | $95,000 | $125 | 88 |
| 2588 Iverson St | 0.14mi | 2/1.0 | 768 (0%) | 7mo | $145,000 | $189 | 87 |
| 3811 28th Ave #15 | 0.29mi | 2/1.0 | 768 (0%) | 1mo | $155,000 | $202 | 85 |
| 3855 28th Ave #37 | 0.30mi | 2/1.0 | 768 (0%) | 3mo | $128,000 | $167 | 84 |
| 3815 28th Ave #17 | 0.29mi | 2/1.0 | 768 (0%) | 8mo | $141,000 | $184 | 80 |
| 3840 26th Ave | 0.19mi | 2/1.0 | 710 (-8%) | 6mo | $97,500 | $137 | 74 |
| 2627 Colebrooke Dr #31 | 0.21mi | 2/1.0 | 716 (-7%) | 7mo | $86,000 | $120 | 73 |
Match score weights: distance 35% · size 25% · config 20% · recency 20%. Top-matched comps best support the ARV.
Projected returns pro-forma
-3.0% appreciation · 0.0% rent growth · sell at horizon
- IRR
- -11.1%
- Equity multiple
- 0.61×
- Total profit
- $-14,656
- Equity at exit
- $20,129
- IRR
- -7.8%
- Equity multiple
- 0.59×
- Total profit
- $-15,665
- Equity at exit
- $11,672
Cash invested: $37,800 (down + closing). Projections, not guarantees.
Landlord ↔ Tenant lean methodology
- Overall (STATE)
- 27 Tenant-Leaning
- State Maryland
- 27 Tenant-Leaning · D+14
- County
- — inherits STATE
- City
- — inherits STATE
ZIP-level market 20748
- Rents YoY
- -2.9%
- Active inventory
- 139
- Price-to-rent
- 6.7×
Monthly cashflow live
- Estimated rent
- $1,669 high interval (Pro) →
- Mortgage (P&I)
- −$708
- Tax from tax record
- −$115 /mo · $1,376/yr
- Insurance
- −$56
- HOA
- −$252
- Vacancy / Maint / Mgmt
- −$351
- Net cashflow
- $188
Break-even live
UW: 25.0% down · 7.5% · 30yr · 1.5% tax · 5.0% vac · 8.0% maint · 8.0% mgmt
Financing live
Cash to close
- Down payment
- $33,750
- Closing costs
- $4,050
- Reserves months
- —
- Total cash needed
- —
Loan-product check · same deal, 3 products live
Conventional
25% down · 7.5% · 30yr
- Down + closing
- —
- Monthly P&I
- —
- Monthly cashflow
- —
- DSCR
- —
- Eligible?
- —
Personal DTI + credit; lowest rate.
DSCR
20% down · 8.5% · 30yr
- Down + closing
- —
- Monthly P&I
- —
- Monthly cashflow
- —
- DSCR
- —
- Eligible?
- —
No personal income docs; deal must DSCR.
Hard money
10% down · 12.0% · 12mo
- Down + closing
- —
- Monthly P&I
- —
- Monthly cashflow
- —
- DSCR
- —
- Eligible?
- —
Short-term bridge; refi at stabilization.
Rent comps 40 comps
| Address | Beds | Baths | Sqft | Rent | $/sqft | DOM | Units | Dist |
|---|---|---|---|---|---|---|---|---|
| 3909 25th Ave Hillcrest Heights, MD | 2.0 | 1.0 | 768 | $1,500 | $1.95 | 4d | 1 | 0.04mi |
| 3903 25th Ave Hillcrest Heights, MD | 2.0 | 1.0 | 768 | $1,500 | $1.95 | 4d | 1 | 0.05mi |
| 4003 25th Ave Temple Hills, MD | 2.0 | 1.0 | 792 | $1,795 | $2.27 | 12d | 1 | 0.05mi |
| 2528 Iverson St Temple Hills, MD | 2.0 | 1.0 | 768 | $1,675 | $2.18 | 11d | 1 | 0.06mi |
| 3861 26th Ave Temple Hills, MD | 2.0 | 1.0 | 768 | $1,700 | $2.21 | 5d | 1 | 0.14mi |
| 3861 26th Ave Temple Hills, MD | 2.0 | 1.0 | 768 | $1,700 | $2.21 | 24d | 1 | 0.14mi |
| 3846 26th Ave Temple Hills, MD | 2.0 | 1.5 | 710 | $1,875 | $2.64 | 43d | 1 | 0.18mi |
| 3840 26th Ave Temple Hills, MD | 2.0 | 1.0 | 710 | $1,700 | $2.39 | 17d | 1 | 0.18mi |
| 4129 Atmore Pl Temple Hills, MD | 1.0 | 1.0 | 610 | $1,500 | $2.46 | 43d | 1 | 0.24mi |
| 3827 28th Ave #23 Temple Hills, MD | 2.0 | 1.0 | 768 | $1,695 | $2.21 | 3d | 1 | 0.26mi |
| 2816 Keating St #164 Temple Hills, MD | 2.0 | 1.0 | 768 | $1,500 | $1.95 | 24d | 1 | 0.34mi |
| 4301 23rd Pkwy Temple Hills, MD | 3.0 | 1.0–2.0 | 850 | $1,785 | $2.10 | 1d | 18 | 0.41mi |
| 2900 Saint Clair Dr Temple Hills, MD | 1.0–2.0 | 1.0 | 765 | $1,425 | $1.86 | 18d | 1 | 0.45mi |
| 4513 23rd Pkwy Temple Hills, MD | 1.0–2.0 | 1.0 | 824 | $1,880 | $2.28 | 3d | 8 | 0.52mi |
| 4431 23rd Pkwy Temple Hills, MD | 1.0–2.0 | 1.0 | 775 | $1,600 | $2.06 | 4d | 12 | 0.53mi |
| 2309 Olson St #203 Temple Hills, MD | 1.0 | 1.0 | 948 | $1,695 | $1.79 | 5d | 1 | 0.57mi |
| 4221 28th Ave Marlow Heights, MD | 1.0–2.0 | 1.0 | 698 | $1,300 | $1.86 | 43d | 1 | 0.59mi |
| 4503 Raleigh Rd Temple Hills, MD | 3.0 | 1.0 | 1040 | $1,895 | $1.82 | 43d | 1 | 0.62mi |
| 3843 St Barnabas Rd Apt 104 Suitland, MD | 2.0 | 2.0 | 998 | $1,750 | $1.75 | 5d | 1 | 0.68mi |
| 4637 Dallas Pl Temple Hills, MD | 1.0–2.0 | 1.0 | 838 | $1,506 | $1.80 | 1d | 27 | 0.72mi |
| 3827 Saint Barnabas Rd Unit T103 Suitland, MD | 2.0 | 1.0 | 979 | $1,800 | $1.84 | 15d | 1 | 0.72mi |
| 3807 St Barnabas Rd #104 Suitland, MD | 2.0 | 1.0 | 1000 | $1,999 | $2.00 | 43d | 1 | 0.78mi |
| 3825 Saint Barnabas Rd Unit T-202 Suitland, MD | 2.0 | 1.0 | 1034 | $1,800 | $1.74 | 43d | 1 | 0.79mi |
| 3851 St Barnabas Rd Apt 201 Suitland, MD | 2.0 | 1.0 | 1000 | $2,295 | $2.29 | 5d | 1 | 0.79mi |
| 3827 St Barnabas Rd Unit T Suitland, MD | 2.0 | 1.0 | 992 | $1,600 | $1.61 | 3d | 1 | 0.79mi |
| 3103 Good Hope Ave Hillcrest Heights, MD | 3.0 | 1.0–2.0 | 851 | $2,303 | $2.71 | 2d | 12 | 0.85mi |
| 3416 Curtis Dr Suitland, MD | 1.0–3.0 | 1.0–1.5 | 779 | $1,628 | $2.09 | 2d | 25 | 0.85mi |
| 3613 Silver Park Dr Suitland, MD | 1.0–3.0 | 1.0–2.0 | 1087 | $1,895 | $1.74 | 3d | 10 | 0.96mi |
| 2603 Southern Ave SE Hillcrest Heights, MD | 1.0–2.0 | 1.0 | 646 | $1,375 | $2.13 | 1d | 7 | 1.01mi |
| 3501 Terrace Dr Hillcrest Heights, MD | 1.0–2.0 | 1.0 | 800 | $1,678 | $2.10 | 1d | 15 | 1.08mi |
| 3506 Silver Park Dr Suitland, MD | 1.0–3.0 | 1.0–2.0 | 998 | $1,954 | $1.96 | 1d | 10 | 1.09mi |
| 3009 Southern Ave SE Temple Hills, MD | 3.0 | 1.0 | 909 | $1,650 | $1.82 | 43d | 1 | 1.11mi |
| 3158 Buena Vista Ter SE Unit 1 Washington, DC | 3.0 | 1.0 | 800 | $2,900 | $3.62 | 24d | 1 | 1.13mi |
| 3130 Buena Vista Ter SE Unit 6 Washington, DC | 3.0 | 1.0 | 855 | $1,980 | $2.32 | 17d | 1 | 1.19mi |
| 3111 Naylor Rd SE #301 Washington, DC | 1.0 | 1.0 | 800 | $1,350 | $1.69 | 24d | 1 | 1.19mi |
| 3216 28th St SE #2 Washington, DC | 3.0 | 1.0 | 600 | $2,204 | $3.67 | 24d | 1 | 1.20mi |
| 3001 Branch Ave Temple Hills, MD | 2.0 | 1.0 | 769 | $2,043 | $2.66 | 1d | 43 | 1.20mi |
| 3109 Naylor Rd SE Washington, DC | 2.0 | 1.0 | 655 | $1,904 | $2.91 | 7d | 1 | 1.21mi |
| 3035 30th St SE Unit 2M Washington, DC | 1.0 | 1.0 | 900 | $1,450 | $1.61 | 24d | 1 | 1.21mi |
| 3212 28th St SE Unit D Washington, DC | 3.0 | 1.0 | 790 | $2,100 | $2.66 | 24d | 1 | 1.21mi |
HOA detail
- Monthly dues
- $252 · $3,024/yr
Listing history 31 events
-
2026-06-18days on market $135,000 Active 77 DOM
-
2026-06-17days on market $135,000 Active 76 DOM
-
2026-06-16days on market $135,000 Active 75 DOM
-
2026-06-15days on market $135,000 Active 74 DOM
-
2026-06-13days on market $135,000 Active 72 DOM
-
2026-06-10days on market $135,000 Active 68 DOM
-
2026-06-08days on market $135,000 Active 67 DOM
-
2026-06-07days on market $135,000 Active 66 DOM
-
2026-06-04days on market $135,000 Active 63 DOM
-
2026-06-03days on market $135,000 Active 62 DOM
-
2026-06-02days on market $135,000 Active 61 DOM
-
2026-06-01days on market $135,000 Active 60 DOM
-
2026-05-31days on market $135,000 Active 59 DOM
-
2026-04-03$135,000 Active 253-char remark
Show marketing remark (253 chars)
Recently updated two level condo for sale! Unit offers two sizable bedrooms, one full bath, dining area, spacious living room which is ideal for entertaining or just simple every day living. Conveniently located near shopping, and public transportation.
-
2026-03-30historical $135,000 253-char remark
Show marketing remark (253 chars)
Recently updated two level condo for sale! Unit offers two sizable bedrooms, one full bath, dining area, spacious living room which is ideal for entertaining or just simple every day living. Conveniently located near shopping, and public transportation.
-
2025-03-04historical
-
2025-02-14historical $1,575
-
2025-01-23price $1,575
-
2024-12-24$1,625
-
2024-10-31price $157,000
-
2024-09-13$167,000 Active
-
2020-09-18soldstatus $91,000 Closed
-
2020-08-27status Pending
-
2020-08-19$105,000 Active
-
2015-12-29soldstatus $51,000
-
2015-10-22historical
-
2015-10-01soldstatus $51,000
-
2015-10-01soldstatus $51,000 Sold
-
2015-06-06status Contract
-
2015-05-26$45,000 Active
-
2015-05-26$45,000
ⓘ Source: listings_history table (triggers on properties + properties_extension) + one-shot
backfill from property_details.listing_events for pre-trigger history.
Tax reassessment forecast MD · Partial reset (capped growth)
- Current annual tax
- $1,376 · $115/mo
- Projected year-2 tax
- $1,424 · $119/mo
- Expected delta
- +$48/yr (+$4/mo · 3.5%)
ⓘ Screening estimate from a state-policy table — verify with the county assessor before closing.
Climate risk First Street
- Flood 1/10 Low FEMA zone X (unshaded) · 0% chance over 30 yrs
- Wildfire 1/10 Low
- Heat 7/10 Severe 7 d/yr ≥103°F today · 16 d/yr by 30 yrs out
- Wind 4/10 Moderate 19% chance of damaging wind over 30 yrs
- Air quality 3/10 Moderate 2 unhealthy d/yr today · 3 by 30 yrs out
Nearby sold comps map
Loading sold comps map…
Walkable amenities ~0.75 mi
Loading nearby amenities…
Taxation est. · year 1
- Rental income
- $20,031
- − Mortgage interest
- −$7,562
- − Property taxes
- −$1,376
- − Insurance
- −$675
- − Repairs & maintenance
- −$1,602
- − Management
- −$1,602
- − HOA
- −$3,024
- − Depreciation
- −$3,927
- Taxable income
- $262
- Est. tax owed @ 24.0%
- −$63
- After-tax cash flow
- $2,191/yr
For passive investors: Depreciation is non-cash, so a rental often shows a tax loss while cash-flowing — sheltering income. Rental losses are passive: they offset passive income freely, and up to $25,000/yr can offset ordinary (W-2) income if you actively participate and your MAGI is under $100k (phasing out to $0 by $150k); unused losses carry forward. On sale, claimed depreciation is recaptured at up to 25%, and gains may owe capital-gains tax (a 1031 exchange can defer both). Figures are a year-1 estimate at your 24.0% rate — not tax advice; consult a CPA.
Schools (NCES district)
- District
- Prince George'S County Public Schools
- NCES district ID
- 2400510
- Math proficiency
- 8% ▼ -11.00%
- Reading proficiency
- 24% ▼ -9.00%
- Median HH income
- $73,967
- Composite
- 16.82/100
- National rank
- #9151
- State rank
- #21 of 24 in MD
Livability — Hillcrest Heights
- Score
- 77/100
- State rank
- #79
- US rank
- #2942
Category grades
Schools grade is shown separately in the Schools card above.
Census & demographics
- Census place
- Hillcrest Heights, MD
- County
- Prince Georges County · 919,866 people
- Metro
- Washington-Arlington-Alexandria, DC-VA-MD-WV
- Population (ZIP)
- 40,338
- Household income
- $83,162
- Rent vs Own
- Severe rent burden
- 1929.0
Population outlook (Prince George's County) Hauer SSP2
- Today (2025)
- 1,005,426 people
- By 2030
- 1,048,416 · +4.3%
- By 2040
- 1,123,425 · +11.7%
- By 2050
- 1,183,220 · +17.7%
- By 2075
- 1,306,202 · +29.9%
- By 2100
- 1,408,179 · +40.1%
Race, ethnicity, and origin ACS 2023
- Neighborhood character
- Predominantly Black (81%)
- Race & ethnicity
- Black 81% Hispanic / Latino 11% White 5% Two or more races 4% Asian 1%
- Hispanic origin (detail)
- Mexican 3%
- Foreign-born
- 10% · Canada
- Languages at home
- 87% English-only · Spanish 10% French/Haitian/Cajun 1% Tagalog/Filipino 1%
Political lean MEDSL · Prince George's
- 2024 margin
- Solid D (+75.2) · D 86.3% · R 11.2% · Other 2.5%
- 2008→2024 swing
- -3.3pp toward R · 2008: 78.5pp · 2024: 75.2pp
- All cycles
- 2024: D+75.2 2020: D+80.5 2016: D+81.0 2012: D+80.9 2008: D+78.5
Not yet ingested
- Civics
- —
Market trends
- HPI YoY
- ▼ -215.06%
- Current HPI
- 307.2658
- Rent YoY
- ▼ -2.87%
- Metro
- Washington-Arlington-Alexandria, DC-VA-MD-WV
- State GDP YoY
- ▲ 2.97%
- F500 in state
- 12
Industry mix (Fortune 500 HQ in MD)
| Industry | F500 HQs | Revenue |
|---|---|---|
| Aerospace / Defense | 1 | $71B |
|
||
| Utilities | 1 | $25B |
|
||
| Hotels | 1 | $24B |
|
||
| Consumer Goods | 1 | $7B |
|
||
| Real Estate | 1 | $6B |
|
||
| Chemicals | 1 | $2B |
|
||
Price history
+200.0% since first listed18 events — show timeline
- 2026-04-03 Listed $135,000 BRIGHT MLS
- 2026-03-30 Coming Soon $135,000 BRIGHT MLS
- 2025-03-04 Listing Removed — BRIGHT MLS
- 2025-02-14 Rental Removed $1,575 BRIGHTMLS
- 2025-01-23 Price Changed $1,575 BRIGHTMLS
- 2024-12-24 Listed for Rent $1,625 BRIGHTMLS
- 2024-10-31 Price Changed $157,000 BRIGHT MLS
- 2024-09-13 Listed $167,000 BRIGHT MLS
- 2020-09-18 Sold (MLS) $91,000 BRIGHT MLS
- 2020-08-27 Pending — BRIGHT MLS
- 2020-08-19 Listed $105,000 BRIGHT MLS
- 2015-12-29 Sold (Public Records) $51,000 Public Records
- 2015-10-22 Listing Removed — BRIGHT MLS
- 2015-10-01 Sold (MLS) $51,000 MRIS
- 2015-10-01 Sold (MLS) $51,000 BRIGHT MLS
- 2015-06-06 Pending — MRIS
- 2015-05-26 Listed $45,000 MRIS
- 2015-05-26 Listed $45,000 BRIGHT MLS
Property tax history
+4.4%/yrLatest (2022): $1,376 · +10.8% YoY. Source: county tax records.
Cash-flow waterfall
monthlySold comps — $/sqft
last 12 mo · ≤1 miLoading sold comps…