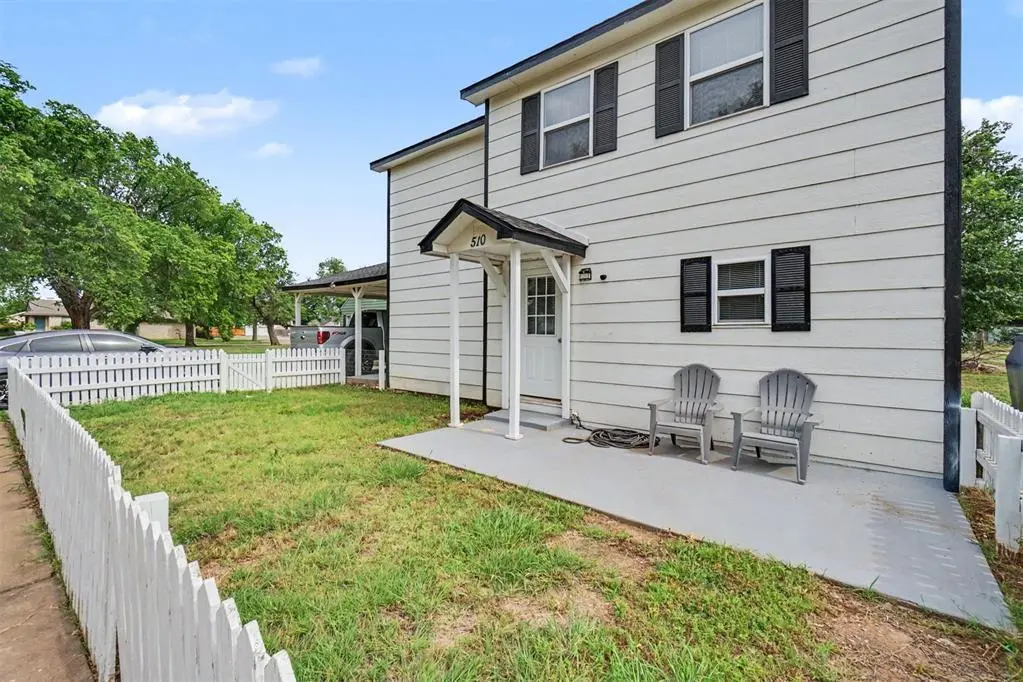
510 W 3rd St · Hobart, OK
Flood risk No data
- FEMA flood zone
- —
- Chance of flooding over 30 yrs
- —
- Est. flood insurance / yr
- —
Fire risk No data
- Est. fire insurance / yr
- —
Heat risk No data
- Hot days now (above threshold)
- —
- Hot days in 30 yrs
- —
Wind risk No data
- Chance of severe wind over 30 yrs
- —
Air-quality risk No data
- Unhealthy air days now
- —
- Unhealthy air days in 30 yrs
- —
Risk factors via First Street. Map © Google.
Why this score? — see what drove the D+ grade
The composite is a weighted blend of 9 inputs, each scored 0–100. Each bar is that input's sub-score; the figure is the points it added to the 100-point composite (weight × sub-score).
- Cash flow +14.2/30.0
- Appreciation +10.0/10.0
- ARV discount +7.5/15.0
- DSCR +4.3/10.0
- 1% rule +3.3/10.0
- Livability +2.7/5.0
- Rent growth +2.5/5.0
- Condition / age +2.5/5.0
- Schools +2.1/10.0
$150,000
🖨 Deal sheet 📄 Offer letter ✓ Due diligence
Listing remarks MLS
Wow! This Home Has Been Completely Remodeled!! The Home Has Four Bedrooms And Two Bathrooms Located at 510 W 3rd, Hobart, OK 73651. New Doors, New Carpet And Wood Look Vinyl Flooring, New HVAC 2022 Plus Recently Serviced, LG Kitchen Appliance Package, Newer Windows, New Hot Water Heater, Under The Cabinet Lights In The Kitchen, New Bathroom Counter, New Toilets, New Medicine Cabinet And Shelving, New Counter Top And Some Cabinets. Appliances Include Stainless Steel LG Refrigerator, Electric Range/Stove, Microwave And Dishwasher. Storage Shed Under The Carport. One Car Carport. Extra Lot Comes Along With The Home For Extra Room, Build Your Dream Shop! Schedule Your Private Showing Today!
Key facts
- Remodeled kitchen
- Updated countertops
- Refreshed cabinetry
Tags
Property features AI
Finance
- Other: Homestead exemption claimed
- Financial info: Loan qualification possible; Not assumable
- HOA & community: No mandatory association dues
Exterior
- Home design: Single family residence; Existing property; Two levels
- Construction: Built with other construction materials; Composition roof; Combination foundation
- Exterior features: Outbuildings; Storage; Corner lot
Interior
- Bedrooms: 4 bedrooms
- Bathrooms: 2 full bathrooms
- Heating & cooling: Electric heating
- Interior features: One living area; No fireplace
Neighborhood map
What this means for you Summary
Snapshot
- This is a 3-bed/2.0-bath single-family listed at $150k.
Deal economics
- At list price, monthly cash flow is $23 ($280/yr) — positive.
- The deal already cash-flows at list — no discount required.
- To meet the 1% rule (rent ≥ 1% of price), the offer needs to be $125k (17.0% below list).
- Recommended offer: $125k (17.0% below list) — sets the bar for 1% rule.
- Cap rate 6.5% vs local median 8.3% in Hobart — below-typical yield; the buyer is paying a premium for something (appreciation thesis, condition, location) that the cap rate doesn't capture.
Location & tenants
- Location reads 53/100 on livability (#627 in OK) — a working-class tenant base; expect higher turnover. Strengths: cost of living A+; Watch: crime D+, amenities F, commute F.
- Hobart (town): math 23% / reading 28% proficiency, ranked #110 of 270 in OK (top 41%) — low school quality limits family demand, transient renter base, plan for 1-2y turnover; 63% free/reduced lunch — lower-income household profile, screen leases tightly.
- Zoned schools: Hobart Es (math 32% / reading 27%, grade F, #255 of 845 statewide, top 35%, 366 students, 0% FRL); Hobart Hs (math 5% / reading 24%, grade F, #332 of 447 statewide, top 78%, 197 students, 0% FRL) — zoned schools average 0% FRL vs 63% district-wide (63 pts lower); this property's tenant base skews higher-income than the district average.
- Market conditions: 52 active listings in the ZIP.
Forward outlook
- In year one you build about $16k of equity ($1k loan paydown + $15k appreciation (10.0% local appreciation)).
- At projected returns (10.0% appreciation + 3.0% rent growth), your $42k cash investment doubles in ~3 years — after that, you're playing with house money.
- By year 3, paydown + projected appreciation supports a ~$41k cash-out refi (75% LTV) — recoverable capital for the next deal without selling this one.
Negotiation context
- Only 11 days on market — expect competitive offers; lowballing is unlikely to land.
- 3 sale attempts since 5y ago with the ask held roughly flat each time — persistent listings suggest the price (not the market) is what's stuck; bring a comps-based counter.
- Current owner paid $130k; 15% above their basis — modest negotiation headroom, anchor on the comps not their cost.
Risks & watch-outs
- Watch-outs: built in 1928 — expect roof / HVAC / electrical / plumbing capex.
Questions for the listing agent
- Built in 1928 — when were the roof, HVAC, electrical panel, plumbing, and water heater last replaced?
- Is there a deadline driving the sale (1031 exchange, divorce, estate, relocation)? That informs how much negotiation room exists.
- Schools are F-rated, which usually means shorter tenancies and higher turnover. Who's the typical renter profile here, and what's been the actual vacancy rate?
- Crime grade is D in this area — have there been break-ins, vandalism, or insurance claims at this property in the last 3 years? What carrier currently insures it and at what premium?
- The area grade is low — what's the realistic commute time and amenity access for the typical tenant pool here? Any planned neighborhood developments (good or bad) we should know about?
- What's the average days-on-market for RENTAL listings here right now (not sales)? A rising rental-DOM trend means longer vacancies and softer asking-rent achievability than the comps imply.
- What's the recent tenant-quality profile in this submarket — average credit score on applications, eviction rate, late-payment / NSF rate, and stable-employment percentage? A property-management company in the area should have these aggregated.
- How much new for-sale + rental construction is in the pipeline within 1–3 miles? Heavy new supply typically softens prices + rents 12–24 months out; constrained supply supports both.
Investment metrics
- 1% rule
- 0.83% ✗
- Cap rate
- 6.48%
- Cash-on-cash
- 0.67%
- DSCR
- 1.03
- GRM
- 10.0
CMA / ARV
- ARV (on-the-fly)
- $90,944
- Comps found
- 12
Show comp detail 12 sales within ~0.75 mi
| Address | Dist | Beds/Ba | Sqft | Sold | Price | $/sf | Match |
|---|---|---|---|---|---|---|---|
| 118 S Hitchcock St | 0.17mi | 3/1.0 | 1,456 (-7%) | 20mo | $11,666 | $8 | 59 |
| 215 N Washington | 0.38mi | 3/2.0 | 1,416 (-10%) | 9mo | $139,500 | $99 | 59 |
| 326 N Washington St | 0.49mi | 3/2.0 | 1,523 (-3%) | 18mo | $83,100 | $55 | 58 |
| 415 N Hitchcock St | 0.50mi | 3/1.0 | 1,372 (-12%) | 6mo | $5,000 | $4 | 47 |
| 505 N Hill St | 0.55mi | 3/2.0 | 1,782 (+14%) | 8mo | $118,000 | $66 | 45 |
| 613 N Broadway | 0.71mi | 3/2.0 | 1,407 (-10%) | 6mo | $115,000 | $82 | 45 |
| 525 N Broadway St | 0.60mi | 3/2.0 | 1,696 (+8%) | 19mo | $9,000 | $5 | 43 |
| 201 N Randlett St | 0.27mi | 4/2.0 (+1) | 1,786 (+14%) | 20mo | $30,666 | $17 | 42 |
| 409 S Park Rd | 0.37mi | 3/1.0 | 1,366 (-13%) | 18mo | $79,000 | $58 | 42 |
| 829 S Washington St | 0.57mi | 2/2.0 (-1) | 1,375 (-12%) | 10mo | $130,000 | $95 | 40 |
| 621 N Lowe St | 0.74mi | 4/2.0 (+1) | 1,665 (+6%) | 21mo | $83,000 | $50 | 33 |
| 904 S Ohio | 0.66mi | 4/3.0 (+1) | 1,752 (+12%) | 13mo | $129,000 | $74 | 30 |
Match score weights: distance 35% · size 25% · config 20% · recency 20%. Top-matched comps best support the ARV.
Projected returns pro-forma
10.0% appreciation · 3.0% rent growth · sell at horizon
- IRR
- 24.8%
- Equity multiple
- 2.98×
- Total profit
- $83,154
- Equity at exit
- $135,132
- IRR
- 21.9%
- Equity multiple
- 6.80×
- Total profit
- $243,649
- Equity at exit
- $291,417
Cash invested: $42,000 (down + closing). Projections, not guarantees.
Landlord ↔ Tenant lean methodology
- Overall (STATE)
- 83 Strongly Landlord-Friendly
- State Oklahoma
- 83 Strongly Landlord-Friendly · R+20
- County
- — inherits STATE
- City
- — inherits STATE
ZIP-level market 73651
- Home prices YoY
- 8.0%
- Active inventory
- 52
- Price-to-rent
- 10.0×
Monthly cashflow live
- Estimated rent
- $1,245 medium interval (Pro) →
- Mortgage (P&I)
- −$787
- Tax from tax record
- −$111 /mo · $1,334/yr
- Insurance
- −$62
- HOA
- −$0
- Vacancy / Maint / Mgmt
- −$261
- Net cashflow
- $23
Break-even live
UW: 25.0% down · 7.5% · 30yr · 1.5% tax · 5.0% vac · 8.0% maint · 8.0% mgmt
Financing live
Cash to close
- Down payment
- $37,500
- Closing costs
- $4,500
- Reserves months
- —
- Total cash needed
- —
Loan-product check · same deal, 3 products live
Conventional
25% down · 7.5% · 30yr
- Down + closing
- —
- Monthly P&I
- —
- Monthly cashflow
- —
- DSCR
- —
- Eligible?
- —
Personal DTI + credit; lowest rate.
DSCR
20% down · 8.5% · 30yr
- Down + closing
- —
- Monthly P&I
- —
- Monthly cashflow
- —
- DSCR
- —
- Eligible?
- —
No personal income docs; deal must DSCR.
Hard money
10% down · 12.0% · 12mo
- Down + closing
- —
- Monthly P&I
- —
- Monthly cashflow
- —
- DSCR
- —
- Eligible?
- —
Short-term bridge; refi at stabilization.
Listing history 9 events
-
2026-06-18days on market $150,000 Active 11 DOM
-
2026-06-17days on market $150,000 Active 10 DOM
-
2026-06-16days on market $150,000 Active 9 DOM
-
2026-06-15days on market $150,000 Active 8 DOM
-
2026-06-13days on market $150,000 Active 6 DOM
-
2026-06-12days on market $150,000 Active 5 DOM
-
2026-06-09days on market $150,000 Active 2 DOM
-
2026-06-08remarks 699-char remark
-
2026-06-08$150,000 Active 1 DOM
ⓘ Source: listings_history table (triggers on properties + properties_extension) + one-shot
backfill from property_details.listing_events for pre-trigger history.
Tax reassessment forecast OK · Resets to sale price
- Current annual tax
- $1,334 · $111/mo
- Projected year-2 tax
- $1,350 · $112/mo
- Expected delta
- +$16/yr (+$1/mo · 1.2%)
ⓘ Screening estimate from a state-policy table — verify with the county assessor before closing.
Nearby sold comps map
Loading sold comps map…
Walkable amenities ~0.75 mi
Loading nearby amenities…
Taxation est. · year 1
- Rental income
- $14,942
- − Mortgage interest
- −$8,402
- − Property taxes
- −$1,334
- − Insurance
- −$750
- − Repairs & maintenance
- −$1,195
- − Management
- −$1,195
- − Depreciation
- −$4,364
- Taxable loss
- −$2,299
- Est. tax savings @ 24.0%
- +$552
- After-tax cash flow
- $832/yr
For passive investors: Depreciation is non-cash, so a rental often shows a tax loss while cash-flowing — sheltering income. Rental losses are passive: they offset passive income freely, and up to $25,000/yr can offset ordinary (W-2) income if you actively participate and your MAGI is under $100k (phasing out to $0 by $150k); unused losses carry forward. On sale, claimed depreciation is recaptured at up to 25%, and gains may owe capital-gains tax (a 1031 exchange can defer both). Figures are a year-1 estimate at your 24.0% rate — not tax advice; consult a CPA.
Schools (NCES district)
- District
- Hobart
- NCES district ID
- 4014700
- Math proficiency
- 23% ▼ -6.00%
- Reading proficiency
- 28% ▼ -8.00%
- Median HH income
- $36,779
- Composite
- 21.2/100
- National rank
- #8417
- State rank
- #110 of 270 in OK
Livability — Hobart
- Score
- 53/100
- State rank
- #627
- US rank
- #24677
Category grades
Schools grade is shown separately in the Schools card above.
Census & demographics
- Census place
- Hobart, OK
- City population
- 4,070
- Population (ZIP)
- 4,070
Population outlook (Kiowa County) Hauer SSP2
- Today (2025)
- 8,842 people
- By 2030
- 8,733 · -1.2%
- By 2040
- 8,641 · -2.3%
- By 2050
- 8,758 · -1.0%
- By 2075
- 9,894 · +11.9%
- By 2100
- 11,194 · +26.6%
Race, ethnicity, and origin ACS 2023
- Neighborhood character
- Predominantly White (72%)
- Race & ethnicity
- White 72% Hispanic / Latino 15% Two or more races 10% Black 4% Native American 2%
- Hispanic origin (detail)
- Mexican 13%
- Common ancestry
- Iranian 8% Italian 2% Slovak 1%
- Foreign-born
- 1% · Canada
- Languages at home
- 90% English-only · Spanish 10%
Political lean MEDSL · Kiowa
- 2024 margin
- Solid R (+58.3) · D 20.1% · R 78.4% · Other 1.6%
- 2008→2024 swing
- -23.5pp toward R · 2008: -34.8pp · 2024: -58.3pp
- All cycles
- 2024: R+58.3 2020: R+57.6 2016: R+52.4 2012: R+35.4 2008: R+34.8
Not yet ingested
- Civics
- —
Market trends
- HPI YoY
- ▲ 11.68%
- Current HPI
- 158.6311
- Rent YoY
- —
- Metro
- —
- State GDP YoY
- ▲ 1.55%
- F500 in state
- 6
Industry mix (Fortune 500 HQ in OK)
| Industry | F500 HQs | Revenue |
|---|---|---|
| Energy | 3 | $48B |
|
||
Price history
+92.3% since first listed9 events — show timeline
- 2026-06-07 Listed $150,000 MLSOK
- 2024-05-08 Sold (Public Records) $130,000 Public Records
- 2024-05-03 Sold (MLS) $130,000 MLSOK
- 2024-05-01 Pending — MLSOK
- 2024-03-13 Listed $132,000 MLSOK
- 2021-06-28 Sold (MLS) $42,222 MLSOK
- 2021-04-26 Pending — MLSOK
- 2021-04-10 Listed $24,500 MLSOK
- 2017-08-24 Sold (Public Records) $78,000 Public Records
Property tax history
+40.8%/yrLatest (2025): $1,334 · +46.9% YoY. Source: county tax records.
Cash-flow waterfall
monthlySold comps — $/sqft
last 12 mo · ≤1 miLoading sold comps…