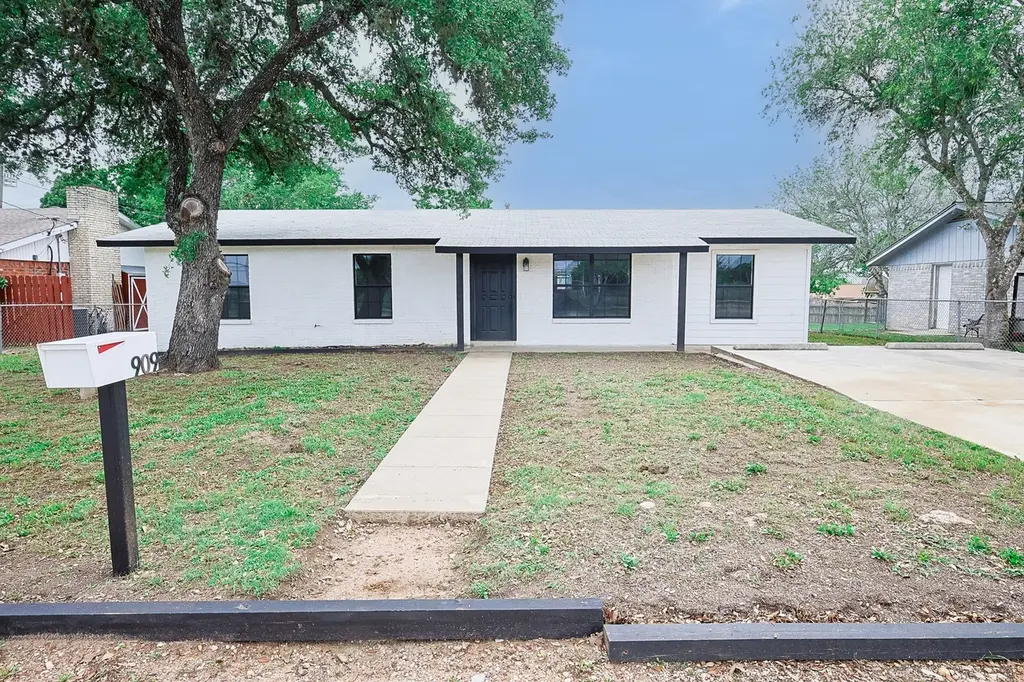
909 E Sarah St · Cuero, TX
Flood risk 1/10 · Minimal
- FEMA flood zone
- X (unshaded)
- Chance of flooding over 30 yrs
- 0.0%
- Est. flood insurance / yr
- $507 – $1,088
Fire risk 6/10 · Moderate
- Est. fire insurance / yr
- $1,222 – $2,270
Heat risk 8/10 · Major
- Hot days now (above 111°F)
- 7 days/yr
- Hot days in 30 yrs
- 21 days/yr
Wind risk 8/10 · Major
- Chance of severe wind over 30 yrs
- 99.0%
Air-quality risk 1/10 · Minimal
- Unhealthy air days now
- 0 days/yr
- Unhealthy air days in 30 yrs
- 0 days/yr
Risk factors via First Street. Map © Google.
Why this score? — see what drove the C- grade
The composite is a weighted blend of 9 inputs, each scored 0–100. Each bar is that input's sub-score; the figure is the points it added to the 100-point composite (weight × sub-score).
- Cash flow +16.5/30.0
- ARV discount +14.7/15.0
- DSCR +5.1/10.0
- 1% rule +4.7/10.0
- Schools +3.3/10.0
- Livability +3.3/5.0
- Rent growth +2.5/5.0
- Condition / age +2.5/5.0
- Appreciation +0.0/10.0
$184,950
🖨 Deal sheet 📄 Offer letter ✓ Due diligence
Listing remarks
Welcome to 909 E Sarah Street, a charming home located in the heart of Cuero, offering comfort, character, and small-town appeal. This well-maintained property features a functional layout with inviting living spaces and abundant natural light throughout. The home offers 4 bedrooms and 2 bathrooms, providing flexibility for families, guests, or a home office setup. The spacious living area flows seamlessly into the dining space, while the kitchen offers ample cabinetry and workspace for everyday convenience. The home provides easy access to major routes including U. S. Highway 87 and U. S. Highway 183, making travel to nearby cities such as Victoria and San Antonio convenient.
Key facts
- Ample cabinetry
- Functional layout
- 9,099 sq ft lot
Tags
Property features AI
Finance
- Financial info: Lease not considered
Exterior
- Utilities: Public water; Public sewer
- Home design: Residential property; Single-story entry (all rooms listed on the first floor)
- Construction: Built in 1968; Brick construction; Slab foundation
- Exterior features: Lot of approximately 0.2089 acres; Lot features listed as Other
Interior
- Bedrooms: Primary bedroom on the first floor (approx. 10x10); Three additional bedrooms on the first floor (each approx. 9x8); One bedroom on the first floor (approx. 9x8)
- Bathrooms: Two full bathrooms; Primary bathroom on the first floor (approx. 6x4); Additional bathroom on the first floor (approx. 5x4)
- Heating & cooling: Central electric heating; Central electric cooling (Central Air)
- Interior features: Six total rooms
Neighborhood map
What this means for you Summary
Snapshot
- This is a 4-bed/2.0-bath single-family listed at $185k.
Deal economics
- At list price, monthly cash flow is $107 ($1k/yr) — positive.
- The deal already cash-flows at list — no discount required.
- To meet the 1% rule (rent ≥ 1% of price), the offer needs to be $180k (2.9% below list).
- Recommended offer: $179k (3.0% below list) — sets the bar for market timing.
- Cap rate 7.0% vs local median 5.1% in Cuero — top-decile yield for the area; either an underpriced asset or a hidden risk that comps aren't pricing in. Stress-test before assuming the spread holds.
Location & tenants
- Location reads 66/100 on livability (#617 in TX) — a middle-class / working-renter tenant base. Strengths: cost of living A+, housing A+, health & safety A+; Watch: crime F, amenities F, commute F.
- Cuero ISD (town): math 34% / reading 42% proficiency, ranked #454 of 826 in TX (top 55%) — families likely to look elsewhere, expect single-tenant / working-renter base with shorter leases.
- Zoned schools: Cuero H S (math 37% / reading 57%, grade D-, #591 of 1,632 statewide, top 38%, 638 students, 53% FRL) — zoned schools at 53% FRL track the district average.
- Market conditions: 115 active listings in the ZIP; 2 comparable units currently listed for rent nearby; 9 units permitted in DeWitt County in 2024 (0 in 5+ unit buildings).
Forward outlook
- Local home prices are declining (-3.0%/yr); year-one equity from $1k of loan paydown is wiped out by about $6k of value loss. Plan a longer hold.
- DeWitt County population projected at +16% by 2050 — long-run rental-demand tailwind backs the buy-and-hold thesis.
Negotiation context
- It's been on market 53 days — a 3% lower offer ($179k) is reasonable based on typical stale-listing flexibility.
Risks & watch-outs
- Climate carrying-cost: severe wind risk, 99% chance of damaging wind over 30y; major wildfire risk; extreme-heat days projected 7→21/yr by 2055 (HVAC capex compounding) — expect insurance premiums to compound above CPI over the hold.
Questions for the listing agent
- It's been on market 53 days. Have you received any prior offers? Is the seller open to a 3% concession, seller financing, or rate buy-down credit?
- Built in 1968 — when were the roof, HVAC, electrical panel, plumbing, and water heater last replaced?
- Is there a deadline driving the sale (1031 exchange, divorce, estate, relocation)? That informs how much negotiation room exists.
- Schools are D-rated, which usually means shorter tenancies and higher turnover. Who's the typical renter profile here, and what's been the actual vacancy rate?
- Crime grade is F in this area — have there been break-ins, vandalism, or insurance claims at this property in the last 3 years? What carrier currently insures it and at what premium?
- What's the average days-on-market for RENTAL listings here right now (not sales)? A rising rental-DOM trend means longer vacancies and softer asking-rent achievability than the comps imply.
- What's the recent tenant-quality profile in this submarket — average credit score on applications, eviction rate, late-payment / NSF rate, and stable-employment percentage? A property-management company in the area should have these aggregated.
- How much new for-sale + rental construction is in the pipeline within 1–3 miles? Heavy new supply typically softens prices + rents 12–24 months out; constrained supply supports both.
Investment metrics
- 1% rule
- 0.97% ✗
- Cap rate
- 6.99%
- Cash-on-cash
- 2.48%
- DSCR
- 1.11
- GRM
- 8.6
CMA / ARV
- ARV (median comp)
- $219,990
- List price
- $184,950
- Delta
- -15.93%
- Verdict
- UNDERPRICED
- Comps
- 19 within 1.0 mi
Show comp detail 8 sales within ~0.75 mi
| Address | Dist | Beds/Ba | Sqft | Sold | Price | $/sf | Match |
|---|---|---|---|---|---|---|---|
| 901 E Sarah St | 0.05mi | 3/2.0 (-1) | 1,349 (-2%) | 8mo | $174,500 | $129 | 83 |
| 705 Third St | 0.42mi | 3/2.0 (-1) | 1,396 (+1%) | 1mo | $180,000 | $129 | 72 |
| 101 Boulder Ridge Dr | 0.26mi | 4/2.0 | 1,510 (+10%) | 1mo | $243,990 | $162 | 71 |
| 220 Boulder Ridge Dr | 0.45mi | 4/2.0 | 1,510 (+10%) | 1mo | $243,990 | $162 | 62 |
| 104 Alamo Cir | 0.34mi | 3/2.0 (-1) | 1,561 (+13%) | 1mo | $248,000 | $159 | 56 |
| 222 Boulder Ridge Dr | 0.46mi | 3/2.0 (-1) | 1,209 (-12%) | 1mo | $219,990 | $182 | 52 |
| 205 Third St | 0.68mi | 3/2.0 (-1) | 1,426 (+4%) | 13mo | $280,000 | $196 | 47 |
| 506 Second St | 0.51mi | 3/1.0 (-1) | 1,218 (-12%) | 6mo | $154,500 | $127 | 43 |
Match score weights: distance 35% · size 25% · config 20% · recency 20%. Top-matched comps best support the ARV.
Projected returns pro-forma
-3.0% appreciation · 3.0% rent growth · sell at horizon
- IRR
- -12.3%
- Equity multiple
- 0.55×
- Total profit
- $-23,112
- Equity at exit
- $27,577
- IRR
- -3.2%
- Equity multiple
- 0.78×
- Total profit
- $-11,161
- Equity at exit
- $15,991
Cash invested: $51,786 (down + closing). Projections, not guarantees.
Landlord ↔ Tenant lean methodology
- Overall (STATE)
- 87 Strongly Landlord-Friendly
- State Texas
- 87 Strongly Landlord-Friendly · R+5
- County
- — inherits STATE
- City
- — inherits STATE
ZIP-level market 77954
- Active inventory
- 115
- Price-to-rent
- 8.6×
Monthly cashflow live
- Estimated rent
- $1,797 medium interval (Pro) →
- Mortgage (P&I)
- −$970
- Tax from tax record
- −$266 /mo · $3,187/yr
- Insurance
- −$77
- HOA
- −$0
- Vacancy / Maint / Mgmt
- −$377
- Net cashflow
- $107
Break-even live
UW: 25.0% down · 7.5% · 30yr · 1.5% tax · 5.0% vac · 8.0% maint · 8.0% mgmt
Financing live
Cash to close
- Down payment
- $46,238
- Closing costs
- $5,548
- Reserves months
- —
- Total cash needed
- —
Loan-product check · same deal, 3 products live
Conventional
25% down · 7.5% · 30yr
- Down + closing
- —
- Monthly P&I
- —
- Monthly cashflow
- —
- DSCR
- —
- Eligible?
- —
Personal DTI + credit; lowest rate.
DSCR
20% down · 8.5% · 30yr
- Down + closing
- —
- Monthly P&I
- —
- Monthly cashflow
- —
- DSCR
- —
- Eligible?
- —
No personal income docs; deal must DSCR.
Hard money
10% down · 12.0% · 12mo
- Down + closing
- —
- Monthly P&I
- —
- Monthly cashflow
- —
- DSCR
- —
- Eligible?
- —
Short-term bridge; refi at stabilization.
Rent comps 2 comps
| Address | Beds | Baths | Sqft | Rent | $/sqft | DOM | Units | Dist |
|---|---|---|---|---|---|---|---|---|
| 921 E Courthouse St Cuero, TX | 3.0 | 1.0 | 1000 | $1,100 | $1.10 | 43d | 1 | 0.29mi |
| 909 2nd St Cuero, TX | 3.0 | 2.0 | 1224 | $2,500 | $2.04 | 43d | 1 | 0.36mi |
Listing history 17 events
-
2026-06-19days on market $184,950 Active 53 DOM
-
2026-06-18days on market $184,950 Active 52 DOM
-
2026-06-17days on market $184,950 Active 51 DOM
-
2026-06-16days on market $184,950 Active 50 DOM
-
2026-06-15days on market $184,950 Active 49 DOM
-
2026-06-14days on market $184,950 Active 47 DOM
-
2026-06-13days on market $184,950 Active 46 DOM
-
2026-06-10days on market $184,950 Active 44 DOM
-
2026-06-09days on market $184,950 Active 43 DOM
-
2026-06-08days on market $184,950 Active 42 DOM
-
2026-06-07pricedays on market $184,950 Active 41 DOM
-
2026-06-02days on market $194,950 Active 36 DOM
-
2026-06-01days on market $194,950 Active 35 DOM
-
2026-05-31days on market $194,950 Active 34 DOM
-
2026-05-30days on market $194,950 Active 33 DOM
-
2026-04-27$194,950 Active 683-char remark
-
2023-06-02soldstatus
ⓘ Source: listings_history table (triggers on properties + properties_extension) + one-shot
backfill from property_details.listing_events for pre-trigger history.
Tax reassessment forecast TX · Resets to sale price
- Current annual tax
- $3,187 · $266/mo
- Projected year-2 tax
- $3,385 · $282/mo
- Expected delta
- +$198/yr (+$16/mo · 6.2%)
ⓘ Screening estimate from a state-policy table — verify with the county assessor before closing.
Climate risk First Street
- Flood 1/10 Low FEMA zone X (unshaded) · 0% chance over 30 yrs
- Wildfire 6/10 Major
- Heat 8/10 Severe 7 d/yr ≥111°F today · 21 d/yr by 30 yrs out
- Wind 8/10 Severe 99% chance of damaging wind over 30 yrs
- Air quality 1/10 Low 0 unhealthy d/yr today · 0 by 30 yrs out
Nearby sold comps map
Loading sold comps map…
Walkable amenities ~0.75 mi
Loading nearby amenities…
Taxation est. · year 1
- Rental income
- $21,561
- − Mortgage interest
- −$10,360
- − Property taxes
- −$3,187
- − Insurance
- −$925
- − Repairs & maintenance
- −$1,725
- − Management
- −$1,725
- − Depreciation
- −$5,380
- Taxable loss
- −$1,741
- Est. tax savings @ 24.0%
- +$418
- After-tax cash flow
- $1,701/yr
For passive investors: Depreciation is non-cash, so a rental often shows a tax loss while cash-flowing — sheltering income. Rental losses are passive: they offset passive income freely, and up to $25,000/yr can offset ordinary (W-2) income if you actively participate and your MAGI is under $100k (phasing out to $0 by $150k); unused losses carry forward. On sale, claimed depreciation is recaptured at up to 25%, and gains may owe capital-gains tax (a 1031 exchange can defer both). Figures are a year-1 estimate at your 24.0% rate — not tax advice; consult a CPA.
Schools (NCES district)
- District
- Cuero ISD
- NCES district ID
- 4815960
- Math proficiency
- 34% ▼ -7.00%
- Reading proficiency
- 42% ▬ 0.00%
- Median HH income
- $46,956
- Composite
- 32.52/100
- National rank
- #5700
- State rank
- #454 of 826 in TX
Livability — Cuero
- Score
- 66/100
- State rank
- #617
- US rank
- #11713
Category grades
Schools grade is shown separately in the Schools card above.
Census & demographics
- Census place
- Cuero, TX
- City population
- 11,007
- Population (ZIP)
- 11,007
Population outlook (DeWitt County) Hauer SSP2
- Today (2025)
- 22,271 people
- By 2030
- 22,953 · +3.1%
- By 2040
- 24,396 · +9.5%
- By 2050
- 25,921 · +16.4%
- By 2075
- 29,672 · +33.2%
- By 2100
- 29,516 · +32.5%
Race, ethnicity, and origin ACS 2023
- Neighborhood character
- Diverse neighborhood (Simpson 0.61)
- Race & ethnicity
- White 48% Hispanic / Latino 38% Two or more races 13% Black 10% Native American 2%
- Hispanic origin (detail)
- Mexican 32%
- Common ancestry
- Romanian 2% Lithuanian 1% Serbian 1%
- Foreign-born
- 2% · Canada
- Languages at home
- 83% English-only · Spanish 16%
Political lean MEDSL · DeWitt
- 2024 margin
- Solid R (+67.0) · D 16.2% · R 83.3%
- 2008→2024 swing
- -19.2pp toward R · 2008: -47.9pp · 2024: -67.0pp
- All cycles
- 2024: R+67.0 2020: R+62.5 2016: R+63.8 2012: R+55.1 2008: R+47.9
Not yet ingested
- Civics
- —
Market trends
- HPI YoY
- ▼ -98.54%
- Current HPI
- 171.7238
- Rent YoY
- —
- Metro
- —
- State GDP YoY
- ▲ 3.95%
- F500 in state
- 110
Industry mix (Fortune 500 HQ in TX)
| Industry | F500 HQs | Revenue |
|---|---|---|
| Energy | 16 | $1,198B |
|
||
| Technology | 5 | $198B |
|
||
| Engineering / Construction | 4 | $72B |
|
||
| Energy Services | 3 | $60B |
|
||
| Utilities | 3 | $41B |
|
||
| Healthcare | 2 | $330B |
|
||
Price history
-5.1% since first listed3 events — show timeline
- 2026-06-04 Price Changed $184,950 HARMLS
- 2026-04-27 Listed $194,950 HARMLS
- 2023-06-02 Sold (Public Records) — Public Records
Property tax history
+6.6%/yrLatest (2025): $3,187 · +19.6% YoY. Source: county tax records.
Cash-flow waterfall
monthlySold comps — $/sqft
last 12 mo · ≤1 miLoading sold comps…