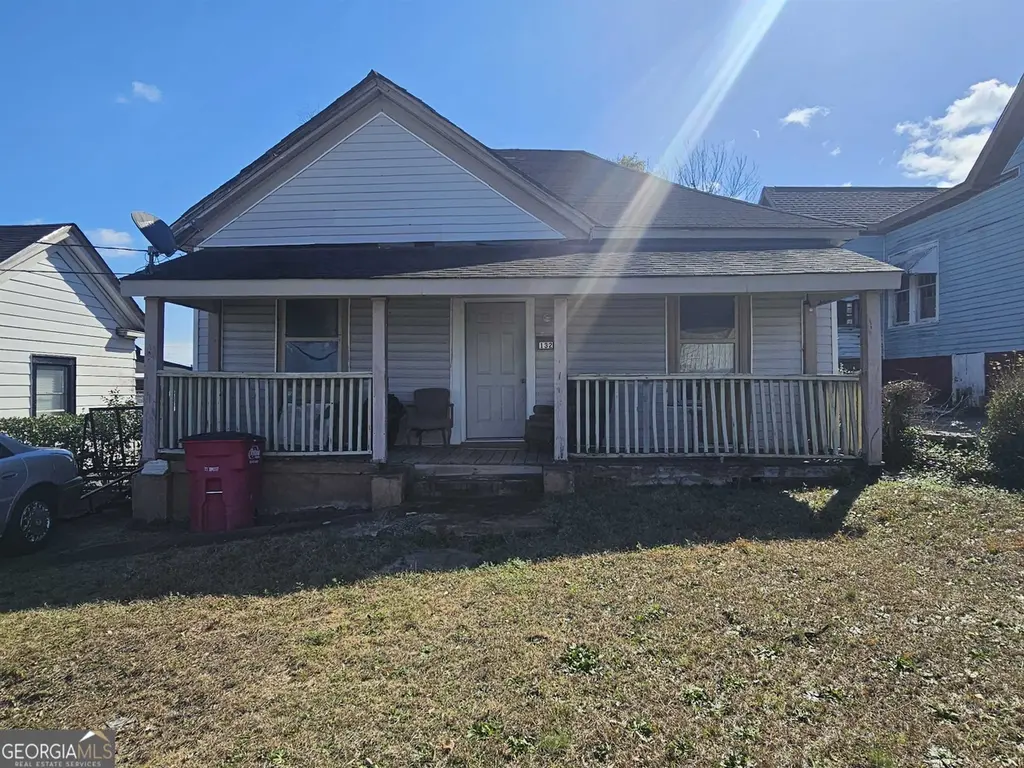
132 Madison St · Macon-Bibb County, GA
Flood risk 1/10 · Minimal
- FEMA flood zone
- X (unshaded)
- Chance of flooding over 30 yrs
- 0.0%
- Est. flood insurance / yr
- $507 – $1,088
Fire risk 1/10 · Minimal
- Est. fire insurance / yr
- $963 – $1,789
Heat risk 8/10 · Major
- Hot days now (above 108°F)
- 7 days/yr
- Hot days in 30 yrs
- 18 days/yr
Wind risk 6/10 · Moderate
- Chance of severe wind over 30 yrs
- 65.0%
Air-quality risk 4/10 · Minor
- Unhealthy air days now
- 5 days/yr
- Unhealthy air days in 30 yrs
- 5 days/yr
Risk factors via First Street. Map © Google.
Why this score? — see what drove the B- grade
The composite is a weighted blend of 9 inputs, each scored 0–100. Each bar is that input's sub-score; the figure is the points it added to the 100-point composite (weight × sub-score).
- Cash flow +30.0/30.0
- 1% rule +10.0/10.0
- DSCR +10.0/10.0
- ARV discount +7.5/15.0
- Rent growth +3.3/5.0
- Livability +2.5/5.0
- Condition / age +2.5/5.0
- Schools +1.2/10.0
- Appreciation +0.0/10.0
$72,000
🖨 Deal sheet 📄 Offer letter ✓ Due diligence
Listing remarks MLS
Great for an investor. 3 Bedrooms 2 full bathrooms, Separate living room. Huge home lots of space. Private backyard, off street parking, washer and dryer hook-up. This home has partial rehab, but still needs work. Home is conveniently located near the I-75 & I-16 interstates, Downtown Macon, Restaurants, Navicent Health and Mercer University. Owner finance available. $3oK Down.
Key facts
- Off street parking
- Private backyard
- Near restaurants
Tags
Neighborhood map
What this means for you Summary
Snapshot
- This is a 3-bed/2.0-bath single-family listed at $72k.
Deal economics
- At list price, monthly cash flow is $692 ($8k/yr) — positive.
- The deal already cash-flows at list — no discount required.
- Meets the 1% rule at list price ($1k rent vs $72k).
- Recommended offer: $63k (12.0% below list) — sets the bar for market timing.
- Cap rate 17.8% vs local median 5.4% in Macon-Bibb County — top-decile yield for the area; either an underpriced asset or a hidden risk that comps aren't pricing in. Stress-test before assuming the spread holds.
Location & tenants
- Location reads: area grade B — affects rentability + tenant quality, not the cash-flow math above.
- Bibb County (urban): math 11% / reading 18% proficiency, ranked #161 of 174 in GA (top 92%) — low school quality limits family demand, transient renter base, plan for 1-2y turnover; 75% free/reduced lunch — lower-income household profile, screen leases tightly.
- Market conditions: Rents rising (+3.1%/yr); 75 active listings in the ZIP; 40 comparable units currently listed for rent nearby; rentals at typical pace (median 21d on market — plan ~3-4 weeks tenant-placement turnaround); 42% of comp listings sitting > 30 days — soft ceiling on asking rent; lower-income renter base — watch delinquency; 154 units permitted in Bibb County in 2024 (0 in 5+ unit buildings).
- At $1,422/mo this rent would consume 58% of the median local household income ($29k/yr) (locally 1124% of renters already pay >50% of income on rent) — very limited rent-growth headroom before tenants either downsize or default.
Forward outlook
- Local home prices are declining (-3.0%/yr); year-one equity from $498 of loan paydown is wiped out by about $2k of value loss. Plan a longer hold.
- Bibb County population projected at -12% by 2050 — secular population decline; favor cash flow + early exit over multi-decade hold.
- At projected returns (-3.0% appreciation + 3.1% rent growth), your $20k cash investment doubles in ~3 years — after that, you're playing with house money.
Negotiation context
- It's been on market 262 days — a 12% lower offer ($63k) is reasonable based on typical stale-listing flexibility.
- 7 sale attempts since 9y ago with the ask held roughly flat each time — persistent listings suggest the price (not the market) is what's stuck; bring a comps-based counter.
- Current owner paid $12k; list at $72k implies a 500% gain — meaningful room to come down on a strong offer.
Risks & watch-outs
- Watch-outs: built in 1900 — expect roof / HVAC / electrical / plumbing capex.
- Climate carrying-cost: major wind risk, 65% chance of damaging wind over 30y; extreme-heat days projected 7→18/yr by 2055 (HVAC capex compounding) — expect insurance premiums to compound above CPI over the hold.
Questions for the listing agent
- It's been on market 262 days. Have you received any prior offers? Is the seller open to a 12% concession, seller financing, or rate buy-down credit?
- Built in 1900 — when were the roof, HVAC, electrical panel, plumbing, and water heater last replaced?
- Why hasn't it sold? Are there any deal-killer items the seller is aware of (foundation, flood, title, zoning, code violations)?
- Is there a deadline driving the sale (1031 exchange, divorce, estate, relocation)? That informs how much negotiation room exists.
- What's the average days-on-market for RENTAL listings here right now (not sales)? A rising rental-DOM trend means longer vacancies and softer asking-rent achievability than the comps imply.
- What's the recent tenant-quality profile in this submarket — average credit score on applications, eviction rate, late-payment / NSF rate, and stable-employment percentage? A property-management company in the area should have these aggregated.
- How much new for-sale + rental construction is in the pipeline within 1–3 miles? Heavy new supply typically softens prices + rents 12–24 months out; constrained supply supports both.
Investment metrics
- 1% rule
- 1.97% ✓
- Cap rate
- 17.82%
- Cash-on-cash
- 41.17%
- DSCR
- 2.83
- GRM
- 4.2
CMA / ARV
- ARV (median comp)
- $147,878
- List price
- $72,000
- Delta
- -51.31%
- Verdict
- UNDERPRICED
- Comps
- 20 within 1.0 mi
Show comp detail 11 sales within ~0.75 mi
| Address | Dist | Beds/Ba | Sqft | Sold | Price | $/sf | Match |
|---|---|---|---|---|---|---|---|
| 218 Orange St | 0.20mi | 4/2.0 (+1) | 1,792 (+4%) | 5mo | $155,000 | $86 | 74 |
| 1622 Orchard Ave | 0.24mi | 3/2.0 | 1,727 (+0%) | 17mo | $90,000 | $52 | 74 |
| 1057 Bond St | 0.26mi | 3/2.0 | 1,887 (+10%) | 14mo | $300,050 | $159 | 61 |
| 558 Forest Ave | 0.72mi | 3/2.0 | 1,780 (+3%) | 13mo | $75,000 | $42 | 50 |
| 1446 2nd Ave | 0.34mi | 3/1.5 | 1,562 (-9%) | 21mo | $66,000 | $42 | 49 |
| 833 Parkview Ct | 0.67mi | 3/2.5 | 1,522 (-12%) | 2mo | $200,000 | $131 | 46 |
| 377 Grant Ave | 0.55mi | 4/2.0 (+1) | 1,972 (+14%) | 3mo | $40,000 | $20 | 42 |
| 435 New St | 0.64mi | 3/2.5 | 1,936 (+12%) | 7mo | $329,800 | $170 | 42 |
| 361 Grant Ave | 0.55mi | 4/2.0 (+1) | 1,923 (+12%) | 19mo | $114,900 | $60 | 34 |
| 1745 1st Ave | 0.51mi | 4/2.0 (+1) | 1,934 (+12%) | 23mo | $40,000 | $21 | 32 |
| 191 Forest Ave | 0.71mi | 4/2.0 (+1) | 1,514 (-12%) | 22mo | $20,500 | $14 | 23 |
Match score weights: distance 35% · size 25% · config 20% · recency 20%. Top-matched comps best support the ARV.
Projected returns pro-forma
-3.0% appreciation · 3.11% rent growth · sell at horizon
- IRR
- 37.8%
- Equity multiple
- 2.61×
- Total profit
- $32,529
- Equity at exit
- $10,735
- IRR
- 44.4%
- Equity multiple
- 5.25×
- Total profit
- $85,626
- Equity at exit
- $6,225
Cash invested: $20,160 (down + closing). Projections, not guarantees.
Landlord ↔ Tenant lean methodology
- Overall (STATE)
- 90 Strongly Landlord-Friendly
- State Georgia
- 90 Strongly Landlord-Friendly · R+3
- County
- — inherits STATE
- City
- — inherits STATE
ZIP-level market 31201
- Rents YoY
- 3.1%
- Active inventory
- 75
- Price-to-rent
- 4.2×
Monthly cashflow live
- Estimated rent
- $1,422 high interval (Pro) →
- Mortgage (P&I)
- −$378
- Tax from tax record
- −$24 /mo · $287/yr
- Insurance
- −$30
- HOA
- −$0
- Vacancy / Maint / Mgmt
- −$299
- Net cashflow
- $692
Break-even live
UW: 25.0% down · 7.5% · 30yr · 1.5% tax · 5.0% vac · 8.0% maint · 8.0% mgmt
Financing live
Cash to close
- Down payment
- $18,000
- Closing costs
- $2,160
- Reserves months
- —
- Total cash needed
- —
Loan-product check · same deal, 3 products live
Conventional
25% down · 7.5% · 30yr
- Down + closing
- —
- Monthly P&I
- —
- Monthly cashflow
- —
- DSCR
- —
- Eligible?
- —
Personal DTI + credit; lowest rate.
DSCR
20% down · 8.5% · 30yr
- Down + closing
- —
- Monthly P&I
- —
- Monthly cashflow
- —
- DSCR
- —
- Eligible?
- —
No personal income docs; deal must DSCR.
Hard money
10% down · 12.0% · 12mo
- Down + closing
- —
- Monthly P&I
- —
- Monthly cashflow
- —
- DSCR
- —
- Eligible?
- —
Short-term bridge; refi at stabilization.
Rent comps 40 comps
| Address | Beds | Baths | Sqft | Rent | $/sqft | DOM | Units | Dist |
|---|---|---|---|---|---|---|---|---|
| 147 Orange St Macon, GA | 3.0 | 2.0 | 1500 | $1,695 | $1.13 | 13d | 1 | 0.17mi |
| 218 Orange St Macon, GA | 2.0 | 1.0 | 1100 | $1,300 | $1.18 | 21d | 1 | 0.20mi |
| 347 College St Macon, GA | 2.0 | 1.0–2.0 | 725 | $2,600 | $3.59 | 13d | 4 | 0.25mi |
| 391 Madison St Macon, GA | 3.0 | 2.0 | 1236 | $1,350 | $1.09 | 13d | 1 | 0.32mi |
| 952 Georgia Ave Macon, GA | 2.0 | 2.0 | 1115 | $1,295 | $1.16 | 43d | 1 | 0.44mi |
| 384 Spring St Unit 1 Macon, GA | 3.0 | 2.0 | 1200 | $1,250 | $1.04 | 43d | 1 | 0.53mi |
| 1930 Northbrook Ave Macon, GA | 3.0 | 1.0 | 1071 | $1,400 | $1.31 | 13d | 1 | 0.60mi |
| 1930 Northbrook Ave Macon, GA | 3.0 | 1.0 | 1071 | $1,400 | $1.31 | 43d | 1 | 0.60mi |
| 1975 Vineville Ave Macon, GA | 1.0–3.0 | 1.0 | 1050 | $950 | $0.90 | 21d | 5 | 0.67mi |
| 813 Forsyth St Unit C Macon, GA | 2.0 | 2.0 | 1105 | $1,400 | $1.27 | 13d | 1 | 0.73mi |
| 850 Parkview Ct Macon, GA | 3.0 | 2.5 | 1520 | $1,700 | $1.12 | 21d | 1 | 0.77mi |
| 850 Parkview Ct Macon, GA | 3.0 | 2.5 | 1520 | $1,700 | $1.12 | 43d | 1 | 0.77mi |
| 484 1st St #300 Macon, GA | 2.0 | 1.0 | 1400 | $1,625 | $1.16 | 13d | 1 | 0.78mi |
| 879 Nottingham Dr Macon, GA | 3.0 | 2.5 | 2147 | $1,700 | $0.79 | 13d | 1 | 0.81mi |
| 2063 Vineville Ave Unit N5 Macon, GA | 3.0 | 2.0 | 1169 | $1,200 | $1.03 | 21d | 1 | 0.84mi |
| 867 Orange Ter #2 Macon, GA | 2.0 | 1.0 | 1088 | $1,500 | $1.38 | 43d | 1 | 0.90mi |
| 867 Orange Ter Unit B Macon, GA | 2.0 | 2.0 | 1088 | $1,400 | $1.29 | 43d | 1 | 0.90mi |
| 870 Laurel Ave Macon, GA | 3.0 | 2.0 | 2205 | $1,300 | $0.59 | 43d | 1 | 0.95mi |
| 440 Bonnie Dr Macon, GA | 2.0 | 1.5 | 1192 | $1,700 | $1.43 | 43d | 1 | 0.95mi |
| 2259 Robin Lyn Ct Unit 31204 Macon, GA | 2.0 | 2.5 | 1560 | $1,295 | $0.83 | 43d | 1 | 0.98mi |
| 2259 Robin Lyn Ct Macon, GA | 2.0 | 3.0 | 1560 | $1,295 | $0.83 | 43d | 1 | 0.98mi |
| 462 Cherry St Macon, GA | 2.0 | 1.0–2.0 | 988 | $3,000 | $3.03 | 13d | 25 | 0.98mi |
| 2261 Robin Lyn Ct Unit 31204 Macon, GA | 2.0 | 2.5 | 1560 | $1,295 | $0.83 | 43d | 1 | 0.99mi |
| 2261 Robin Lyn Ct Macon, GA | 2.0 | 3.0 | 1560 | $1,295 | $0.83 | 43d | 1 | 0.99mi |
| 476 3rd St Macon, GA | 2.0 | 1.0 | 942 | $1,850 | $1.96 | 13d | 8 | 0.99mi |
| 957 New St Macon, GA | 2.0 | 1.5 | 1200 | $1,050 | $0.88 | 13d | 1 | 1.00mi |
| 2269 Robin Lyn Ct Macon, GA | 3.0 | 3.0 | 1560 | $1,375 | $0.88 | 21d | 1 | 1.00mi |
| 2269 Robin Lyn Ct Unit 31204 Macon, GA | 3.0 | 2.5 | 1560 | $1,375 | $0.88 | 21d | 1 | 1.00mi |
| 1232 Shamrock St Macon, GA | 3.0 | 2.0 | 1282 | $1,700 | $1.33 | 13d | 1 | 1.07mi |
| 370 Cherry St Macon, GA | 2.0 | 2.0 | 1500 | $1,400 | $0.93 | 43d | 1 | 1.08mi |
| 1268 College St Unit 1 Macon, GA | 2.0 | 2.0 | 1500 | $1,730 | $1.15 | 43d | 1 | 1.09mi |
| 328 Rogers Ave Macon, GA | 3.0 | 2.0 | 1355 | $1,200 | $0.89 | 43d | 1 | 1.10mi |
| 425 Rogers Ave Macon, GA | 3.0 | 2.0 | 1646 | $1,375 | $0.84 | 13d | 1 | 1.10mi |
| 1227 Calhoun St Macon, GA | 2.0 | 1.5 | 1212 | $1,200 | $0.99 | 43d | 1 | 1.11mi |
| 378 Cowan St Unit 382 Macon, GA | 2.0 | 1.5 | 1166 | $900 | $0.77 | 21d | 1 | 1.20mi |
| 382 Cowan St Macon, GA | 2.0 | 1.5 | 1166 | $900 | $0.77 | 43d | 1 | 1.20mi |
| 1371 Ross St Macon, GA | 3.0 | 2.0 | 1541 | $1,200 | $0.78 | 13d | 1 | 1.21mi |
| 390 Cowan St Unit 394 Macon, GA | 2.0 | 1.5 | 1166 | $900 | $0.77 | 21d | 1 | 1.22mi |
| 185 Oak Haven Ave Apt A4 Macon, GA | 3.0 | 2.0 | 1100 | $1,200 | $1.09 | 21d | 1 | 1.24mi |
| 2154 Napier Ave Macon, GA | 3.0 | 1.0 | 1344 | $1,400 | $1.04 | 21d | 1 | 1.25mi |
Listing history 34 events
-
2026-06-19days on market $72,000 Active 262 DOM
-
2026-06-18days on market $72,000 Active 261 DOM
-
2026-06-17days on market $72,000 Active 260 DOM
-
2026-06-16days on market $72,000 Active 259 DOM
-
2026-06-15days on market $72,000 Active 258 DOM
-
2026-06-14days on market $72,000 Active 256 DOM
-
2026-06-13days on market $72,000 Active 255 DOM
-
2026-06-10days on market $72,000 Active 253 DOM
-
2026-06-09days on market $72,000 Active 252 DOM
-
2026-06-09days on market $72,000 Active 251 DOM
-
2026-06-07days on market $72,000 Active 250 DOM
-
2026-06-03days on market $72,000 Active 246 DOM
-
2026-06-02days on market $72,000 Active 245 DOM
-
2026-06-01days on market $72,000 Active 244 DOM
-
2026-05-31days on market $72,000 Active 243 DOM
-
2026-05-30days on market $72,000 Active 242 DOM
-
2025-09-25$72,000 New 384-char remark
Show marketing remark (384 chars)
Great for an investor. 3 Bedrooms 2 full bathrooms, Separate living room. Huge home lots of space. Private backyard, off street parking, washer and dryer hook-up. This home has partial rehab, but still needs work. Home is conveniently located near the I-75 & I-16 interstates, Downtown Macon, Restaurants, Navicent Health and Mercer University. Owner finance available. $3oK Down.
-
2025-05-31historical
-
2025-02-04status Back On Market
-
2025-01-31historical
-
2024-11-02price $86,000
-
2024-05-30historical
-
2024-05-07price $90,000
-
2024-03-31historical
-
2024-02-23$88,000 New
-
2024-02-23$95,000 New
-
2024-02-23$95,000 New
-
2022-09-23historical
-
2022-03-23$120,000 New
-
2017-09-19soldstatus $12,000
-
2017-04-24$14,900
-
2003-12-22soldstatus $12,800
-
2001-11-01soldstatus $25,000
-
2001-08-01soldstatus $20,000
ⓘ Source: listings_history table (triggers on properties + properties_extension) + one-shot
backfill from property_details.listing_events for pre-trigger history.
Tax reassessment forecast GA · Resets to sale price
- Current annual tax
- $287 · $24/mo
- Projected year-2 tax
- $662 · $55/mo
- Expected delta
- +$375/yr (+$31/mo · 130.5%)
ⓘ Screening estimate from a state-policy table — verify with the county assessor before closing.
Climate risk First Street
- Flood 1/10 Low FEMA zone X (unshaded) · 0% chance over 30 yrs
- Wildfire 1/10 Low
- Heat 8/10 Severe 7 d/yr ≥108°F today · 18 d/yr by 30 yrs out
- Wind 6/10 Major 65% chance of damaging wind over 30 yrs
- Air quality 4/10 Moderate 5 unhealthy d/yr today · 5 by 30 yrs out
Nearby sold comps map
Loading sold comps map…
Walkable amenities ~0.75 mi
Loading nearby amenities…
Taxation est. · year 1
- Rental income
- $17,062
- − Mortgage interest
- −$4,033
- − Property taxes
- −$287
- − Insurance
- −$360
- − Repairs & maintenance
- −$1,365
- − Management
- −$1,365
- − Depreciation
- −$2,095
- Taxable income
- $7,557
- Est. tax owed @ 24.0%
- −$1,814
- After-tax cash flow
- $6,487/yr
For passive investors: Depreciation is non-cash, so a rental often shows a tax loss while cash-flowing — sheltering income. Rental losses are passive: they offset passive income freely, and up to $25,000/yr can offset ordinary (W-2) income if you actively participate and your MAGI is under $100k (phasing out to $0 by $150k); unused losses carry forward. On sale, claimed depreciation is recaptured at up to 25%, and gains may owe capital-gains tax (a 1031 exchange can defer both). Figures are a year-1 estimate at your 24.0% rate — not tax advice; consult a CPA.
Schools (NCES district)
- District
- Bibb County
- NCES district ID
- 1300420
- Math proficiency
- 11% ▼ -14.00%
- Reading proficiency
- 18% ▼ -11.00%
- Median HH income
- $37,426
- Composite
- 12.13/100
- National rank
- #9654
- State rank
- #161 of 174 in GA
Livability — Macon-Bibb County
No livability data for this city. (Only ~50 U.S. cities are tracked.)
Census & demographics
- Census place
- Macon-Bibb County, GA
- County
- Bibb County · 164,332 people
- City population
- 143,186
- Metro
- Macon-Bibb County, GA
- Population (ZIP)
- 7,891
- Household income
- $29,420
- Rent vs Own
- Severe rent burden
- 1124.0
Population outlook (Bibb County) Hauer SSP2
- Today (2025)
- 148,772 people
- By 2030
- 145,904 · -1.9%
- By 2040
- 139,404 · -6.3%
- By 2050
- 131,603 · -11.5%
- By 2075
- 111,050 · -25.4%
- By 2100
- 83,346 · -44.0%
Race, ethnicity, and origin ACS 2023
- Neighborhood character
- Diverse neighborhood (Simpson 0.55)
- Race & ethnicity
- Black 59% White 31% Hispanic / Latino 6% Two or more races 5% Asian 2%
- Hispanic origin (detail)
- Mexican 3% Puerto Rican 1%
- Common ancestry
- Slovak 2% Italian 1% Lithuanian 1%
- Foreign-born
- 4% · Canada
- Languages at home
- 92% English-only · Spanish 5% Other Indo-European 2% Chinese 1%
Political lean MEDSL · Bibb
- 2024 margin
- Strong D (+22.4) · D 61.0% · R 38.5%
- 2008→2024 swing
- +4.4pp toward D · 2008: 18.0pp · 2024: 22.4pp
- All cycles
- 2024: D+22.4 2020: D+23.8 2016: D+20.2 2012: D+20.0 2008: D+18.0
Not yet ingested
- Civics
- —
Market trends
- HPI YoY
- ▼ -142.32%
- Current HPI
- 100.04
- Rent YoY
- ▲ 3.11%
- Metro
- Macon-Bibb County, GA
- State GDP YoY
- ▲ 2.66%
- F500 in state
- 28
Industry mix (Fortune 500 HQ in GA)
| Industry | F500 HQs | Revenue |
|---|---|---|
| Paper / Packaging | 2 | $29B |
|
||
| Retail | 1 | $160B |
|
||
| Transportation / Logistics | 1 | $91B |
|
||
| Airlines | 1 | $62B |
|
||
| Consumer Goods | 1 | $47B |
|
||
| Utilities | 1 | $25B |
|
||
Price history
+260.0% since first listed18 events — show timeline
- 2025-09-25 Listed $72,000 GAMLS
- 2025-05-31 Listing Removed — GAMLS
- 2025-02-04 Relisted — GAMLS
- 2025-01-31 Listing Removed — GAMLS
- 2024-11-02 Price Changed $86,000 GAMLS
- 2024-05-30 Listing Removed — GAMLS
- 2024-05-07 Price Changed $90,000 GAMLS
- 2024-03-31 Listing Removed — GAMLS
- 2024-02-23 Listed $95,000 GAMLS
- 2024-02-23 Listed $95,000 GAMLS
- 2024-02-23 Listed $88,000 GAMLS
- 2022-09-23 Listing Removed — GAMLS
- 2022-03-23 Listed $120,000 GAMLS
- 2017-09-19 Sold (MLS) $12,000 MGMLS
- 2017-04-24 Listed $14,900 MGMLS
- 2003-12-22 Sold (Public Records) $12,800 Public Records
- 2001-11-01 Sold (Public Records) $25,000 Public Records
- 2001-08-01 Sold (Public Records) $20,000 Public Records
Property tax history
+0.2%/yrLatest (2025): $287 · -1.3% YoY. Source: county tax records.
Cash-flow waterfall
monthlySold comps — $/sqft
last 12 mo · ≤1 miLoading sold comps…