 Duplex
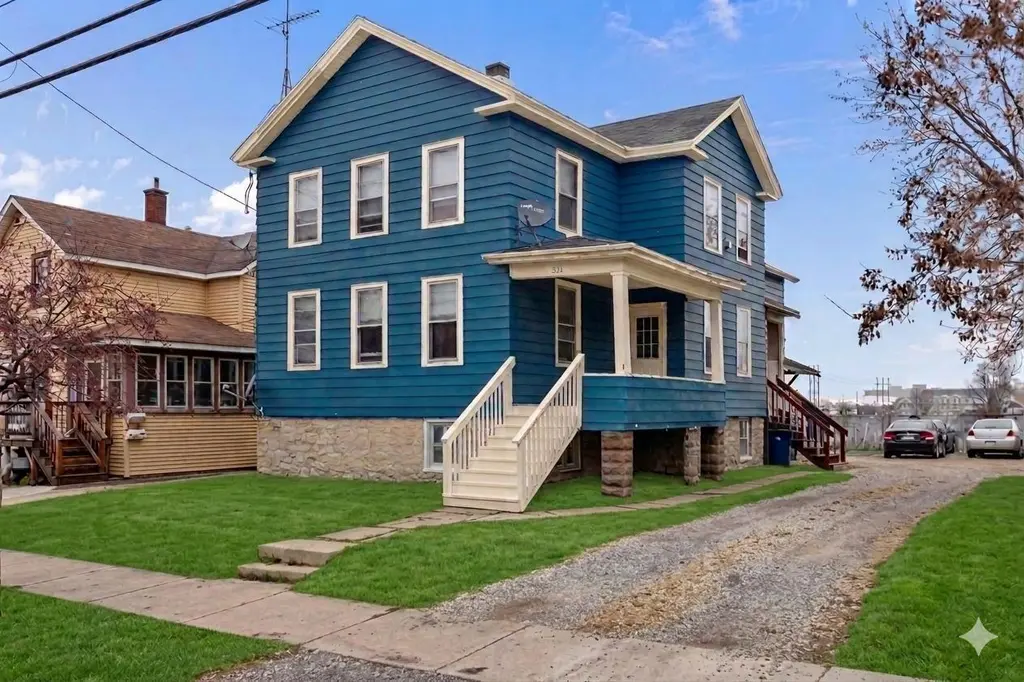
326 W 6th Ave · Oshkosh, WI
Flood risk 1/10 · Minimal
- FEMA flood zone
- X (shaded)
- Chance of flooding over 30 yrs
- 0.0%
- Est. flood insurance / yr
- $473 – $860
Fire risk 1/10 · Minimal
- Est. fire insurance / yr
- $636 – $1,182
Heat risk 2/10 · Minimal
- Hot days now (above 97°F)
- 7 days/yr
- Hot days in 30 yrs
- 13 days/yr
Wind risk 2/10 · Minimal
- Chance of severe wind over 30 yrs
- —
Air-quality risk 2/10 · Minimal
- Unhealthy air days now
- 1 days/yr
- Unhealthy air days in 30 yrs
- 2 days/yr
Risk factors via First Street. Map © Google.
Why this score? — see what drove the C grade
The composite is a weighted blend of 9 inputs, each scored 0–100. Each bar is that input's sub-score; the figure is the points it added to the 100-point composite (weight × sub-score).
- Cash flow +27.7/30.0
- DSCR +9.7/10.0
- 1% rule +8.2/10.0
- Livability +4.2/5.0
- Rent growth +3.2/5.0
- Schools +2.9/10.0
- Condition / age +2.5/5.0
- ARV discount +0.0/15.0
- Appreciation +0.0/10.0
$239,900
🖨 Deal sheet 📄 Offer letter ✓ Due diligence
Multi-family units
County records classify this as Multi-Family (2-4 Unit). Listing-text estimate: 2 units. confirmed
Listing remarks MLS
Fantastic south side up/down duplex with an established rental history. This well-maintained property features two spacious units, each with their own private entrance, offering excellent tenant privacy and appeal. Investors will love the strong rental history and consistent demand in this sought-after location. Situated just steps from the new hospital, this property benefits from a growing pool of healthcare professionals and staff seeking quality housing nearby. Convenient access to shopping, dining, and major commuter routes makes this an easy lease every time. Whether you're looking to expand your portfolio or offset your mortgage with rental income, this duplex checks all the boxes. Don't miss this turnkey income-producing opportunity in one of the area's most desirable corridors!
Key facts
- 6,534 sq ft lot
- Built 1874
- Listed 62 days
Neighborhood map
What this means for you Summary
Snapshot
- This is a 2 × 3-bed/1.0-bath units multifamily listed at $240k.
Deal economics
- At list price, monthly cash flow is $722 ($9k/yr) — positive. Per door: $361/mo.
- The deal already cash-flows at list — no discount required.
- Meets the 1% rule at list price ($3k rent vs $240k).
- Recommended offer: $226k (6.0% below list) — sets the bar for market timing.
- Cap rate 9.9% vs local median 3.7% in Oshkosh — top-decile yield for the area; either an underpriced asset or a hidden risk that comps aren't pricing in. Stress-test before assuming the spread holds.
Location & tenants
- Location reads 85/100 on livability (#29 in WI, #574 nationally) — a professional / high-income tenant draw. Strengths: cost of living A+, housing A+, health & safety A+.
- Oshkosh Area School District (urban): math 33% / reading 34% proficiency, ranked #246 of 342 in WI (top 72%) — families likely to look elsewhere, expect single-tenant / working-renter base with shorter leases.
- Market conditions: Rents rising (+2.6%/yr); 44 active listings in the ZIP; 652 units permitted in Winnebago County in 2024 (333 in 5+ unit buildings).
- At $3,157/mo this rent would consume 58% of the median local household income ($66k/yr) (locally 873% of renters already pay >50% of income on rent) — very limited rent-growth headroom before tenants either downsize or default.
Forward outlook
- Local home prices are declining (-3.0%/yr); year-one equity from $2k of loan paydown is wiped out by about $7k of value loss. Plan a longer hold.
- Winnebago County population projected at +3% by 2050 — modest demand growth; plan on rents tracking national, not racing it.
- At projected returns (-3.0% appreciation + 2.6% rent growth), your $67k cash investment doubles in ~10 years — after that, you're playing with house money.
Negotiation context
- It's been on market 63 days — a 6% lower offer ($226k) is reasonable based on typical stale-listing flexibility.
- 2 sale attempts since 2y ago with the ask held roughly flat each time — persistent listings suggest the price (not the market) is what's stuck; bring a comps-based counter.
- Current owner paid $65k; list at $240k implies a 269% gain — meaningful room to come down on a strong offer.
Risks & watch-outs
- Watch-outs: built in 1874 — expect roof / HVAC / electrical / plumbing capex.
Questions for the listing agent
- It's been on market 63 days. Have you received any prior offers? Is the seller open to a 6% concession, seller financing, or rate buy-down credit?
- Can we see the unit-by-unit rent roll, current vacancy, and any below-market leases? What's the average tenancy length?
- What capital expenditures (roof, boiler, parking lot, exteriors) have been made in the last 5 years, and what's planned in the next 2?
- Built in 1874 — when were the roof, HVAC, electrical panel, plumbing, and water heater last replaced?
- Why hasn't it sold? Are there any deal-killer items the seller is aware of (foundation, flood, title, zoning, code violations)?
- Is there a deadline driving the sale (1031 exchange, divorce, estate, relocation)? That informs how much negotiation room exists.
- What's the average days-on-market for RENTAL listings here right now (not sales)? A rising rental-DOM trend means longer vacancies and softer asking-rent achievability than the comps imply.
- What's the recent tenant-quality profile in this submarket — average credit score on applications, eviction rate, late-payment / NSF rate, and stable-employment percentage? A property-management company in the area should have these aggregated.
- How much new apartment / multifamily construction is in the pipeline within 1–3 miles? Heavy new supply (>2% of stock underway) typically softens rents 12–24 months out; light construction supports rent growth.
Investment metrics
- 1% rule
- 1.32% ✓
- Cap rate
- 9.90%
- Cash-on-cash
- 12.89%
- DSCR
- 1.57
- GRM
- 6.3
CMA / ARV
- ARV (median comp)
- $193,746
- List price
- $239,900
- Delta
- 23.82%
- Verdict
- OVERPRICED
- Comps
- 20 within 1.0 mi
Show comp detail 3 sales within ~0.75 mi
| Address | Dist | Beds/Ba | Sqft | Sold | Price | $/sf | Match |
|---|---|---|---|---|---|---|---|
| 1403 S Main St | 0.64mi | 6/2.0 (-1) | 2,458 (-3%) | 3mo | $240,000 | $98 | 58 |
| 311 W 16th Ave | 0.64mi | 6/2.0 (-1) | 2,397 (-6%) | 23mo | $220,000 | $92 | 37 |
| 815 W 10th Ave | 0.64mi | 6/2.0 (-1) | 2,155 (-15%) | 17mo | $215,000 | $100 | 26 |
Match score weights: distance 35% · size 25% · config 20% · recency 20%. Top-matched comps best support the ARV.
Projected returns pro-forma
-3.0% appreciation · 2.6% rent growth · sell at horizon
- IRR
- 2.3%
- Equity multiple
- 1.09×
- Total profit
- $5,940
- Equity at exit
- $35,770
- IRR
- 11.5%
- Equity multiple
- 1.89×
- Total profit
- $59,683
- Equity at exit
- $20,742
Cash invested: $67,172 (down + closing). Projections, not guarantees.
Landlord ↔ Tenant lean methodology
- Overall (STATE)
- 73 Landlord-Friendly
- State Wisconsin
- 73 Landlord-Friendly · R+2
- County
- — inherits STATE
- City
- — inherits STATE
ZIP-level market 54902
- Rents YoY
- 2.6%
- Active inventory
- 44
- Price-to-rent
- 12.7×
Monthly cashflow live
- Estimated rent
- $3,157 high interval (Pro) →
- Mortgage (P&I)
- −$1,258
- Tax from tax record
- −$414 /mo · $4,972/yr
- Insurance
- −$100
- HOA
- −$0
- Vacancy / Maint / Mgmt
- −$663
- Net cashflow
- $722
Break-even live
2-unit breakdown (identical units grouped — click to expand)
| Units | Beds | Baths | Est. rent |
|---|---|---|---|
| 2× units | 3 | 1 | $3,158 |
| #1 | 3 | 1 | $1,579 |
| #2 | 3 | 1 | $1,579 |
| Total (2 units) | $3,157 | ||
UW: 25.0% down · 7.5% · 30yr · 1.5% tax · 5.0% vac · 8.0% maint · 8.0% mgmt
Financing live
Cash to close
- Down payment
- $59,975
- Closing costs
- $7,197
- Reserves months
- —
- Total cash needed
- —
Loan-product check · same deal, 3 products live
Conventional
25% down · 7.5% · 30yr
- Down + closing
- —
- Monthly P&I
- —
- Monthly cashflow
- —
- DSCR
- —
- Eligible?
- —
Personal DTI + credit; lowest rate.
DSCR
20% down · 8.5% · 30yr
- Down + closing
- —
- Monthly P&I
- —
- Monthly cashflow
- —
- DSCR
- —
- Eligible?
- —
No personal income docs; deal must DSCR.
Hard money
10% down · 12.0% · 12mo
- Down + closing
- —
- Monthly P&I
- —
- Monthly cashflow
- —
- DSCR
- —
- Eligible?
- —
Short-term bridge; refi at stabilization.
Listing history 23 events
-
2026-06-19days on market $239,900 Active 63 DOM
-
2026-06-18days on market $239,900 Active 62 DOM
-
2026-06-17days on market $239,900 Active 61 DOM
-
2026-06-16days on market $239,900 Active 60 DOM
-
2026-06-15days on market $239,900 Active 59 DOM
-
2026-06-14days on market $239,900 Active 57 DOM
-
2026-06-13days on market $239,900 Active 56 DOM
-
2026-06-10days on market $239,900 Active 54 DOM
-
2026-06-09days on market $239,900 Active 53 DOM
-
2026-06-08days on market $239,900 Active 52 DOM
-
2026-06-07days on market $239,900 Active 51 DOM
-
2026-06-02days on market $239,900 Active 46 DOM
-
2026-06-01days on market $239,900 Active 45 DOM
-
2026-05-31days on market $239,900 Active 44 DOM
-
2026-05-30days on market $239,900 Active 43 DOM
-
2026-05-15price $239,900 797-char remark
Show marketing remark (797 chars)
Fantastic south side up/down duplex with an established rental history. This well-maintained property features two spacious units, each with their own private entrance, offering excellent tenant privacy and appeal. Investors will love the strong rental history and consistent demand in this sought-after location. Situated just steps from the new hospital, this property benefits from a growing pool of healthcare professionals and staff seeking quality housing nearby. Convenient access to shopping, dining, and major commuter routes makes this an easy lease every time. Whether you're looking to expand your portfolio or offset your mortgage with rental income, this duplex checks all the boxes. Don't miss this turnkey income-producing opportunity in one of the area's most desirable corridors!
-
2026-04-17$245,000 Active 797-char remark
Show marketing remark (797 chars)
Fantastic south side up/down duplex with an established rental history. This well-maintained property features two spacious units, each with their own private entrance, offering excellent tenant privacy and appeal. Investors will love the strong rental history and consistent demand in this sought-after location. Situated just steps from the new hospital, this property benefits from a growing pool of healthcare professionals and staff seeking quality housing nearby. Convenient access to shopping, dining, and major commuter routes makes this an easy lease every time. Whether you're looking to expand your portfolio or offset your mortgage with rental income, this duplex checks all the boxes. Don't miss this turnkey income-producing opportunity in one of the area's most desirable corridors!
-
2024-10-10historical $1,095
-
2024-09-14price $1,095
-
2024-08-13price $1,100
-
2024-08-09price $1,120
-
2024-06-14$1,125
-
2001-11-06soldstatus $65,000
ⓘ Source: listings_history table (triggers on properties + properties_extension) + one-shot
backfill from property_details.listing_events for pre-trigger history.
Tax reassessment forecast WI · Partial reset (capped growth)
- Current annual tax
- $4,972 · $414/mo
- Projected year-2 tax
- $4,972 · $414/mo
- Expected delta
- $0/yr ($0/mo · 0.0%)
ⓘ Screening estimate from a state-policy table — verify with the county assessor before closing.
Climate risk First Street
- Flood 1/10 Low FEMA zone X (shaded) · 0% chance over 30 yrs
- Wildfire 1/10 Low
- Heat 2/10 Low 7 d/yr ≥97°F today · 13 d/yr by 30 yrs out
- Wind 2/10 Low
- Air quality 2/10 Low 1 unhealthy d/yr today · 2 by 30 yrs out
Nearby sold comps map
Loading sold comps map…
Walkable amenities ~0.75 mi
Loading nearby amenities…
Taxation est. · year 1
- Rental income
- $37,884
- − Mortgage interest
- −$13,438
- − Property taxes
- −$4,972
- − Insurance
- −$1,200
- − Repairs & maintenance
- −$3,031
- − Management
- −$3,031
- − Depreciation
- −$6,979
- Taxable income
- $5,234
- Est. tax owed @ 24.0%
- −$1,256
- After-tax cash flow
- $7,404/yr
For passive investors: Depreciation is non-cash, so a rental often shows a tax loss while cash-flowing — sheltering income. Rental losses are passive: they offset passive income freely, and up to $25,000/yr can offset ordinary (W-2) income if you actively participate and your MAGI is under $100k (phasing out to $0 by $150k); unused losses carry forward. On sale, claimed depreciation is recaptured at up to 25%, and gains may owe capital-gains tax (a 1031 exchange can defer both). Figures are a year-1 estimate at your 24.0% rate — not tax advice; consult a CPA.
Schools (NCES district)
- District
- Oshkosh Area School District
- NCES district ID
- 5511190
- Math proficiency
- 33% ▼ -7.00%
- Reading proficiency
- 34% ▼ -2.00%
- Median HH income
- $48,048
- Composite
- 28.92/100
- National rank
- #6634
- State rank
- #246 of 342 in WI
Livability — Oshkosh
- Score
- 85/100
- State rank
- #29
- US rank
- #574
Category grades
Schools grade is shown separately in the Schools card above.
Census & demographics
- Census place
- Oshkosh, WI
- County
- Winnebago County · 155,689 people
- City population
- 81,810
- Metro
- Oshkosh-Neenah, WI
- Population (ZIP)
- 22,243
- Household income
- $65,612
- Rent vs Own
- Severe rent burden
- 873.0
Population outlook (Winnebago County) Hauer SSP2
- Today (2025)
- 175,480 people
- By 2030
- 177,928 · +1.4%
- By 2040
- 180,873 · +3.1%
- By 2050
- 181,302 · +3.3%
- By 2075
- 184,071 · +4.9%
- By 2100
- 175,932 · +0.3%
Race, ethnicity, and origin ACS 2023
- Neighborhood character
- Predominantly White (84%)
- Race & ethnicity
- White 84% Two or more races 7% Asian 4% Hispanic / Latino 3% Black 3%
- Common ancestry
- Romanian 6% Portuguese 4% Lithuanian 3%
- Foreign-born
- 2% · Canada, China
- Languages at home
- 95% English-only · Other Asian/Pacific 2% Spanish 2%
Political lean MEDSL · Winnebago
- 2024 margin
- Toss-up / Even · D 46.9% · R 51.7% · Other 1.4%
- 2008→2024 swing
- -16.4pp toward R · 2008: 11.7pp · 2024: -4.8pp
- All cycles
- 2024: R+4.8 2020: R+4.0 2016: R+7.4 2012: D+3.8 2008: D+11.7
Not yet ingested
- Civics
- —
Market trends
- HPI YoY
- ▼ -122.03%
- Current HPI
- 187.4917
- Rent YoY
- ▲ 2.60%
- Metro
- Oshkosh-Neenah, WI
- State GDP YoY
- ▲ 2.10%
- F500 in state
- 20
Industry mix (Fortune 500 HQ in WI)
| Industry | F500 HQs | Revenue |
|---|---|---|
| Industrial Machinery | 4 | $23B |
|
||
| Industrial Technology | 2 | $36B |
|
||
| Insurance | 1 | $36B |
|
||
| Professional Services | 1 | $19B |
|
||
| Utilities | 1 | $9B |
|
||
| Consumer Goods | 1 | $3B |
|
||
Price history
+269.1% since first listed8 events — show timeline
- 2026-05-15 Price Changed $239,900 RANW
- 2026-04-17 Listed $245,000 RANW
- 2024-10-10 Rental Removed $1,095 BUILDIUM
- 2024-09-14 Price Changed $1,095 BUILDIUM
- 2024-08-13 Price Changed $1,100 BUILDIUM
- 2024-08-09 Price Changed $1,120 BUILDIUM
- 2024-06-14 Listed for Rent $1,125 BUILDIUM
- 2001-11-06 Sold (Public Records) $65,000 Public Records
Property tax history
+8.1%/yrLatest (2024): $4,972 · +40.8% YoY. Source: county tax records.
Cash-flow waterfall
monthlySold comps — $/sqft
last 12 mo · ≤1 miLoading sold comps…