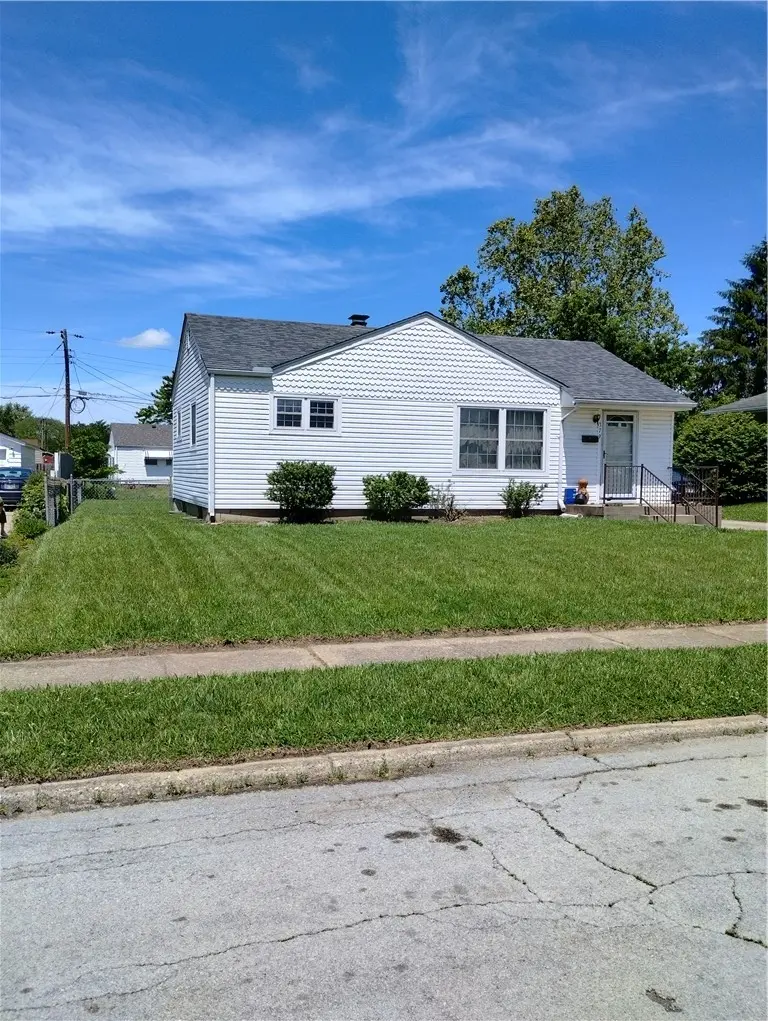
379 Trunk Dr · Riverside, OH
Flood risk 1/10 · Minimal
- FEMA flood zone
- X (unshaded)
- Chance of flooding over 30 yrs
- 0.0%
- Est. flood insurance / yr
- $473 – $860
Fire risk 1/10 · Minimal
- Est. fire insurance / yr
- $713 – $1,323
Heat risk 4/10 · Minor
- Hot days now (above 101°F)
- 7 days/yr
- Hot days in 30 yrs
- 18 days/yr
Wind risk 2/10 · Minimal
- Chance of severe wind over 30 yrs
- 0.0%
Air-quality risk 4/10 · Minor
- Unhealthy air days now
- 4 days/yr
- Unhealthy air days in 30 yrs
- 5 days/yr
Risk factors via First Street. Map © Google.
Why this score? — see what drove the C grade
The composite is a weighted blend of 9 inputs, each scored 0–100. Each bar is that input's sub-score; the figure is the points it added to the 100-point composite (weight × sub-score).
- Cash flow +19.5/30.0
- ARV discount +15.0/15.0
- DSCR +6.2/10.0
- 1% rule +5.0/10.0
- Rent growth +3.9/5.0
- Schools +3.5/10.0
- Livability +3.2/5.0
- Condition / age +2.5/5.0
- Appreciation +0.0/10.0
$149,900
🖨 Deal sheet 📄 Offer letter ✓ Due diligence
Key facts
- 7,405 sq ft lot
- Built 1954
- Listed 10 days
Property features AI
Finance
- Financial info: Offered for sale
Exterior
- Parking: No garage
- Utilities: Natural gas available
- Home design: Single-story home
- Construction: Aluminum and vinyl siding
- Exterior features: 61 x 120 x 63 x 120 lot dimensions; Approximately 0.17-acre lot; Waterfront lot
Interior
- Kitchen: Main-level kitchen (approx. 11 x 7)
- Bedrooms: Three bedrooms on the main level (approx. 12 x 10; 11 x 8; 10 x 10)
- Bathrooms: One full bathroom (on the main level)
- Heating & cooling: Natural gas heating; Central air conditioning
- Interior features: Full basement
Neighborhood map
What this means for you Summary
Snapshot
- This is a 3-bed/1.0-bath single-family listed at $150k.
Deal economics
- At list price, monthly cash flow is $170 ($2k/yr) — positive.
- The deal already cash-flows at list — no discount required.
- Meets the 1% rule at list price ($2k rent vs $150k).
- Cap rate 7.7% vs local median 4.9% in Riverside — top-decile yield for the area; either an underpriced asset or a hidden risk that comps aren't pricing in. Stress-test before assuming the spread holds.
Location & tenants
- Location reads 64/100 on livability (#775 in OH) — a middle-class / working-renter tenant base. Strengths: cost of living A+, housing A+; Watch: crime D+, employment D+, schools D.
- Mad River Local (suburban): math 34% / reading 50% proficiency, ranked #531 of 656 in OH (top 81%) — families likely to look elsewhere, expect single-tenant / working-renter base with shorter leases.
- Market conditions: Rents rising fast (+5.8%/yr); 124 active listings in the ZIP; 5 comparable units currently listed for rent nearby; rentals at typical pace (median 19d on market — plan ~3-4 weeks tenant-placement turnaround); solid renter incomes; 907 units permitted in Montgomery County in 2024 (416 in 5+ unit buildings).
Forward outlook
- Local home prices are declining (-3.0%/yr); year-one equity from $1k of loan paydown is wiped out by about $4k of value loss. Plan a longer hold.
- Montgomery County population projected at -10% by 2050 — secular population decline; favor cash flow + early exit over multi-decade hold.
Negotiation context
- Only 10 days on market — expect competitive offers; lowballing is unlikely to land.
- 3 sale attempts since 7y ago with the ask held roughly flat each time — persistent listings suggest the price (not the market) is what's stuck; bring a comps-based counter.
Risks & watch-outs
- Watch-outs: built in 1954 — expect roof / HVAC / electrical / plumbing capex.
Questions for the listing agent
- Built in 1954 — when were the roof, HVAC, electrical panel, plumbing, and water heater last replaced?
- Is there a deadline driving the sale (1031 exchange, divorce, estate, relocation)? That informs how much negotiation room exists.
- Schools are D-rated, which usually means shorter tenancies and higher turnover. Who's the typical renter profile here, and what's been the actual vacancy rate?
- Crime grade is D in this area — have there been break-ins, vandalism, or insurance claims at this property in the last 3 years? What carrier currently insures it and at what premium?
- What's the average days-on-market for RENTAL listings here right now (not sales)? A rising rental-DOM trend means longer vacancies and softer asking-rent achievability than the comps imply.
- What's the recent tenant-quality profile in this submarket — average credit score on applications, eviction rate, late-payment / NSF rate, and stable-employment percentage? A property-management company in the area should have these aggregated.
- How much new for-sale + rental construction is in the pipeline within 1–3 miles? Heavy new supply typically softens prices + rents 12–24 months out; constrained supply supports both.
Investment metrics
- 1% rule
- 1.00% ✓
- Cap rate
- 7.65%
- Cash-on-cash
- 4.86%
- DSCR
- 1.22
- GRM
- 8.3
CMA / ARV
- ARV (on-the-fly)
- $180,576
- Comps found
- 12
Show comp detail 12 sales within ~0.75 mi
| Address | Dist | Beds/Ba | Sqft | Sold | Price | $/sf | Match |
|---|---|---|---|---|---|---|---|
| 345 Murchison Ln | 0.07mi | 2/1.0 (-1) | 864 (0%) | 4mo | $95,000 | $110 | 88 |
| 372 Trunk Dr | 0.03mi | 2/1.0 (-1) | 768 (-11%) | 8mo | $159,900 | $208 | 69 |
| 456 Twinning Dr | 0.17mi | 3/1.0 | 988 (+14%) | 0mo | $203,000 | $205 | 68 |
| 329 Lawver Ln | 0.16mi | 3/2.0 | 988 (+14%) | 6mo | $209,950 | $213 | 60 |
| 320 Spinning Rd | 0.19mi | 3/1.0 | 988 (+14%) | 10mo | $190,000 | $192 | 59 |
| 484 Danforth Pl | 0.20mi | 3/2.0 | 988 (+14%) | 6mo | $215,000 | $218 | 58 |
| 488 Spinning Rd | 0.26mi | 3/1.0 | 988 (+14%) | 8mo | $193,000 | $195 | 58 |
| 221 Duffy Ct | 0.32mi | 3/2.0 | 988 (+14%) | 4mo | $220,000 | $223 | 54 |
| 395 Dundee Cir | 0.28mi | 3/1.5 | 988 (+14%) | 9mo | $215,000 | $218 | 54 |
| 5234 Flamingo Ct | 0.59mi | 3/1.0 | 972 (+12%) | 5mo | $200,000 | $206 | 47 |
| 750 Harlan Pl | 0.70mi | 3/1.0 | 972 (+12%) | 1mo | $203,000 | $209 | 46 |
| 715 Harlan Pl | 0.68mi | 3/2.0 | 972 (+12%) | 9mo | $230,000 | $237 | 36 |
Match score weights: distance 35% · size 25% · config 20% · recency 20%. Top-matched comps best support the ARV.
Projected returns pro-forma
-3.0% appreciation · 5.79% rent growth · sell at horizon
- IRR
- -5.7%
- Equity multiple
- 0.78×
- Total profit
- $-9,106
- Equity at exit
- $22,351
- IRR
- 7.0%
- Equity multiple
- 1.59×
- Total profit
- $24,944
- Equity at exit
- $12,961
Cash invested: $41,972 (down + closing). Projections, not guarantees.
Landlord ↔ Tenant lean methodology
- Overall (STATE)
- 73 Landlord-Friendly
- State Ohio
- 73 Landlord-Friendly · R+6
- County
- — inherits STATE
- City
- — inherits STATE
ZIP-level market 45431
- Home prices YoY
- -35.0%
- Rents YoY
- 5.8%
- Active inventory
- 124
- Price-to-rent
- 8.3×
Monthly cashflow live
- Estimated rent
- $1,506 high interval (Pro) →
- Mortgage (P&I)
- −$786
- Tax from tax record
- −$171 /mo · $2,052/yr
- Insurance
- −$62
- HOA
- −$0
- Vacancy / Maint / Mgmt
- −$316
- Net cashflow
- $170
Break-even live
UW: 25.0% down · 7.5% · 30yr · 1.5% tax · 5.0% vac · 8.0% maint · 8.0% mgmt
Financing live
Cash to close
- Down payment
- $37,475
- Closing costs
- $4,497
- Reserves months
- —
- Total cash needed
- —
Loan-product check · same deal, 3 products live
Conventional
25% down · 7.5% · 30yr
- Down + closing
- —
- Monthly P&I
- —
- Monthly cashflow
- —
- DSCR
- —
- Eligible?
- —
Personal DTI + credit; lowest rate.
DSCR
20% down · 8.5% · 30yr
- Down + closing
- —
- Monthly P&I
- —
- Monthly cashflow
- —
- DSCR
- —
- Eligible?
- —
No personal income docs; deal must DSCR.
Hard money
10% down · 12.0% · 12mo
- Down + closing
- —
- Monthly P&I
- —
- Monthly cashflow
- —
- DSCR
- —
- Eligible?
- —
Short-term bridge; refi at stabilization.
Rent comps 5 comps
| Address | Beds | Baths | Sqft | Rent | $/sqft | DOM | Units | Dist |
|---|---|---|---|---|---|---|---|---|
| 5713 Mayville Dr Dayton, OH | 4.0 | 2.0 | 1046 | $2,000 | $1.91 | 18d | 1 | 1.09mi |
| 4644 Burkhardt Ave Dayton, OH | 1.0–2.0 | 1.0 | 725 | $1,095 | $1.51 | 2d | 9 | 1.41mi |
| 1501 Rausch Ave Dayton, OH | 2.0 | 1.0 | 865 | $800 | $0.92 | 23d | 1 | 1.48mi |
| 1517 Rausch Ave Apt 4 Dayton, OH | 2.0 | 1.0 | 950 | $950 | $1.00 | 2d | 1 | 1.50mi |
| 1517 Rausch Ave Dayton, OH | 2.0 | 1.0 | 950 | $950 | $1.00 | 43d | 1 | 1.50mi |
Listing history 7 events
-
2026-06-18days on market $149,900 Active 10 DOM
-
2026-06-17days on market $149,900 Active 9 DOM
-
2026-06-16days on market $149,900 Active 8 DOM
-
2026-06-15days on market $149,900 Active 7 DOM
-
2026-06-14days on market $149,900 Active 5 DOM
-
2026-06-10days on market $149,900 Active 2 DOM
-
2026-06-09$149,900 Active 1 DOM
ⓘ Source: listings_history table (triggers on properties + properties_extension) + one-shot
backfill from property_details.listing_events for pre-trigger history.
Tax reassessment forecast OH · Partial reset (capped growth)
- Current annual tax
- $2,052 · $171/mo
- Projected year-2 tax
- $2,195 · $183/mo
- Expected delta
- +$143/yr (+$12/mo · 7.0%)
ⓘ Screening estimate from a state-policy table — verify with the county assessor before closing.
Climate risk First Street
- Flood 1/10 Low FEMA zone X (unshaded) · 0% chance over 30 yrs
- Wildfire 1/10 Low
- Heat 4/10 Moderate 7 d/yr ≥101°F today · 18 d/yr by 30 yrs out
- Wind 2/10 Low 0% chance of damaging wind over 30 yrs
- Air quality 4/10 Moderate 4 unhealthy d/yr today · 5 by 30 yrs out
Nearby sold comps map
Loading sold comps map…
Walkable amenities ~0.75 mi
Loading nearby amenities…
Taxation est. · year 1
- Rental income
- $18,069
- − Mortgage interest
- −$8,397
- − Property taxes
- −$2,052
- − Insurance
- −$750
- − Repairs & maintenance
- −$1,446
- − Management
- −$1,446
- − Depreciation
- −$4,361
- Taxable loss
- −$381
- Est. tax savings @ 24.0%
- +$91
- After-tax cash flow
- $2,131/yr
For passive investors: Depreciation is non-cash, so a rental often shows a tax loss while cash-flowing — sheltering income. Rental losses are passive: they offset passive income freely, and up to $25,000/yr can offset ordinary (W-2) income if you actively participate and your MAGI is under $100k (phasing out to $0 by $150k); unused losses carry forward. On sale, claimed depreciation is recaptured at up to 25%, and gains may owe capital-gains tax (a 1031 exchange can defer both). Figures are a year-1 estimate at your 24.0% rate — not tax advice; consult a CPA.
Schools (NCES district)
- District
- Mad River Local
- NCES district ID
- 3904870
- Math proficiency
- 34% ▼ -23.00%
- Reading proficiency
- 50% ▼ -8.00%
- Median HH income
- $41,560
- Composite
- 35.28/100
- National rank
- #4972
- State rank
- #531 of 656 in OH
Livability — Riverside
- Score
- 64/100
- State rank
- #775
- US rank
- #14045
Category grades
Schools grade is shown separately in the Schools card above.
Census & demographics
- Census place
- Riverside, OH
- County
- Greene County · 132,120 people
- Metro
- Dayton-Kettering, OH
- Population (ZIP)
- 27,951
- Household income
- $83,175
- Rent vs Own
- Severe rent burden
- 622.0
Population outlook (Montgomery County) Hauer SSP2
- Today (2025)
- 523,241 people
- By 2030
- 514,948 · -1.6%
- By 2040
- 493,378 · -5.7%
- By 2050
- 469,639 · -10.2%
- By 2075
- 418,360 · -20.0%
- By 2100
- 353,315 · -32.5%
Race, ethnicity, and origin ACS 2023
- Neighborhood character
- Predominantly White (78%)
- Race & ethnicity
- White 78% Two or more races 8% Hispanic / Latino 6% Asian 5% Black 4%
- Hispanic origin (detail)
- Mexican 1% Puerto Rican 2%
- Common ancestry
- Italian 3% Slovak 2% Lithuanian 2%
- Foreign-born
- 6% · South Korea, Canada, Jamaica
- Languages at home
- 92% English-only · Spanish 3% Other Indo-European 2% Korean 1%
Political lean MEDSL · Montgomery
- 2024 margin
- Toss-up / Even · D 49.8% · R 49.3%
- 2008→2024 swing
- -5.8pp toward R · 2008: 6.2pp · 2024: 0.5pp
- All cycles
- 2024: D+0.5 2020: D+2.2 2016: R+1.2 2012: D+3.1 2008: D+6.2
Not yet ingested
- Civics
- —
Market trends
- HPI YoY
- ▼ -148.58%
- Current HPI
- 276.444
- Rent YoY
- ▲ 5.79%
- Metro
- Dayton-Kettering, OH
- State GDP YoY
- ▲ 1.98%
- F500 in state
- 48
Industry mix (Fortune 500 HQ in OH)
| Industry | F500 HQs | Revenue |
|---|---|---|
| Insurance | 3 | $145B |
|
||
| Industrial Machinery | 3 | $49B |
|
||
| Financial Services | 3 | $24B |
|
||
| Consumer Goods | 2 | $93B |
|
||
| Aerospace / Defense | 2 | $47B |
|
||
| Utilities | 2 | $33B |
|
||
Price history
+87.6% since first listed7 events — show timeline
- 2026-06-08 Listed $149,900 Dayton MLS
- 2022-03-07 Listing Removed — Dayton MLS
- 2022-03-07 Pending — Dayton MLS
- 2022-02-17 Contingent — Dayton MLS
- 2021-11-30 Listed $99,000 Dayton MLS
- 2020-01-29 Listing Removed — Dayton MLS
- 2019-11-06 Listed $79,900 Dayton MLS
Property tax history
+6.7%/yrLatest (2025): $2,052 · +9.4% YoY. Source: county tax records.
Cash-flow waterfall
monthlySold comps — $/sqft
last 12 mo · ≤1 miLoading sold comps…