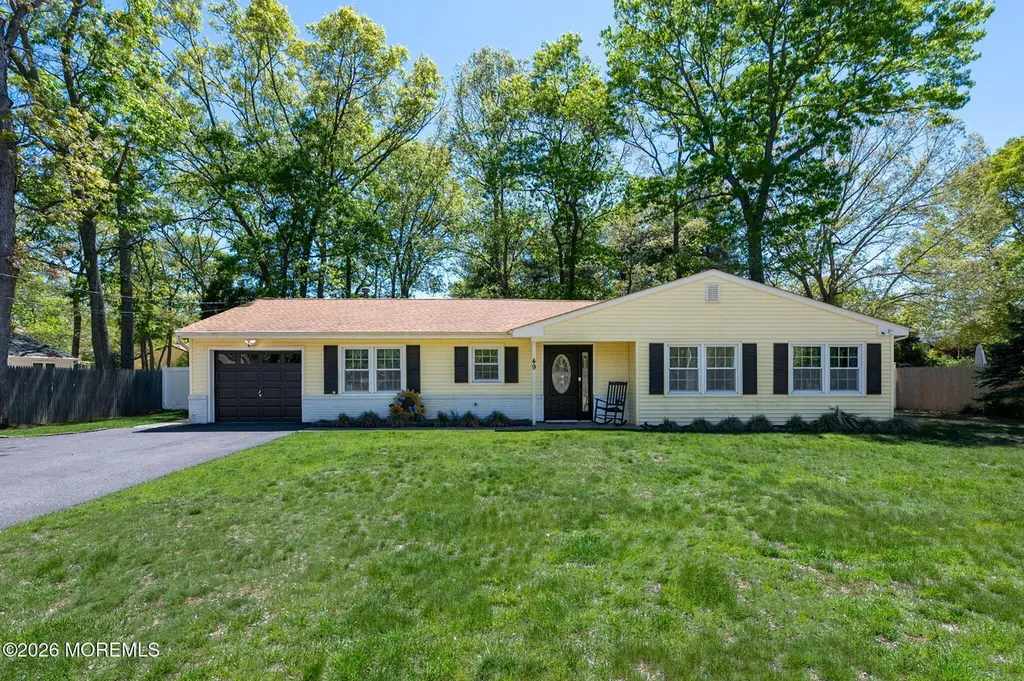
49 Haines St · Forked River, NJ
Flood risk 1/10 · Minimal
- FEMA flood zone
- X (unshaded)
- Chance of flooding over 30 yrs
- 0.0%
- Est. flood insurance / yr
- $507 – $1,088
Fire risk 2/10 · Minimal
- Est. fire insurance / yr
- $526 – $976
Heat risk 7/10 · Major
- Hot days now (above 99°F)
- 7 days/yr
- Hot days in 30 yrs
- 15 days/yr
Wind risk 7/10 · Major
- Chance of severe wind over 30 yrs
- 78.0%
Air-quality risk 3/10 · Minor
- Unhealthy air days now
- 3 days/yr
- Unhealthy air days in 30 yrs
- 3 days/yr
Risk factors via First Street. Map © Google.
Why this score? — see what drove the B grade
The composite is a weighted blend of 9 inputs, each scored 0–100. Each bar is that input's sub-score; the figure is the points it added to the 100-point composite (weight × sub-score).
- Cash flow +30.0/30.0
- ARV discount +10.9/15.0
- 1% rule +10.0/10.0
- DSCR +10.0/10.0
- Livability +3.1/5.0
- Schools +3.0/10.0
- Rent growth +2.5/5.0
- Condition / age +2.5/5.0
- Appreciation +0.0/10.0
$419,900
🖨 Deal sheet 📄 Offer letter ✓ Due diligence
Listing remarks MLS
JUST REDUCED!!! PRISTINE, SPACIOUS 3 BEDROOM RANCH ON AN OVERSIZED 100X 162 LOT. ENJOY THE PARK LIKE SETTINGS OF THE BACK YARD.
Key facts
- Stone countertops
- Updated kitchen
- Center island
Tags
Property features AI
Exterior
- Parking: Attached 1-car garage
- Utilities: Public sewer
- Home design: Fee simple ownership
- Construction: Crawl space basement
- Exterior features: Timberline roof
Interior
- Kitchen: Microwave; Stove; Refrigerator
- Bedrooms: Three bedrooms on the first floor
- Flooring: Ceramic tile
- Bathrooms: One full bathroom
- Heating & cooling: Forced air heating; Central air conditioning
- Interior features: Includes washer, dryer, microwave, stove and refrigerator; Wood-burning fireplace (1)
- Laundry & utility: Washer and dryer included
Neighborhood map
What this means for you Summary
Snapshot
- This is a 3-bed/1.0-bath single-family listed at $420k.
Deal economics
- At list price, monthly cash flow is $2k ($28k/yr) — positive.
- The deal already cash-flows at list — no discount required.
- Meets the 1% rule at list price ($7k rent vs $420k).
- Cap rate 12.9% vs local median 3.2% in Forked River — top-decile yield for the area; either an underpriced asset or a hidden risk that comps aren't pricing in. Stress-test before assuming the spread holds.
Location & tenants
- Location reads 61/100 on livability (#464 in NJ) — a middle-class / working-renter tenant base. Strengths: housing A+, crime A-, employment A-; Watch: amenities F, commute F, cost of living F.
- Lacey Township School District (suburban): math 22% / reading 43% proficiency, ranked #299 of 472 in NJ (top 63%) — families likely to look elsewhere, expect single-tenant / working-renter base with shorter leases; only 19% free/reduced lunch — higher-income household profile.
- Market conditions: 57 active listings in the ZIP; 3 comparable units currently listed for rent nearby; rentals at typical pace (median 21d on market — plan ~3-4 weeks tenant-placement turnaround); 4,434 units permitted in Ocean County in 2024 (868 in 5+ unit buildings).
Forward outlook
- Local home prices are declining (-3.0%/yr); year-one equity from $3k of loan paydown is wiped out by about $13k of value loss. Plan a longer hold.
- Ocean County population projected to shrink 8% by 2050 — rents likely to lag national; underwrite the cash flow, not the appreciation.
- At projected returns (-3.0% appreciation + 3.0% rent growth), your $118k cash investment doubles in ~6 years — after that, you're playing with house money.
Negotiation context
- Only 2 days on market — expect competitive offers; lowballing is unlikely to land.
- 4 sale attempts since 21y ago with the ask held roughly flat each time — persistent listings suggest the price (not the market) is what's stuck; bring a comps-based counter.
- Current owner paid $238k; list at $420k implies a 76% gain — meaningful room to come down on a strong offer.
Risks & watch-outs
- Climate carrying-cost: major wind risk, 78% chance of damaging wind over 30y; extreme-heat days projected 7→15/yr by 2055 (HVAC capex compounding) — expect insurance premiums to compound above CPI over the hold.
Questions for the listing agent
- Built in 1973 — when were the roof, HVAC, electrical panel, plumbing, and water heater last replaced?
- Is there a deadline driving the sale (1031 exchange, divorce, estate, relocation)? That informs how much negotiation room exists.
- What's the average days-on-market for RENTAL listings here right now (not sales)? A rising rental-DOM trend means longer vacancies and softer asking-rent achievability than the comps imply.
- What's the recent tenant-quality profile in this submarket — average credit score on applications, eviction rate, late-payment / NSF rate, and stable-employment percentage? A property-management company in the area should have these aggregated.
- How much new for-sale + rental construction is in the pipeline within 1–3 miles? Heavy new supply typically softens prices + rents 12–24 months out; constrained supply supports both.
Investment metrics
- 1% rule
- 1.56% ✓
- Cap rate
- 12.94%
- Cash-on-cash
- 23.73%
- DSCR
- 2.06
- GRM
- 5.4
CMA / ARV
- ARV (on-the-fly)
- $454,572
- Comps found
- 10
Show comp detail 10 sales within ~0.75 mi
| Address | Dist | Beds/Ba | Sqft | Sold | Price | $/sf | Match |
|---|---|---|---|---|---|---|---|
| 560 Oakhollow Ln | 0.30mi | 3/1.0 | 1,446 (+3%) | 12mo | $430,000 | $297 | 71 |
| 446 Steuben Ave | 0.38mi | 3/1.5 | 1,496 (+7%) | 10mo | $485,000 | $324 | 61 |
| 503 Buttonwood Dr | 0.74mi | 3/2.0 | 1,467 (+5%) | 1mo | $465,000 | $317 | 53 |
| 412 Steuben Ave | 0.58mi | 3/2.0 | 1,484 (+6%) | 10mo | $625,000 | $421 | 51 |
| 438 Carr St | 0.45mi | 3/2.0 | 1,496 (+7%) | 17mo | $385,000 | $257 | 50 |
| 20 Bayberry Dr | 0.61mi | 3/2.0 | 1,517 (+8%) | 6mo | $485,000 | $320 | 49 |
| 28 Bayberry Dr | 0.65mi | 3/2.0 | 1,566 (+12%) | 5mo | $510,000 | $326 | 42 |
| 732 Oak Rd | 0.69mi | 3/1.5 | 1,317 (-6%) | 22mo | $440,000 | $334 | 37 |
| 16 Bayberry Dr | 0.58mi | 2/1.0 (-1) | 1,203 (-14%) | 10mo | $395,000 | $328 | 36 |
| 375 Constitution Dr | 0.72mi | 4/2.0 (+1) | 1,538 (+10%) | 22mo | $450,000 | $293 | 23 |
Match score weights: distance 35% · size 25% · config 20% · recency 20%. Top-matched comps best support the ARV.
Projected returns pro-forma
-3.0% appreciation · 3.0% rent growth · sell at horizon
- IRR
- 16.9%
- Equity multiple
- 1.68×
- Total profit
- $80,107
- Equity at exit
- $62,608
- IRR
- 25.4%
- Equity multiple
- 3.22×
- Total profit
- $260,685
- Equity at exit
- $36,305
Cash invested: $117,572 (down + closing). Projections, not guarantees.
Landlord ↔ Tenant lean methodology
- Overall (STATE)
- 21 Tenant-Leaning
- State New Jersey
- 21 Tenant-Leaning · D+6
- County
- — inherits STATE
- City
- — inherits STATE
ZIP-level market 08734
- Active inventory
- 57
- Price-to-rent
- 5.4×
Monthly cashflow live
- Estimated rent
- $6,535 medium interval (Pro) →
- Mortgage (P&I)
- −$2,202
- Tax from tax record
- −$460 /mo · $5,525/yr
- Insurance
- −$175
- HOA
- −$0
- Vacancy / Maint / Mgmt
- −$1,372
- Net cashflow
- $2,325
Break-even live
UW: 25.0% down · 7.5% · 30yr · 1.5% tax · 5.0% vac · 8.0% maint · 8.0% mgmt
Financing live
Cash to close
- Down payment
- $104,975
- Closing costs
- $12,597
- Reserves months
- —
- Total cash needed
- —
Loan-product check · same deal, 3 products live
Conventional
25% down · 7.5% · 30yr
- Down + closing
- —
- Monthly P&I
- —
- Monthly cashflow
- —
- DSCR
- —
- Eligible?
- —
Personal DTI + credit; lowest rate.
DSCR
20% down · 8.5% · 30yr
- Down + closing
- —
- Monthly P&I
- —
- Monthly cashflow
- —
- DSCR
- —
- Eligible?
- —
No personal income docs; deal must DSCR.
Hard money
10% down · 12.0% · 12mo
- Down + closing
- —
- Monthly P&I
- —
- Monthly cashflow
- —
- DSCR
- —
- Eligible?
- —
Short-term bridge; refi at stabilization.
Rent comps 3 comps
| Address | Beds | Baths | Sqft | Rent | $/sqft | DOM | Units | Dist |
|---|---|---|---|---|---|---|---|---|
| 209 Sinclair Ave Lanoka Harbor, NJ | 3.0 | 1.0 | 1352 | $3,300 | $2.44 | 20d | 1 | 1.28mi |
| 209 Sinclair Ave Lanoka Harbor, NJ | 3.0 | 1.0 | 1352 | $3,000 | $2.22 | 43d | 1 | 1.28mi |
| 406 Lawrence Dr Lanoka Harbor, NJ | 3.0 | 2.0 | 1836 | $16,000 | $8.71 | 1d | 1 | 1.42mi |
Listing history 10 events
-
2026-05-27status Pending
-
2026-05-13$419,900 Active
-
2025-03-01historical $3,000
-
2025-02-05$3,000
-
2021-05-10soldstatus $238,500
-
2017-09-28historical
-
2017-08-04$259,900 Active
-
2005-08-30soldstatus $276,000
-
2005-08-24soldstatus $276,000 127-char remark
Show marketing remark (127 chars)
JUST REDUCED!!! PRISTINE, SPACIOUS 3 BEDROOM RANCH ON AN OVERSIZED 100X 162 LOT. ENJOY THE PARK LIKE SETTINGS OF THE BACK YARD.
-
2005-05-25$279,000 127-char remark
Show marketing remark (127 chars)
JUST REDUCED!!! PRISTINE, SPACIOUS 3 BEDROOM RANCH ON AN OVERSIZED 100X 162 LOT. ENJOY THE PARK LIKE SETTINGS OF THE BACK YARD.
ⓘ Source: listings_history table (triggers on properties + properties_extension) + one-shot
backfill from property_details.listing_events for pre-trigger history.
Tax reassessment forecast NJ · Partial reset (capped growth)
- Current annual tax
- $5,525 · $460/mo
- Projected year-2 tax
- $7,990 · $666/mo
- Expected delta
- +$2,465/yr (+$205/mo · 44.6%)
ⓘ Screening estimate from a state-policy table — verify with the county assessor before closing.
Climate risk First Street
- Flood 1/10 Low FEMA zone X (unshaded) · 0% chance over 30 yrs
- Wildfire 2/10 Low
- Heat 7/10 Severe 7 d/yr ≥99°F today · 15 d/yr by 30 yrs out
- Wind 7/10 Severe 78% chance of damaging wind over 30 yrs
- Air quality 3/10 Moderate 3 unhealthy d/yr today · 3 by 30 yrs out
Nearby sold comps map
Loading sold comps map…
Walkable amenities ~0.75 mi
Loading nearby amenities…
Taxation est. · year 1
- Rental income
- $78,418
- − Mortgage interest
- −$23,521
- − Property taxes
- −$5,525
- − Insurance
- −$2,100
- − Repairs & maintenance
- −$6,273
- − Management
- −$6,273
- − Depreciation
- −$12,215
- Taxable income
- $22,510
- Est. tax owed @ 24.0%
- −$5,403
- After-tax cash flow
- $22,499/yr
For passive investors: Depreciation is non-cash, so a rental often shows a tax loss while cash-flowing — sheltering income. Rental losses are passive: they offset passive income freely, and up to $25,000/yr can offset ordinary (W-2) income if you actively participate and your MAGI is under $100k (phasing out to $0 by $150k); unused losses carry forward. On sale, claimed depreciation is recaptured at up to 25%, and gains may owe capital-gains tax (a 1031 exchange can defer both). Figures are a year-1 estimate at your 24.0% rate — not tax advice; consult a CPA.
Schools (NCES district)
- District
- Lacey Township School District
- NCES district ID
- 3408100
- Math proficiency
- 22% ▼ -18.00%
- Reading proficiency
- 43% ▼ -11.00%
- Median HH income
- $73,331
- Composite
- 30.42/100
- National rank
- #6242
- State rank
- #299 of 472 in NJ
Livability — Forked River
- Score
- 61/100
- State rank
- #464
- US rank
- #17753
Category grades
Schools grade is shown separately in the Schools card above.
Census & demographics
- Population (ZIP)
- 8,028
Population outlook (Ocean County) Hauer SSP2
- Today (2025)
- 586,991 people
- By 2030
- 581,403 · -1.0%
- By 2040
- 564,913 · -3.8%
- By 2050
- 538,149 · -8.3%
- By 2075
- 468,845 · -20.1%
- By 2100
- 350,297 · -40.3%
Race, ethnicity, and origin ACS 2023
- Neighborhood character
- Predominantly White (93%)
- Race & ethnicity
- White 93% Hispanic / Latino 5% Two or more races 3%
- Common ancestry
- Romanian 7% Subsaharan African 3% Slovak 3%
- Foreign-born
- 2% · Canada
- Languages at home
- 98% English-only · Spanish 1%
Political lean MEDSL · Ocean
- 2024 margin
- Solid R (+36.0) · D 31.4% · R 67.4% · Other 1.2%
- 2008→2024 swing
- -17.6pp toward R · 2008: -18.4pp · 2024: -36.0pp
- All cycles
- 2024: R+36.0 2020: R+28.7 2016: R+34.0 2012: R+17.7 2008: R+18.4
Not yet ingested
- Civics
- —
Market trends
- HPI YoY
- ▼ -225.83%
- Current HPI
- 368.8557
- Rent YoY
- —
- Metro
- —
- State GDP YoY
- ▲ 2.05%
- F500 in state
- 34
Industry mix (Fortune 500 HQ in NJ)
| Industry | F500 HQs | Revenue |
|---|---|---|
| Consumer Goods | 3 | $31B |
|
||
| Pharmaceuticals | 2 | $153B |
|
||
| Technology | 2 | $21B |
|
||
| Insurance | 2 | $20B |
|
||
| Healthcare | 2 | $19B |
|
||
| Financial Services | 1 | $70B |
|
||
Price history
+50.5% since first listed10 events — show timeline
- 2026-05-27 Pending — MOMLS
- 2026-05-13 Listed $419,900 MOMLS
- 2025-03-01 Rental Removed $3,000 APPFOLIO
- 2025-02-05 Listed for Rent $3,000 APPFOLIO
- 2021-05-10 Sold (Public Records) $238,500 Public Records
- 2017-09-28 Listing Removed — BRIGHT MLS
- 2017-08-04 Listed $259,900 BRIGHT MLS
- 2005-08-30 Sold (Public Records) $276,000 Public Records
- 2005-08-24 Sold (MLS) $276,000 BRIGHT MLS
- 2005-05-25 Listed $279,000 BRIGHT MLS
Property tax history
+2.9%/yrLatest (2025): $5,525 · +7.9% YoY. Source: county tax records.
Cash-flow waterfall
monthlySold comps — $/sqft
last 12 mo · ≤1 miLoading sold comps…