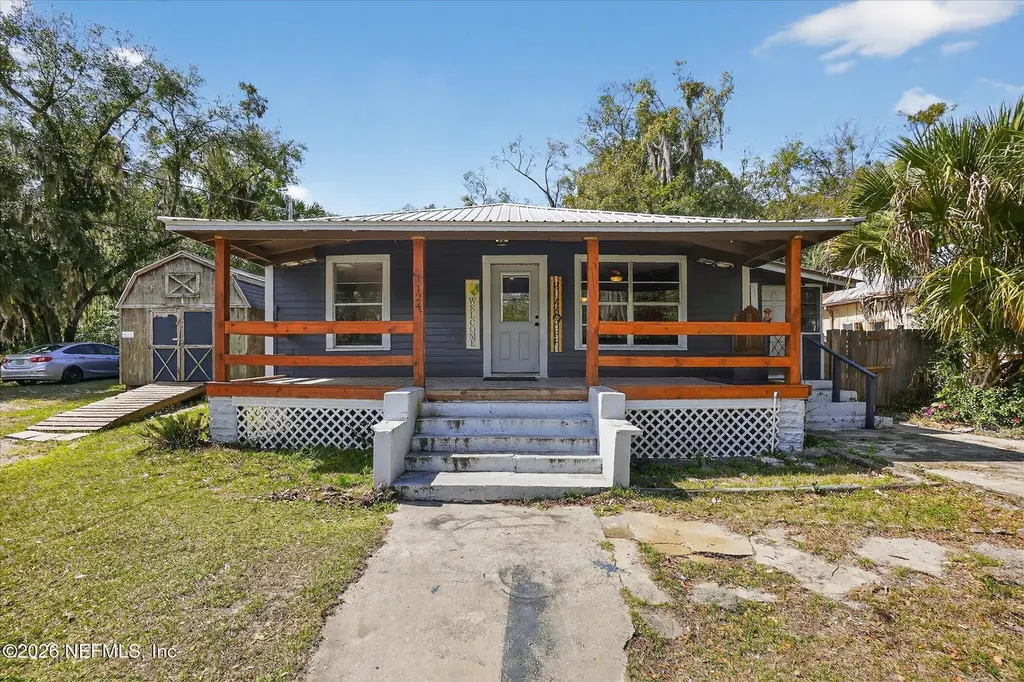
1124 S 12th St · Palatka, FL
Flood risk 1/10 · Minimal
- FEMA flood zone
- X (unshaded)
- Chance of flooding over 30 yrs
- 0.0%
- Est. flood insurance / yr
- $507 – $1,088
Fire risk 4/10 · Minor
- Est. fire insurance / yr
- $947 – $1,759
Heat risk 9/10 · Severe
- Hot days now (above 108°F)
- 7 days/yr
- Hot days in 30 yrs
- 20 days/yr
Wind risk 9/10 · Severe
- Chance of severe wind over 30 yrs
- 99.0%
Air-quality risk 2/10 · Minimal
- Unhealthy air days now
- 2 days/yr
- Unhealthy air days in 30 yrs
- 2 days/yr
Risk factors via First Street. Map © Google.
Why this score? — see what drove the C grade
The composite is a weighted blend of 9 inputs, each scored 0–100. Each bar is that input's sub-score; the figure is the points it added to the 100-point composite (weight × sub-score).
- Cash flow +18.4/30.0
- ARV discount +15.0/15.0
- DSCR +5.8/10.0
- 1% rule +4.7/10.0
- Rent growth +3.1/5.0
- Schools +3.0/10.0
- Livability +2.9/5.0
- Condition / age +2.5/5.0
- Appreciation +0.0/10.0
$150,000
🖨 Deal sheet 📄 Offer letter ✓ Due diligence
Listing remarks MLS
Tucked away on a dead-end street, this 2-bedroom, 1-bath home offers a comfortable layout with tall ceilings and a convenient location just minutes from downtown Palatka, shopping, dining, the fishing dock/boat ramp, Ravine Gardens State Park, and the Palatka Golf Club. Inside, you'll find brand-new LVP flooring throughout, custom maple shelving, freshly conditioned butcher block countertops, a tiled shower, and a custom floating walnut vanity. The heated and cooled Florida sunroom provides flexible additional space and can be used as a third bedroom, office, or bonus room. Major system updates provide added peace of mind, including a metal roof installed in 2021, water heater in 2024, and HVAC replacement in 2025. Outside, enjoy the large front porch, spacious backyard, and large storage shed.
Key facts
- Spacious backyard
- Large front porch
- Tiled shower
Tags
Property features AI
Finance
- HOA & community: Not a senior community
Exterior
- Parking: Off-street parking
- Utilities: Electricity connected; Sewer connected; Water connected
- Home design: Single family residence; Residential use
- Exterior features: East-facing; Lot approximately 0.17 acres
Interior
- Kitchen: Electric range; Refrigerator
- Bedrooms: Three bedrooms
- Bathrooms: One full bathroom
- Heating & cooling: Central heating; Central air conditioning
- Interior features: Six total rooms; Family room
- Laundry & utility: Stacked washer and dryer
Neighborhood map
What this means for you Summary
Snapshot
- This is a 2-bed/1.0-bath single-family listed at $150k.
Deal economics
- At list price, monthly cash flow is $139 ($2k/yr) — positive.
- The deal already cash-flows at list — no discount required.
- To meet the 1% rule (rent ≥ 1% of price), the offer needs to be $145k (3.2% below list).
- Recommended offer: $145k (3.2% below list) — sets the bar for 1% rule.
- Cap rate 7.4% vs local median 3.8% in Palatka — top-decile yield for the area; either an underpriced asset or a hidden risk that comps aren't pricing in. Stress-test before assuming the spread holds.
Location & tenants
- Location reads 58/100 on livability (#839 in FL) — a working-class tenant base; expect higher turnover. Strengths: cost of living A+, housing B+; Watch: schools C-, health & safety C-, crime D.
- Putnam (town): math 34% / reading 39% proficiency, ranked #66 of 73 in FL (top 90%) — families likely to look elsewhere, expect single-tenant / working-renter base with shorter leases; 71% free/reduced lunch — lower-income household profile, screen leases tightly.
- Market conditions: Rents rising (+2.2%/yr); 319 active listings in the ZIP; 7 comparable units currently listed for rent nearby; rentals at typical pace (median 24d on market — plan ~3-4 weeks tenant-placement turnaround); 113 units permitted in Putnam County in 2024 (0 in 5+ unit buildings).
- This rent runs 36% of the median local income ($48k/yr) — at the standard rent-burdened threshold; future hikes will face affordability resistance.
Forward outlook
- Local home prices are declining (-3.0%/yr); year-one equity from $1k of loan paydown is wiped out by about $4k of value loss. Plan a longer hold.
- Putnam County population projected at -31% by 2050 — secular population decline; favor cash flow + early exit over multi-decade hold.
Negotiation context
- It's been on market 16 days — a 2% lower offer ($148k) is reasonable based on typical stale-listing flexibility.
- 5 sale attempts since 22y ago with the ask held roughly flat each time — persistent listings suggest the price (not the market) is what's stuck; bring a comps-based counter.
- Current owner paid $107k; 40% above their basis — modest negotiation headroom, anchor on the comps not their cost.
Risks & watch-outs
- Watch-outs: built in 1920 — expect roof / HVAC / electrical / plumbing capex.
- Climate carrying-cost: severe wind risk, 99% chance of damaging wind over 30y; extreme-heat days projected 7→20/yr by 2055 (HVAC capex compounding) — expect insurance premiums to compound above CPI over the hold.
Questions for the listing agent
- Built in 1920 — when were the roof, HVAC, electrical panel, plumbing, and water heater last replaced?
- Is there a deadline driving the sale (1031 exchange, divorce, estate, relocation)? That informs how much negotiation room exists.
- Crime grade is D in this area — have there been break-ins, vandalism, or insurance claims at this property in the last 3 years? What carrier currently insures it and at what premium?
- What's the average days-on-market for RENTAL listings here right now (not sales)? A rising rental-DOM trend means longer vacancies and softer asking-rent achievability than the comps imply.
- What's the recent tenant-quality profile in this submarket — average credit score on applications, eviction rate, late-payment / NSF rate, and stable-employment percentage? A property-management company in the area should have these aggregated.
- How much new for-sale + rental construction is in the pipeline within 1–3 miles? Heavy new supply typically softens prices + rents 12–24 months out; constrained supply supports both.
Investment metrics
- 1% rule
- 0.97% ✗
- Cap rate
- 7.40%
- Cash-on-cash
- 3.96%
- DSCR
- 1.18
- GRM
- 8.6
CMA / ARV
- ARV (on-the-fly)
- $234,395
- Comps found
- 12
Show comp detail 12 sales within ~0.75 mi
| Address | Dist | Beds/Ba | Sqft | Sold | Price | $/sf | Match |
|---|---|---|---|---|---|---|---|
| 1022 S 12th St | 0.07mi | 2/1.0 | 1,104 (-15%) | 10mo | $87,000 | $79 | 64 |
| 1404 Diana Dr | 0.56mi | 3/2.0 (+1) | 1,308 (+1%) | 0mo | $255,000 | $195 | 63 |
| 504 Moseley Ave | 0.72mi | 2/1.0 | 1,295 (0%) | 7mo | $85,000 | $66 | 60 |
| 1403 Prospect St | 0.61mi | 3/2.0 (+1) | 1,296 (+0%) | 3mo | $219,900 | $170 | 60 |
| 1403 15th St | 0.17mi | 3/1.0 (+1) | 1,481 (+14%) | 11mo | $233,000 | $157 | 54 |
| 510 S 19th St | 0.64mi | 3/2.0 (+1) | 1,334 (+3%) | 5mo | $250,000 | $187 | 52 |
| 1410 Cleveland Ave | 0.58mi | 3/2.0 (+1) | 1,242 (-4%) | 10mo | $233,500 | $188 | 49 |
| 1602 Prospect St | 0.68mi | 2/2.0 | 1,224 (-6%) | 8mo | $222,000 | $181 | 48 |
| 921 Husson Ave | 0.74mi | 3/2.0 (+1) | 1,352 (+4%) | 2mo | $237,000 | $175 | 47 |
| 1407 High St | 0.49mi | 3/2.0 (+1) | 1,415 (+9%) | 9mo | $259,000 | $183 | 45 |
| 1614 High St | 0.58mi | 3/2.0 (+1) | 1,134 (-12%) | 10mo | $215,000 | $190 | 35 |
| 1604 Husson Ave | 0.74mi | 3/1.0 (+1) | 1,118 (-14%) | 5mo | $182,000 | $163 | 33 |
Match score weights: distance 35% · size 25% · config 20% · recency 20%. Top-matched comps best support the ARV.
Projected returns pro-forma
-3.0% appreciation · 2.23% rent growth · sell at horizon
- IRR
- -10.9%
- Equity multiple
- 0.61×
- Total profit
- $-16,582
- Equity at exit
- $22,365
- IRR
- -2.8%
- Equity multiple
- 0.82×
- Total profit
- $-7,554
- Equity at exit
- $12,969
Cash invested: $42,000 (down + closing). Projections, not guarantees.
Landlord ↔ Tenant lean methodology
- Overall (STATE)
- 87 Strongly Landlord-Friendly
- State Florida
- 87 Strongly Landlord-Friendly · R+3
- County
- — inherits STATE
- City
- — inherits STATE
ZIP-level market 32177
- Home prices YoY
- -28.1%
- Rents YoY
- 2.2%
- Active inventory
- 319
- Price-to-rent
- 8.6×
Monthly cashflow live
- Estimated rent
- $1,452 high interval (Pro) →
- Mortgage (P&I)
- −$787
- Tax from tax record
- −$159 /mo · $1,910/yr
- Insurance
- −$62
- HOA
- −$0
- Vacancy / Maint / Mgmt
- −$305
- Net cashflow
- $139
Break-even live
UW: 25.0% down · 7.5% · 30yr · 1.5% tax · 5.0% vac · 8.0% maint · 8.0% mgmt
Financing live
Cash to close
- Down payment
- $37,500
- Closing costs
- $4,500
- Reserves months
- —
- Total cash needed
- —
Loan-product check · same deal, 3 products live
Conventional
25% down · 7.5% · 30yr
- Down + closing
- —
- Monthly P&I
- —
- Monthly cashflow
- —
- DSCR
- —
- Eligible?
- —
Personal DTI + credit; lowest rate.
DSCR
20% down · 8.5% · 30yr
- Down + closing
- —
- Monthly P&I
- —
- Monthly cashflow
- —
- DSCR
- —
- Eligible?
- —
No personal income docs; deal must DSCR.
Hard money
10% down · 12.0% · 12mo
- Down + closing
- —
- Monthly P&I
- —
- Monthly cashflow
- —
- DSCR
- —
- Eligible?
- —
Short-term bridge; refi at stabilization.
Rent comps 7 comps
| Address | Beds | Baths | Sqft | Rent | $/sqft | DOM | Units | Dist |
|---|---|---|---|---|---|---|---|---|
| 2113 Silver Lake Dr Palatka, FL | 2.0 | 1.0 | 988 | $1,500 | $1.52 | 23d | 1 | 0.55mi |
| 1510 Cleveland Ave Palatka, FL | 2.0 | 1.0 | 916 | $1,350 | $1.47 | 23d | 1 | 0.63mi |
| 1510 Laurel St Palatka, FL | 3.0 | 1.0 | 1080 | $1,659 | $1.54 | 4d | 1 | 0.71mi |
| 105 N 2nd St Palatka, FL | 2.0 | 2.0 | 924 | $1,650 | $1.79 | 23d | 1 | 0.99mi |
| 716 Bronson St Palatka, FL | 3.0 | 1.0 | 900 | $1,175 | $1.31 | 23d | 1 | 1.15mi |
| 1511 S Palm Ave Unit 4 Palatka, FL | 3.0 | 1.0 | 1224 | $1,250 | $1.02 | 23d | 1 | 1.17mi |
| 2406 Husson Ave Palatka, FL | 3.0 | 2.0 | 1559 | $1,900 | $1.22 | 20d | 1 | 1.18mi |
Listing history 11 events
-
2026-06-18days on market $150,000 Active 16 DOM
-
2026-06-17days on market $150,000 Active 15 DOM
-
2026-06-16days on market $150,000 Active 14 DOM
-
2026-06-15days on market $150,000 Active 13 DOM
-
2026-06-13days on market $150,000 Active 11 DOM
-
2026-06-09days on market $150,000 Active 7 DOM
-
2026-06-08days on market $150,000 Active 6 DOM
-
2026-06-07days on market $150,000 Active 5 DOM
-
2026-06-05days on market $150,000 Active 2 DOM
-
2026-06-02remarks 699-char remark
-
2026-06-02$150,000 Active 1 DOM
ⓘ Source: listings_history table (triggers on properties + properties_extension) + one-shot
backfill from property_details.listing_events for pre-trigger history.
Tax reassessment forecast FL · Resets to sale price
- Current annual tax
- $1,910 · $159/mo
- Projected year-2 tax
- $1,910 · $159/mo
- Expected delta
- $0/yr ($0/mo · 0.0%)
ⓘ Screening estimate from a state-policy table — verify with the county assessor before closing.
Climate risk First Street
- Flood 1/10 Low FEMA zone X (unshaded) · 0% chance over 30 yrs
- Wildfire 4/10 Moderate
- Heat 9/10 Extreme 7 d/yr ≥108°F today · 20 d/yr by 30 yrs out
- Wind 9/10 Extreme 99% chance of damaging wind over 30 yrs
- Air quality 2/10 Low 2 unhealthy d/yr today · 2 by 30 yrs out
Nearby sold comps map
Loading sold comps map…
Walkable amenities ~0.75 mi
Loading nearby amenities…
Taxation est. · year 1
- Rental income
- $17,423
- − Mortgage interest
- −$8,402
- − Property taxes
- −$1,910
- − Insurance
- −$750
- − Repairs & maintenance
- −$1,394
- − Management
- −$1,394
- − Depreciation
- −$4,364
- Taxable loss
- −$791
- Est. tax savings @ 24.0%
- +$190
- After-tax cash flow
- $1,855/yr
For passive investors: Depreciation is non-cash, so a rental often shows a tax loss while cash-flowing — sheltering income. Rental losses are passive: they offset passive income freely, and up to $25,000/yr can offset ordinary (W-2) income if you actively participate and your MAGI is under $100k (phasing out to $0 by $150k); unused losses carry forward. On sale, claimed depreciation is recaptured at up to 25%, and gains may owe capital-gains tax (a 1031 exchange can defer both). Figures are a year-1 estimate at your 24.0% rate — not tax advice; consult a CPA.
Schools (NCES district)
- District
- Putnam
- NCES district ID
- 1201620
- Math proficiency
- 34% ▼ -10.00%
- Reading proficiency
- 39% ▼ -4.00%
- Median HH income
- $33,350
- Composite
- 29.99/100
- National rank
- #6361
- State rank
- #66 of 73 in FL
Livability — Palatka
- Score
- 58/100
- State rank
- #839
- US rank
- #20793
Category grades
Schools grade is shown separately in the Schools card above.
Census & demographics
- Census place
- Palatka, FL
- County
- Putnam County · 25,645 people
- City population
- 25,645
- Metro
- Palatka, FL
- Population (ZIP)
- 25,645
- Household income
- $47,796
- Rent vs Own
- Severe rent burden
- 806.0
Population outlook (Putnam County) Hauer SSP2
- Today (2025)
- 65,299 people
- By 2030
- 61,255 · -6.2%
- By 2040
- 52,930 · -18.9%
- By 2050
- 45,051 · -31.0%
- By 2075
- 28,720 · -56.0%
- By 2100
- 15,852 · -75.7%
Race, ethnicity, and origin ACS 2023
- Neighborhood character
- Majority White (62%)
- Race & ethnicity
- White 62% Black 28% Hispanic / Latino 7% Two or more races 5%
- Hispanic origin (detail)
- Mexican 2% Puerto Rican 3% Cuban 2%
- Common ancestry
- Lithuanian 2% Hispanic 1% Slovak 1%
- Foreign-born
- 3% · Canada
- Languages at home
- 94% English-only · Spanish 5% French/Haitian/Cajun 1%
Political lean MEDSL · Putnam
- 2024 margin
- Solid R (+47.8) · D 25.8% · R 73.6%
- 2008→2024 swing
- -28.5pp toward R · 2008: -19.3pp · 2024: -47.8pp
- All cycles
- 2024: R+47.8 2020: R+41.2 2016: R+36.6 2012: R+24.5 2008: R+19.3
Not yet ingested
- Civics
- —
Market trends
- HPI YoY
- ▼ -87.10%
- Current HPI
- 223.1966
- Rent YoY
- ▲ 2.23%
- Metro
- Palatka, FL
- State GDP YoY
- ▲ 3.28%
- F500 in state
- 36
Industry mix (Fortune 500 HQ in FL)
| Industry | F500 HQs | Revenue |
|---|---|---|
| Industrial Technology | 2 | $29B |
|
||
| Insurance | 2 | $17B |
|
||
| Retail | 1 | $60B |
|
||
| Technology Distribution | 1 | $58B |
|
||
| Homebuilding | 1 | $35B |
|
||
| Technology Manufacturing | 1 | $35B |
|
||
Price history
+279.7% since first listed15 events — show timeline
- 2026-06-02 Listed $150,000 realMLS
- 2026-04-17 Listing Removed — realMLS
- 2026-03-19 Price Changed $174,900 realMLS
- 2026-02-28 Listed $179,900 realMLS
- 2025-12-28 Listing Removed — realMLS
- 2025-12-15 Listed $178,000 realMLS
- 2022-02-01 Sold (Public Records) $107,000 Public Records
- 2022-01-31 Sold (MLS) $107,000 realMLS
- 2021-12-11 Pending — realMLS
- 2021-12-06 Listed $110,000 realMLS
- 2020-10-28 Sold (Public Records) $69,000 Public Records
- 2005-04-01 Sold (Public Records) $37,600 Public Records
- 2005-03-31 Listing Removed — realMLS
- 2005-03-24 Sold (MLS) $37,525 realMLS
- 2004-12-13 Listed $39,500 realMLS
Property tax history
+3.5%/yrLatest (2025): $1,910 · -6.6% YoY. Source: county tax records.
Cash-flow waterfall
monthlySold comps — $/sqft
last 12 mo · ≤1 miLoading sold comps…