3518 N Capitol Ave · Indianapolis city (balance), IN
Flood risk 6/10 · Moderate
- FEMA flood zone
- X (unshaded)
- Chance of flooding over 30 yrs
- 0.69%
- Est. flood insurance / yr
- $473 – $860
Fire risk 1/10 · Minimal
- Est. fire insurance / yr
- $717 – $1,331
Heat risk 4/10 · Minor
- Hot days now (above 101°F)
- 7 days/yr
- Hot days in 30 yrs
- 19 days/yr
Wind risk 2/10 · Minimal
- Chance of severe wind over 30 yrs
- 0.0%
Air-quality risk 4/10 · Minor
- Unhealthy air days now
- 5 days/yr
- Unhealthy air days in 30 yrs
- 7 days/yr
Risk factors via First Street. Map © Google.
Why this score? — see what drove the B- grade
The composite is a weighted blend of 9 inputs, each scored 0–100. Each bar is that input's sub-score; the figure is the points it added to the 100-point composite (weight × sub-score).
- Cash flow +26.1/30.0
- ARV discount +15.0/15.0
- DSCR +8.8/10.0
- 1% rule +7.8/10.0
- Rent growth +4.1/5.0
- Livability +2.5/5.0
- Condition / age +2.5/5.0
- Schools +1.4/10.0
- Appreciation +0.0/10.0
$94,900
🖨 Deal sheet 📄 Offer letter ✓ Due diligence
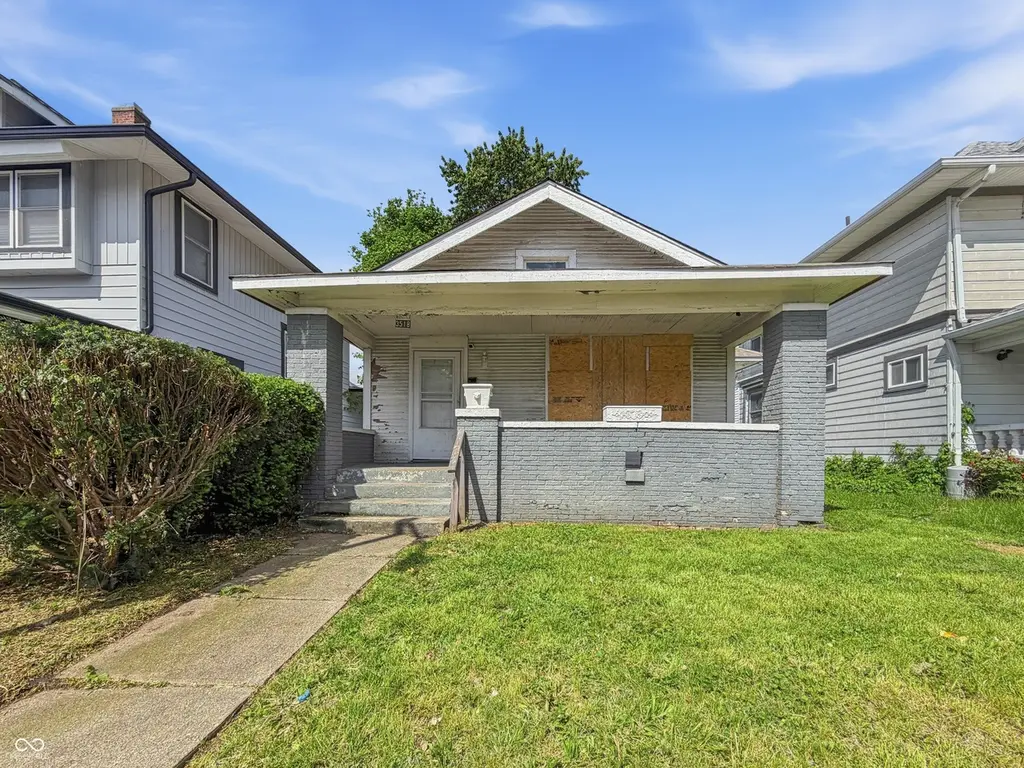
Listing remarks
This charming bungalow blends timeless character with the comfort of easy, single-level living. From the moment you arrive, you'll appreciate the inviting feel and the cozy layout that makes this home so appealing. Whether you're looking for a starter home, a place to downsize, or a smart investment, this one is worth a closer look. Built in 1910, this home offers 1,054 square feet of living space with low-maintenance vinyl siding and vinyl windows. Inside, you'll find 2 bedrooms and 1 full bathroom, with a functional layout that makes the most of every square foot. With no garage, the property offers a simple, manageable option full of charm and potential.
Key facts
- 5,271 sq ft lot
- Built 1910
- Listed 36 days
Property features AI
Exterior
- Utilities: Public water; Municipal sewer connected; Solid waste service available
- Home design: Single-family residence; One level
- Construction: Vinyl siding; Block and brick/mortar foundation (full)
- Exterior features: Lot under 1/4 acre (approximately 0.12 acre)
Interior
- Kitchen: Kitchen on main level
- Bedrooms: 2 bedrooms on the main level
- Flooring: Hardwood floors
- Bathrooms: 1 full bathroom on the main level
- Heating & cooling: Forced air heating; Natural gas heating; No central cooling
- Interior features: Hardwood floors; Woodwork stained/painted; Finished basement area
- Laundry & utility: No appliances listed
Neighborhood map
What this means for you Summary
Snapshot
- This is a 2-bed/1.0-bath single-family listed at $95k.
Deal economics
- At list price, monthly cash flow is $239 ($3k/yr) — positive.
- The deal already cash-flows at list — no discount required.
- Meets the 1% rule at list price ($1k rent vs $95k).
- Recommended offer: $92k (3.0% below list) — sets the bar for market timing.
- Cap rate 9.3% vs local median 4.4% in Indianapolis city (balance) — top-decile yield for the area; either an underpriced asset or a hidden risk that comps aren't pricing in. Stress-test before assuming the spread holds.
Location & tenants
- Location reads: area grade B — affects rentability + tenant quality, not the cash-flow math above.
- Indianapolis Public Schools (urban): math 14% / reading 20% proficiency, ranked #286 of 301 in IN (top 95%) — low school quality limits family demand, transient renter base, plan for 1-2y turnover; 77% free/reduced lunch — lower-income household profile, screen leases tightly.
- Market conditions: Rents rising fast (+6.4%/yr); 279 active listings in the ZIP; 40 comparable units currently listed for rent nearby; rentals at typical pace (median 24d on market — plan ~3-4 weeks tenant-placement turnaround); 1,906 units permitted in Marion County in 2024 (621 in 5+ unit buildings).
Forward outlook
- Local home prices are declining (-3.0%/yr); year-one equity from $656 of loan paydown is wiped out by about $3k of value loss. Plan a longer hold.
- Marion County population projected at +18% by 2050 — long-run rental-demand tailwind backs the buy-and-hold thesis.
- At projected returns (-3.0% appreciation + 6.4% rent growth), your $27k cash investment doubles in ~8 years — after that, you're playing with house money.
Negotiation context
- It's been on market 36 days — a 3% lower offer ($92k) is reasonable based on typical stale-listing flexibility.
- 3 sale attempts since 14y ago with the ask held roughly flat each time — persistent listings suggest the price (not the market) is what's stuck; bring a comps-based counter.
Risks & watch-outs
- Watch-outs: built in 1910 — expect roof / HVAC / electrical / plumbing capex.
- Climate carrying-cost: major flood risk — expect insurance premiums to compound above CPI over the hold.
Questions for the listing agent
- It's been on market 36 days. Have you received any prior offers? Is the seller open to a 3% concession, seller financing, or rate buy-down credit?
- Built in 1910 — when were the roof, HVAC, electrical panel, plumbing, and water heater last replaced?
- Is there a deadline driving the sale (1031 exchange, divorce, estate, relocation)? That informs how much negotiation room exists.
- What's the average days-on-market for RENTAL listings here right now (not sales)? A rising rental-DOM trend means longer vacancies and softer asking-rent achievability than the comps imply.
- What's the recent tenant-quality profile in this submarket — average credit score on applications, eviction rate, late-payment / NSF rate, and stable-employment percentage? A property-management company in the area should have these aggregated.
- How much new for-sale + rental construction is in the pipeline within 1–3 miles? Heavy new supply typically softens prices + rents 12–24 months out; constrained supply supports both.
Investment metrics
- 1% rule
- 1.28% ✓
- Cap rate
- 9.32%
- Cash-on-cash
- 10.81%
- DSCR
- 1.48
- GRM
- 6.5
CMA / ARV
- ARV (median comp)
- $161,580
- List price
- $94,900
- Delta
- -41.27%
- Verdict
- UNDERPRICED
- Comps
- 20 within 1.0 mi
Show comp detail 10 sales within ~0.75 mi
| Address | Dist | Beds/Ba | Sqft | Sold | Price | $/sf | Match |
|---|---|---|---|---|---|---|---|
| 2949 Shriver Ave | 0.74mi | 3/1.0 (+1) | 1,080 (+2%) | 2mo | $138,000 | $128 | 54 |
| 3017 Ethel Ave | 0.74mi | 3/1.5 (+1) | 1,079 (+2%) | 7mo | $90,000 | $83 | 49 |
| 3151 Graceland Ave | 0.49mi | 3/1.0 (+1) | 1,200 (+14%) | 1mo | $169,900 | $142 | 48 |
| 332 Northern Ave | 0.53mi | 3/1.5 (+1) | 1,128 (+7%) | 10mo | $162,500 | $144 | 48 |
| 3239 Graceland Ave | 0.35mi | 3/1.0 (+1) | 1,152 (+9%) | 19mo | $179,000 | $155 | 48 |
| 260 W 33rd St | 0.32mi | 3/1.5 (+1) | 1,200 (+14%) | 10mo | $115,000 | $96 | 47 |
| 330 Congress Ave | 0.55mi | 3/2.0 (+1) | 1,156 (+10%) | 3mo | $210,000 | $182 | 47 |
| 3035 Graceland Ave | 0.61mi | 3/2.0 (+1) | 1,001 (-5%) | 10mo | $140,000 | $140 | 46 |
| 3042 Graceland Ave | 0.60mi | 3/2.0 (+1) | 1,200 (+14%) | 3mo | $163,700 | $136 | 38 |
| 3137 Graceland Ave | 0.51mi | 3/1.5 (+1) | 1,200 (+14%) | 24mo | $210,000 | $175 | 26 |
Match score weights: distance 35% · size 25% · config 20% · recency 20%. Top-matched comps best support the ARV.
Projected returns pro-forma
-3.0% appreciation · 6.43% rent growth · sell at horizon
- IRR
- 4.0%
- Equity multiple
- 1.16×
- Total profit
- $4,267
- Equity at exit
- $14,150
- IRR
- 16.7%
- Equity multiple
- 2.61×
- Total profit
- $42,678
- Equity at exit
- $8,205
Cash invested: $26,572 (down + closing). Projections, not guarantees.
Landlord ↔ Tenant lean methodology
- Overall (STATE)
- 90 Strongly Landlord-Friendly
- State Indiana
- 90 Strongly Landlord-Friendly · R+11
- County
- — inherits STATE
- City
- — inherits STATE
ZIP-level market 46208
- Rents YoY
- 6.4%
- Active inventory
- 279
- Price-to-rent
- 6.5×
Monthly cashflow live
- Estimated rent
- $1,214 high interval (Pro) →
- Mortgage (P&I)
- −$498
- Tax from tax record
- −$183 /mo · $2,191/yr
- Insurance
- −$40
- HOA
- −$0
- Vacancy / Maint / Mgmt
- −$255
- Net cashflow
- $239
Break-even live
UW: 25.0% down · 7.5% · 30yr · 1.5% tax · 5.0% vac · 8.0% maint · 8.0% mgmt
Financing live
Cash to close
- Down payment
- $23,725
- Closing costs
- $2,847
- Reserves months
- —
- Total cash needed
- —
Loan-product check · same deal, 3 products live
Conventional
25% down · 7.5% · 30yr
- Down + closing
- —
- Monthly P&I
- —
- Monthly cashflow
- —
- DSCR
- —
- Eligible?
- —
Personal DTI + credit; lowest rate.
DSCR
20% down · 8.5% · 30yr
- Down + closing
- —
- Monthly P&I
- —
- Monthly cashflow
- —
- DSCR
- —
- Eligible?
- —
No personal income docs; deal must DSCR.
Hard money
10% down · 12.0% · 12mo
- Down + closing
- —
- Monthly P&I
- —
- Monthly cashflow
- —
- DSCR
- —
- Eligible?
- —
Short-term bridge; refi at stabilization.
Rent comps 40 comps
| Address | Beds | Baths | Sqft | Rent | $/sqft | DOM | Units | Dist |
|---|---|---|---|---|---|---|---|---|
| 3469 Graceland Ave Indianapolis, IN | 2.0 | 1.0 | 1000 | $1,200 | $1.20 | 43d | 1 | 0.06mi |
| 143 W 35th St Indianapolis, IN | 3.0 | 1.0 | 1235 | $1,175 | $0.95 | 7d | 1 | 0.07mi |
| 3502 N Kenwood Ave Indianapolis, IN | 3.0 | 2.0 | 1094 | $1,220 | $1.12 | 43d | 1 | 0.08mi |
| 3622 N Capitol Ave Indianapolis, IN | 3.0 | 1.0 | 1300 | $1,300 | $1.00 | 7d | 1 | 0.12mi |
| 3415 N Capitol Ave Indianapolis, IN | 3.0 | 1.0 | 1176 | $1,249 | $1.06 | 23d | 1 | 0.16mi |
| 3413 N Capitol Ave Indianapolis, IN | 3.0 | 1.0 | 1176 | $1,249 | $1.06 | 10d | 1 | 0.16mi |
| 3501 N Illinois St Unit 3 Indianapolis, IN | 2.0 | 2.0 | 1087 | $1,350 | $1.24 | 7d | 1 | 0.17mi |
| 3457 N Illinois St Indianapolis, IN | 3.0 | 2.0 | 1230 | $1,145 | $0.93 | 23d | 1 | 0.18mi |
| 3540 N Meridian St Indianapolis, IN | 1.0 | 1.0 | 757 | $789 | $1.04 | 4d | 3 | 0.24mi |
| 3729 N Kenwood Ave Indianapolis, IN | 2.0 | 1.0 | 1107 | $1,100 | $0.99 | 43d | 1 | 0.28mi |
| 3640 N Meridian St Unit 01 Indianapolis, IN | 3.0 | 1.0 | 1000 | $999 | $1.00 | 43d | 1 | 0.29mi |
| 3640 N Meridian St Unit 13 Indianapolis, IN | 1.0 | 1.0 | 700 | $699 | $1.00 | 23d | 1 | 0.29mi |
| 3640 N Meridian St Unit 11 Indianapolis, IN | 1.0 | 1.0 | 700 | $699 | $1.00 | 43d | 1 | 0.29mi |
| 3710 N Meridian St Indianapolis, IN | 2.0 | 1.0–2.0 | 670 | $969 | $1.45 | 2d | 34 | 0.30mi |
| 3541 N Meridian St Indianapolis, IN | 1.0–2.0 | 1.0 | 987 | $880 | $0.89 | 43d | 1 | 0.31mi |
| 3601 N Meridian St Indianapolis, IN | 1.0 | 1.0 | 700 | $775 | $1.11 | 23d | 1 | 0.32mi |
| 3707 N Meridian St Indianapolis, IN | 2.0 | 1.0–2.0 | 1042 | $1,199 | $1.15 | 43d | 1 | 0.34mi |
| 3726 N Meridian St Apt 33 Indianapolis, IN | 1.0 | 1.0 | 725 | $750 | $1.03 | 23d | 1 | 0.34mi |
| 3310 N Meridian St Indianapolis, IN | 1.0–2.0 | 1.0 | 750 | $1,150 | $1.53 | 43d | 3 | 0.37mi |
| 3524 N Pennsylvania St Indianapolis, IN | 2.0 | 1.0 | 725 | $872 | $1.20 | 3d | 4 | 0.37mi |
| 3671 N Pennsylvania St Indianapolis, IN | 2.0 | 1.0 | 725 | $794 | $1.10 | 19d | 1 | 0.47mi |
| 3801 N Meridian St Indianapolis, IN | 1.0–3.0 | 1.0–2.0 | 1057 | $1,474 | $1.39 | 20d | 35 | 0.48mi |
| 57 E 38th St Indianapolis, IN | 1.0 | 1.0 | 750 | $770 | $1.03 | 2d | 4 | 0.49mi |
| 3554 N Washington Blvd Apt 2 Indianapolis, IN | 1.0 | 1.0 | 800 | $750 | $0.94 | 43d | 1 | 0.50mi |
| 3558 Washington Blvd Indianapolis, IN | 3.0 | 1.0 | 975 | $1,199 | $1.23 | 7d | 1 | 0.50mi |
| 319 W 40th St Indianapolis, IN | 3.0 | 1.0 | 1176 | $1,295 | $1.10 | 14d | 1 | 0.58mi |
| 3103 N Meridian St Indianapolis, IN | 3.0 | 2.0 | 1280 | $1,775 | $1.39 | 23d | 1 | 0.62mi |
| 3031 Boulevard Pl Indianapolis, IN | 3.0 | 1.5 | 1395 | $1,450 | $1.04 | 17d | 1 | 0.62mi |
| 3558 Central Ave Indianapolis, IN | 3.0 | 1.0 | 1215 | $2,100 | $1.73 | 23d | 1 | 0.63mi |
| 4031 Boulevard Pl Indianapolis, IN | 1.0 | 1.0 | 700 | $895 | $1.28 | 20d | 1 | 0.64mi |
| 3965 N Meridian St Indianapolis, IN | 2.0 | 2.0 | 1360 | $1,650 | $1.21 | 23d | 1 | 0.64mi |
| 3815 Washington Blvd Indianapolis, IN | 2.0 | 1.0 | 1000 | $1,250 | $1.25 | 7d | 1 | 0.67mi |
| 3924 Byram Ave Indianapolis, IN | 1.0 | 1.0 | 810 | $1,099 | $1.36 | 4d | 1 | 0.67mi |
| 512 E 33rd St Indianapolis, IN | 3.0 | 1.0 | 1208 | $1,200 | $0.99 | 23d | 1 | 0.74mi |
| 3017 Ethel Ave Indianapolis, IN | 3.0 | 1.5 | 1079 | $1,400 | $1.30 | 23d | 1 | 0.74mi |
| 514 E 33rd St Indianapolis, IN | 3.0 | 1.0 | 1208 | $1,200 | $0.99 | 23d | 1 | 0.74mi |
| 608 Bernard Ave Indianapolis, IN | 3.0 | 2.0 | 1056 | $1,475 | $1.40 | 3d | 1 | 0.78mi |
| 321 E 31st St Indianapolis, IN | 3.0 | 1.0 | 1390 | $1,400 | $1.01 | 43d | 1 | 0.79mi |
| 2955 N Delaware St Indianapolis, IN | 3.0 | 1.5 | 1400 | $1,600 | $1.14 | 43d | 1 | 0.86mi |
| 648 W 30th St Indianapolis, IN | 3.0 | 2.0 | 1300 | $1,500 | $1.15 | 23d | 1 | 0.86mi |
Listing history 18 events
-
2026-06-18days on market $94,900 Active 36 DOM
-
2026-06-17days on market $94,900 Active 35 DOM
-
2026-06-16days on market $94,900 Active 34 DOM
-
2026-06-15days on market $94,900 Active 33 DOM
-
2026-06-13days on market $94,900 Active 31 DOM
-
2026-06-13days on market $94,900 Active 30 DOM
-
2026-06-09days on market $94,900 Active 27 DOM
-
2026-06-08days on market $94,900 Active 26 DOM
-
2026-06-07days on market $94,900 Active 25 DOM
-
2026-06-03days on market $94,900 Active 21 DOM
-
2026-06-02days on market $94,900 Active 20 DOM
-
2026-06-01days on market $94,900 Active 19 DOM
-
2026-05-31days on market $94,900 Active 18 DOM
-
2026-05-13$94,900 Active 668-char remark
-
2016-08-02historical
-
2015-08-13$30,000 Active
-
2013-09-21historical
-
2012-08-30$24,500
ⓘ Source: listings_history table (triggers on properties + properties_extension) + one-shot
backfill from property_details.listing_events for pre-trigger history.
Tax reassessment forecast IN · Partial reset (capped growth)
- Current annual tax
- $2,191 · $183/mo
- Projected year-2 tax
- $2,191 · $183/mo
- Expected delta
- $0/yr ($0/mo · 0.0%)
ⓘ Screening estimate from a state-policy table — verify with the county assessor before closing.
Climate risk First Street
- Flood 6/10 Major FEMA zone X (unshaded) · 69% chance over 30 yrs
- Wildfire 1/10 Low
- Heat 4/10 Moderate 7 d/yr ≥101°F today · 19 d/yr by 30 yrs out
- Wind 2/10 Low 0% chance of damaging wind over 30 yrs
- Air quality 4/10 Moderate 5 unhealthy d/yr today · 7 by 30 yrs out
Nearby sold comps map
Loading sold comps map…
Walkable amenities ~0.75 mi
Loading nearby amenities…
Taxation est. · year 1
- Rental income
- $14,571
- − Mortgage interest
- −$5,316
- − Property taxes
- −$2,191
- − Insurance
- −$474
- − Repairs & maintenance
- −$1,166
- − Management
- −$1,166
- − Depreciation
- −$2,761
- Taxable income
- $1,498
- Est. tax owed @ 24.0%
- −$359
- After-tax cash flow
- $2,514/yr
For passive investors: Depreciation is non-cash, so a rental often shows a tax loss while cash-flowing — sheltering income. Rental losses are passive: they offset passive income freely, and up to $25,000/yr can offset ordinary (W-2) income if you actively participate and your MAGI is under $100k (phasing out to $0 by $150k); unused losses carry forward. On sale, claimed depreciation is recaptured at up to 25%, and gains may owe capital-gains tax (a 1031 exchange can defer both). Figures are a year-1 estimate at your 24.0% rate — not tax advice; consult a CPA.
Schools (NCES district)
- District
- Indianapolis Public Schools
- NCES district ID
- 1804770
- Math proficiency
- 14% ▼ -7.00%
- Reading proficiency
- 20% ▼ -3.00%
- Median HH income
- $32,034
- Composite
- 13.69/100
- National rank
- #9499
- State rank
- #286 of 301 in IN
Livability — Indianapolis city (balance)
No livability data for this city. (Only ~50 U.S. cities are tracked.)
Census & demographics
- Census place
- Indianapolis city (balance), IN
- County
- Marion County · 998,460 people
- City population
- 881,119
- Metro
- Indianapolis-Carmel-Anderson, IN
- Population (ZIP)
- 22,379
- Household income
- $60,062
- Rent vs Own
- Severe rent burden
- 978.0
Population outlook (Marion County) Hauer SSP2
- Today (2025)
- 1,025,572 people
- By 2030
- 1,065,727 · +3.9%
- By 2040
- 1,141,577 · +11.3%
- By 2050
- 1,208,920 · +17.9%
- By 2075
- 1,367,288 · +33.3%
- By 2100
- 1,438,201 · +40.2%
Race, ethnicity, and origin ACS 2023
- Neighborhood character
- Diverse neighborhood (Simpson 0.62)
- Race & ethnicity
- White 46% Black 40% Hispanic / Latino 8% Two or more races 6% Asian 2%
- Hispanic origin (detail)
- Mexican 4%
- Common ancestry
- Romanian 2% Slovak 2% Italian 1%
- Foreign-born
- 4% · Canada
- Languages at home
- 93% English-only · Spanish 5% French/Haitian/Cajun 1% Other Indo-European 1%
Political lean MEDSL · Marion
- 2024 margin
- Strong D (+27.7) · D 63.0% · R 35.3% · Other 1.7%
- 2008→2024 swing
- -0.7pp no change · 2008: 28.4pp · 2024: 27.7pp
- All cycles
- 2024: D+27.7 2020: D+29.1 2016: D+22.8 2012: D+22.2 2008: D+28.4
Not yet ingested
- Civics
- —
Market trends
- HPI YoY
- ▼ -324.63%
- Current HPI
- 319.7725
- Rent YoY
- ▲ 6.43%
- Metro
- Indianapolis-Carmel-Anderson, IN
- State GDP YoY
- ▲ 2.90%
- F500 in state
- 18
Industry mix (Fortune 500 HQ in IN)
| Industry | F500 HQs | Revenue |
|---|---|---|
| Industrial Machinery | 2 | $37B |
|
||
| Healthcare | 1 | $177B |
|
||
| Pharmaceuticals | 1 | $45B |
|
||
| Metals / Steel | 1 | $18B |
|
||
| Agriculture | 1 | $17B |
|
||
| Packaging | 1 | $12B |
|
||
Price history
+287.3% since first listed5 events — show timeline
- 2026-05-13 Listed $94,900 MIBOR as Distributed by MLS Grid
- 2016-08-02 Listing Removed — MIBOR as Distributed by MLS Grid
- 2015-08-13 Listed $30,000 MIBOR as Distributed by MLS Grid
- 2013-09-21 Listing Removed — MIBOR as Distributed by MLS Grid
- 2012-08-30 Listed $24,500 MIBOR as Distributed by MLS Grid
Property tax history
+10.4%/yrLatest (2025): $2,191 · +28.8% YoY. Source: county tax records.
Cash-flow waterfall
monthlySold comps — $/sqft
last 12 mo · ≤1 miLoading sold comps…